DESDynI OVERVIEW OF THE DESDynI MISSION D eformation, E cosystem S tructure, Dyn amics of I ce K. Jon Ranson; NASA Goddard Space Flight Center Paul Rosen; Jet Propulsion Laboratory Ralph Dubayah; University of Maryland College Park Bradford Hager; Mass. Institute of Technology Ian Joughin; University of Washington Scott Luthcke; NASA GSFC Bryan Blair; NASA GSFC Scott Hensley; JPL Yuhsyen Shen; JPL Gerry Daelemans; NASA GSFC IGARSS10 Honolula,HI Wednesday, July 28, 2010 08:20 - 08:40 1
Transcript
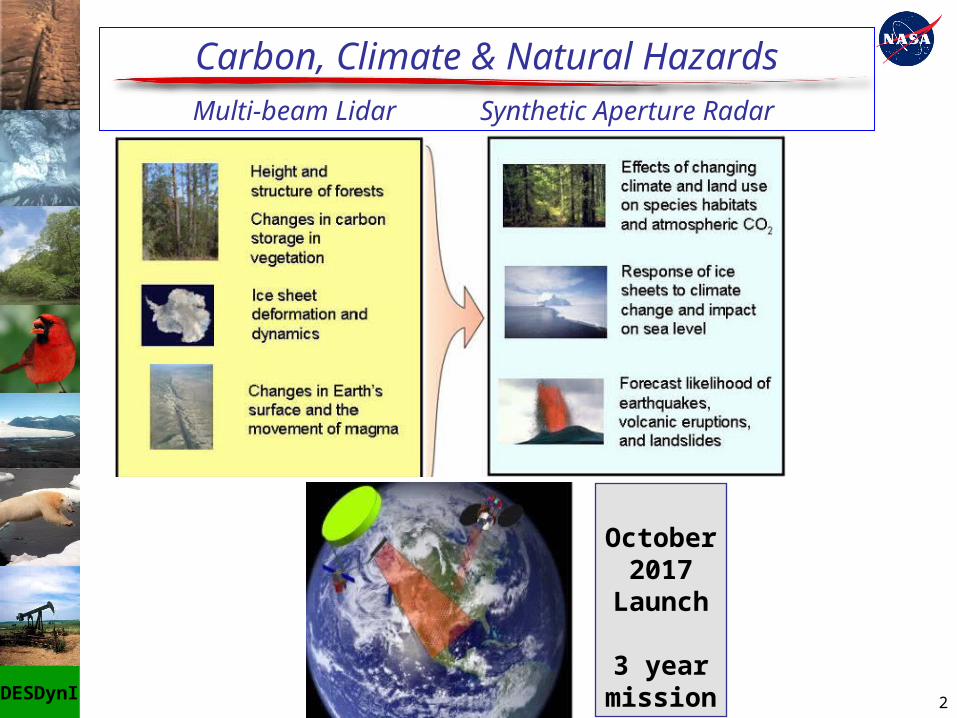
DESDynI
OVERVIEW OF THE DESDynI MISSIONDeformation, Ecosystem Structure,
Dynamics of Ice
K. Jon Ranson; NASA Goddard Space Flight Center Paul Rosen; Jet Propulsion Laboratory
Ralph Dubayah; University of Maryland College Park Bradford Hager; Mass. Institute of Technology
Ian Joughin; University of Washington Scott Luthcke; NASA GSFC Bryan Blair; NASA GSFC
CANNOT CLOSE THE EARTH’S CARBON BUDGET. FOREST BIOMASS AND CHANGE FAR MORE UNCERTAIN THAN ICE!
Vegetation Biomass and Change
5
DESDynI
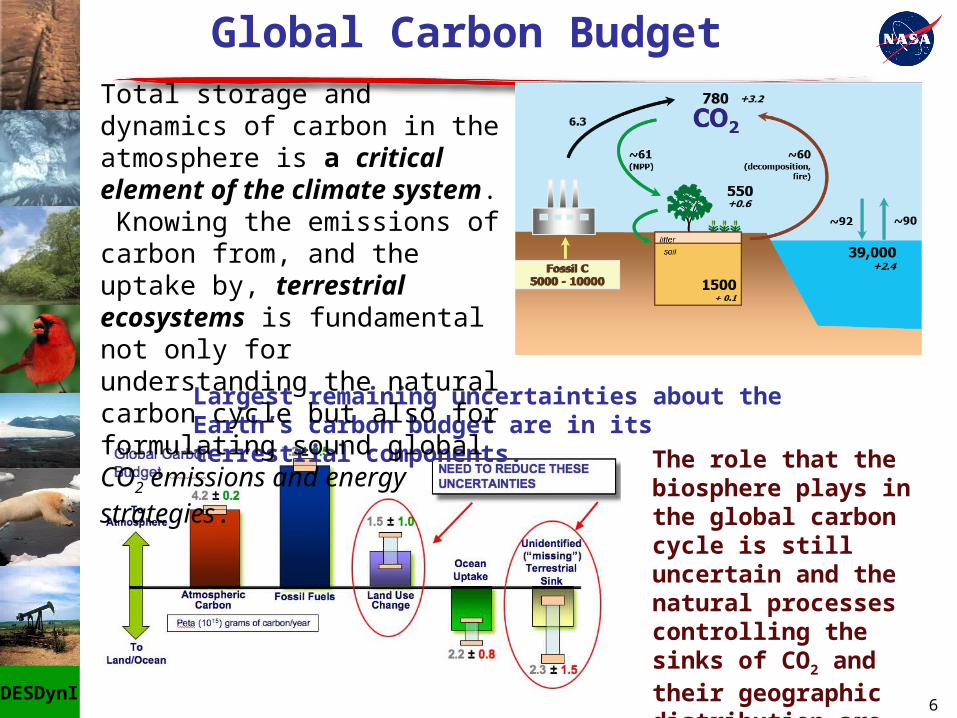
Largest remaining uncertainties about the Earth’s carbon budget are in its terrestrial components.
Global Carbon BudgetTotal storage and dynamics of carbon in the atmosphere is a critical element of the climate system. Knowing the emissions of carbon from, and the uptake by, terrestrial ecosystems is fundamental not only for understanding the natural carbon cycle but also for formulating sound global CO2 emissions and energy strategies.
The role that the biosphere plays in the global carbon cycle is still uncertain and the natural processes controlling the sinks of CO2 and their geographic distribution are unknown.
6
DESDynI
Half of all human carbon emissions are reabsorbed by global ecosystems, one quarter by the earth’s forests.
DESDYnI Ecosystems
Measurements
Why & where is the terrestrial carbon sink?How long can it continue in a changing climate?
7
DESDynI
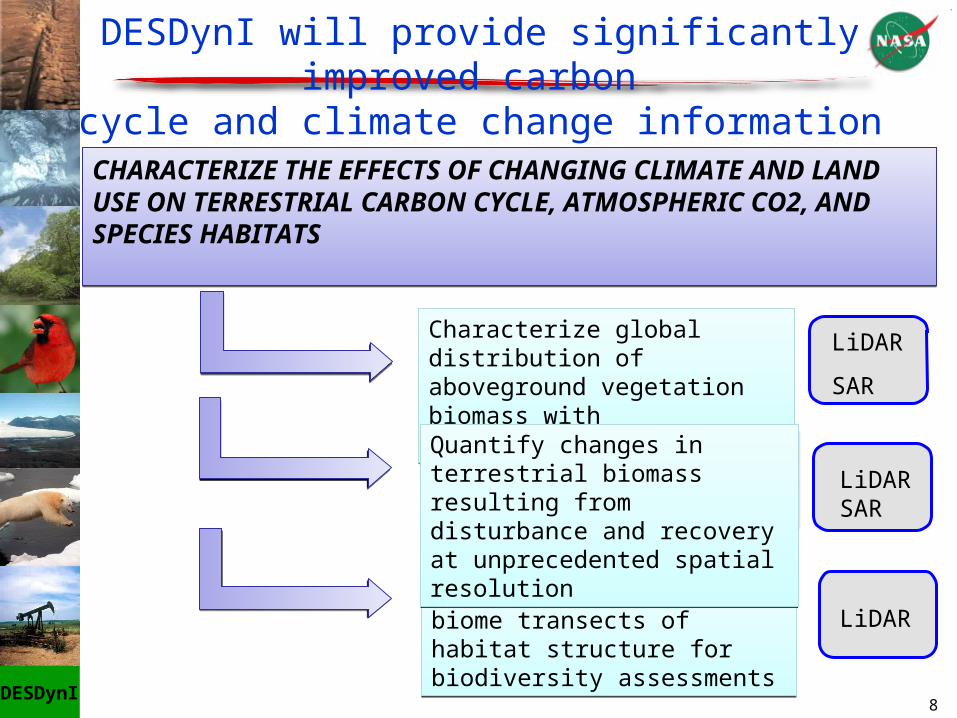
DESDynI will provide significantly improved carbon cycle and climate change information
CHARACTERIZE THE EFFECTS OF CHANGING CLIMATE AND LAND USE ON TERRESTRIAL CARBON CYCLE, ATMOSPHERIC CO2, AND SPECIES HABITATS
CHARACTERIZE THE EFFECTS OF CHANGING CLIMATE AND LAND USE ON TERRESTRIAL CARBON CYCLE, ATMOSPHERIC CO2, AND SPECIES HABITATS
Characterize global distribution of aboveground vegetation biomass with unprecedented accuracy
Characterize global distribution of aboveground vegetation biomass with unprecedented accuracy
Characterize first ever biome transects of habitat structure for biodiversity assessments
Characterize first ever biome transects of habitat structure for biodiversity assessments
Quantify changes in terrestrial biomass resulting from disturbance and recovery at unprecedented spatial resolution
Quantify changes in terrestrial biomass resulting from disturbance and recovery at unprecedented spatial resolution
LiDAR
SAR
LiDARSAR
LiDAR
8
DESDynI
Cryosphere and Climate (IPCC 4th assessment)
The Cryosphere includes: the Greenland and Antarctica ice The Cryosphere includes: the Greenland and Antarctica ice sheets, continental glaciers, snow, sea ice, river and lake ice, sheets, continental glaciers, snow, sea ice, river and lake ice, permafrost and seasonally frozen groundpermafrost and seasonally frozen ground
The Cryosphere has great impact on our climate…The Cryosphere has great impact on our climate…
•By reflecting most solar radiation back into space the cryosphere By reflecting most solar radiation back into space the cryosphere has a great cooling effect on the atmosphere.has a great cooling effect on the atmosphere.
•Ice and snow create a barrier that reduces the exchange of heat Ice and snow create a barrier that reduces the exchange of heat and moisture from the land and ocean surfaces to the air.and moisture from the land and ocean surfaces to the air.
•The melting of ice sheets and glaciers as well as the development The melting of ice sheets and glaciers as well as the development of sea ice influence the global circulation of the oceans by of sea ice influence the global circulation of the oceans by affecting the ratio of fresh water to salt water.affecting the ratio of fresh water to salt water.
•Land ice loss from the ice sheets and glaciers is a major Land ice loss from the ice sheets and glaciers is a major contributor to global sea level rise.contributor to global sea level rise.
9
DESDynI
Polar Ice Mass Balance and Sea Level“The potential cryospheric impact on ocean circulation and sea level are of particular importance…. Even a modest change in ice sheet balance could strongly affect future sea level and freshwater flux to the oceans with possible climatic implications”
IPCC 4th assessment (2007)
“Key questions include: Will there be catastrophic collapse of the major ice sheets… and if so, how rapidly will this occur? What will be the time patterns of sea-level rise…”
NRC Decadal Survey (2007)
• The processes causing present day ice sheet mass balance are not well known, but are improving through a combination of field work, modeling, and multi-sensor remote sensing
• Future change is a complex function of surface processes (e.g. accumulation and melting) as well as dynamic ice sheet behavior
• Current sea level rise totals approximately 3.2 mm/year, with > 50% from ice sheets and mountain glaciers.
10
DESDynI
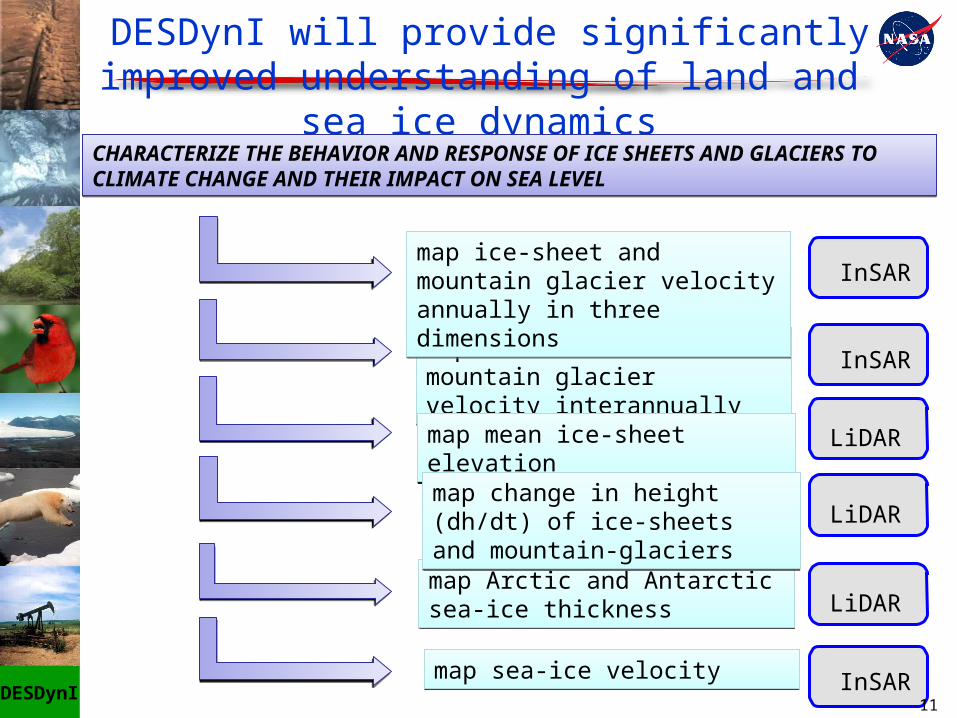
DESDynI will provide significantly improved understanding of land and sea ice dynamics
CHARACTERIZE THE BEHAVIOR AND RESPONSE OF ICE SHEETS AND GLACIERS TO CLIMATE CHANGE AND THEIR IMPACT ON SEA LEVELCHARACTERIZE THE BEHAVIOR AND RESPONSE OF ICE SHEETS AND GLACIERS TO CLIMATE CHANGE AND THEIR IMPACT ON SEA LEVEL
map ice-sheet and mountain glacier velocity interannuallymap ice-sheet and mountain glacier velocity interannually
map Arctic and Antarctic sea-ice thicknessmap Arctic and Antarctic sea-ice thickness
map mean ice-sheet elevation map mean ice-sheet elevation
LiDARmap change in height (dh/dt) of ice-sheets and mountain-glaciers map change in height (dh/dt) of ice-sheets and mountain-glaciers
map sea-ice velocitymap sea-ice velocity InSAR
LiDAR
LiDAR
InSARmap ice-sheet and mountain glacier velocity annually in three dimensions map ice-sheet and mountain glacier velocity annually in three dimensions
InSAR
11
DESDynI
DESDynI Natural Hazards Science
• Precise measurement of surface deformation derived from DESDynI’s InSAR coupled with models can improve assessment of risk from natural hazards, which ultimately can minimize loss of life and destruction of property. Current hazard maps have an outlook of 30–50 years over hundreds of square kilometers. Forecasting of earthquakes, volcanoes, and landslides is greatly improved by an understanding of surface deformation and the inferred subsurface processes.
Photo Courtesy of USGS (NICHOLAS KAMM/AFP/Getty Images)
NASA JPLNASA JPL12
DESDynI
DESDynI will map Earth surface deformation every week to improve earthquake and volcanic eruption predictions
Earth surface deformation as a precursor to natural disasters.Earth surface deformation as a precursor to natural disasters.
Map vector co-seismic deformation over Earth’s entire land surface for earthquakes of magnitude 7 or larger
Map vector co-seismic deformation over Earth’s entire land surface for earthquakes of magnitude 7 or larger
Map vector deformation of targeted local phenomenaMap vector deformation of targeted local phenomena
•Map secular vector deformation rates of active regions of Earth’s land surface
•Map secular vector deformation rates of active regions of Earth’s land surface InSAR
InSAR
InSAR
InSARMap vector deformation of targeted landslidesMap vector deformation of targeted landslides
13
DESDynI
DESDynI Airborne Simulators
L-Band Polarimetric Radar: Full Waveform LiDAR:
14
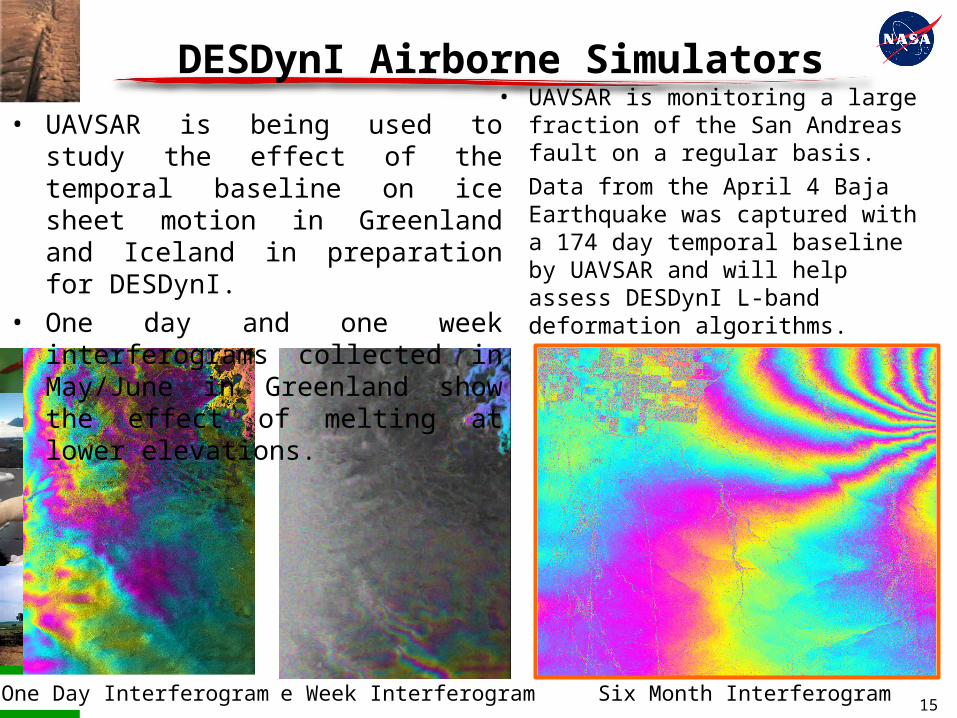
DESDynI One Week Interferogram Six Month InterferogramOne Day Interferogram
• UAVSAR is monitoring a large fraction of the San Andreas fault on a regular basis.
• Data from the April 4 Baja Earthquake was captured with a 174 day temporal baseline by UAVSAR and will help assess DESDynI L-band deformation algorithms.
• UAVSAR is being used to study the effect of the temporal baseline on ice sheet motion in Greenland and Iceland in preparation for DESDynI.
• One day and one week interferograms collected in May/June in Greenland show the effect of melting at lower elevations.
DESDynI Airborne Simulators
15
DESDynI
DESDynI Airborne Simulators (cont)
• LVIS and UAVSAR are being used to improve methods for mapping biomass and other forest structure parameters.
• These images show a portion of the Howland and Penobscot forest areas covered by both sensors in August 2009..
16
DESDynI
Sierra Nevada, CA 2008 NE US in 2009Study Sites and Ground Measurements:
Participants: NASA GSFC/JPL, Univ. of Maryland, Univ. of Michigan, Univ. of Maine, Boston Univ., CUNY, Harvard Univ., UCLA, and others.
Measurements: Tree species, DBH, and height in 1 ha plots (subdivided into 16 @ 25 m subplots).
DESDynI Field Campaigns
17
DESDynI
DESDYnI Science Summary
• Vegetation and Ice status and change• Key components of climate change
• Surface deformation• Earthquake, volcanoes and landslides
• Comprehensive coverage by Lidar and SAR• Vegetated land masses • Ice sheets, glaciers and sea ice• Geologically active areas
• Human populations at risk for earthquakes, landslides and volcanoes
• New Approaches and Technology• First multi-beam lidar in space• First mission designed for fusion of SAR and lidar data • Continuous L band SAR interferometry
18
DESDynI
DESDynI Talks at IGARSS10The Destiny of DESDynI – Science and Applications Fusing L-band SAR and Lidar in the Next
Decade I
• WE1.L09.1 An OVERVIEW OF THE DESDYNI MISSION, K. Jon Ranson, Paul Rosen, Ralph Dubayah, Bradford Hager, Ian Joughin, Scott Luthcke, Bryan Blair, Scott Hensley, Yuhsyen Shen, Gerrry Daelemans
• WE1.L09.2 GLOBAL BIOMASS ESTIMATES FROM DESDynI Ralph Dubayah
• WE1.L09.3: VERTICAL FOREST SRUCTURE ESTIMATION BY MEANS OF MULTI-BASELINE POL-INSAR AT L-BAND FOR GLOBAL BIOMASS MAPPING POTENTIAL & LIDAR SYNERGIES Florian Kugler; Seung-Kuk Lee; German Aerospace Center (DLR) Stefan Sauer; Astor Torano Caicoya; Konstantinos Papathanassiou
• WE1.L09.4: DESDYNI BIODIVERSITY AND HABITAT KEY VARIABLES AND IMPLICATIONS FOR LIDAR-RADAR FUSION Kathleen Bergen, Ralph Dubayah, Scott Goetz
• WE1.L09.5: ESTIMATION OF FOREST BIOMASS CHANGE FROM FUSION OF RADAR AND LIDAR MEASUREMENTS, Sassan Saatchi
The Destiny of DESDynI – Science and Applications Fusing L-band SAR and Lidar in the Next Decade II
• WE2.L09.1: INTEGRATED SAR AND LIDAR OBSERVATIONS OF THE SEA ICE COVER: RESOLVING THE CONTRIBUTIONS OF THERMODYNAMICS AND DYNAMICS TO THE ICE THICKNESS DISTRIBUTION, Ron Kwok
• WE2.L09.2 LARGE SCALE MODELING OF ANTARCTICA AND GREENLAND CONSTRAINED USING LIDAR AND SAR DATA FROM Eric Larour
• WE2.L09.3 DESDYNI LIDAR FOR SOLID EARTH : Jeanne Sauber, Michelle Hofton, Ronald Bruhn, Scott Luthcke, Bryan Blair
• WE2.L09.4: ICESAT LIDAR AND GLOBAL DIGITAL ELEVATION MODELS: APPLICATIONS TO DESDynI, Claudia C. Carabajal, David J. Harding, Vijay P. Suchdeo
• WE2.L09.5: COUPLING POLARIMETRIC L-BAND INSAR AND AIRPORTED LIDAR TO CHARACTERIZE THE GEOMORPHOLOGICAL DEFORMATIONS IN THE FOURNAISE VOLCANO, Essam Heggy, Melanie Sedze, Paul Rosen, Stephane Jacquemoud, Frederic Bretar, Kozin Wada, Thomas Staudhacher, Simone Tanelli
19
DESDynI
DESDynI Talks at IGARSS10
• WE2.L10.2 UAVSAR PATHFINDER FOR DESDYNI POTENTIAL FOR INSAR MONITORING OF GULF COAST SUBSIDENCE THROUGH INTEGRATION WITH GEODESY AND GEOPHYSICAL Ronald Blom, Bruce Chapman, Roy Dokka, Eric Fielding, Scott Hensley, Erik Ivins, Rowena Lohman
• TH1.L05.2 COMPARING SCIENTIFIC AND SCIENCE HAZARD APPLICATION REQUIREMENTS FOR DESDynI Gerald Bawden
• FR1.L09.2: ONBOARD RADAR PROCESSING CONCEPTS FOR THE DESDYNI MISSION Yunling Lou, Steve Chien, Duane Clark, Joshua Doubleday
• FR4.L09.3 QUANTITATIVE ASSESSMENT ON THE REQUIREMENTS OF DESDYNI MISSION FOR CRUSTAL DEFORMATION STUDY Sang-Ho Yun, Frank Webb, Paul Lundgren, Eric Fielding, Shizhuo Liu, Zhen Liu, Scott Hensley, Paul Rosen, Jay Parker
20
DESDynI
Lines mark the extent of ice
Photo Credit: Dr. Dan McCarthy, Brock University http://www.nichols.edu/departments/glacier/glacier_retreat.htm


![na2[W*][E2] d4[W*E2] kl[WE1]](https://static.documents.pub/doc/80x56/61b47e93bd377645311b3513/na2we2-d4we2-klwe1.jpg)


