WEALTH For Private Circulation Only JANUARY - MARCH 2016 Simplifying Investment Choices GUEST CORNER Mr. Sanjay Parekh Equity Fund Manager Interview, Reliance Mutual Fund 8 Mr. Sujoy Kumar Das Debt Fund Manager Interview, Religare Invesco Mutual Fund 10 Mr. Puneet Nanda The Need of the Hour ICICI Prudential Life Insurance 11
Transcript
WEALTHFor Private Circulation Only
JANUARY - MARCH 2016
Simplifying Investment Choices
GUEST CORNER
Mr. SanjayParekhEquity Fund Manager Interview,Reliance Mutual Fund
8Mr. Sujoy KumarDasDebt Fund Manager Interview,Religare Invesco Mutual Fund
10Mr. PuneetNandaThe Need of the HourICICI Prudential Life Insurance
Mr. SanjayParekhEquity Fund Manager Interview,Reliance Mutual Fund
8Mr. Sujoy KumarDasDebt Fund Manager Interview,Religare Invesco Mutual Fund
10Mr. PuneetNandaThe Need of the HourICICI Prudential Life Insurance
11
WEALTH WATCH
CONTENTS
InsideThe Observer
January - March 2016
01Market WrapupGet an quick overview of the Indian Equity & Debt Markets and the Global Equity Markets.
03State of EconomiesGet the Economic brief on India & leading Global Economies.
The Info Corner
04The HeadlinesGet the top headlines that made the news in major global economies & India.
04Policy CornerGet the updates on the policy direction & developmentsin India.
05Industry CornerCatch the top news headlines in the Mutual Fund andInsurance industry.
06The Investors CornerYour corner to get the key investments and economy related facts and figures.
Red Carpet
08Equity Fund Manager InterviewMr. Sanjay Parekh, Senior Fund Manager - Equity, Reliance Mutual Fund
10Debt Fund Manager InterviewMr. Sujoy Kumar Das, Head of Fixed IncomeReligare Invesco Mutual Fund
11Guest ArticleMr. Puneet Nanda, Executive Director,ICICI Prudential Life Insurance
Mutual Fund Updates
23Recommended MF SchemesGet the brief on the top recommended schemes in different categories.
26 Mutual Fund Scheme Close-upClose-up of five select mutual fund schemes.
NJ Updates
31Performance UpdatesUpdates on the MARS & Equity PMS performances.
33 Product FocusA revisit to NJ Equity PMS offerings.
Reading Room
WEALTH
18Test Your WQThe Wealth Quiz for the smart investors.
15Change Your Financial Plans with Change in Life Stage
17 Insurance Myths Decoded
19WillsAn Effective Tool For Estate Planning
Off The Shelf Book Review: The Most Important Thing
12
Beyond Wealth Forget Managing Your Time. Focus On Expanding Your Energy.
14
After good performance in 2014, Indian equity markets ended on a negative note in 2015. The January 2016 month too saw a secular fall in the markets. Globally also, barring few markets, all equity markets ended the year 2015 in negative. The Indian equity markets though saw continued interest from retail investors who have shown remarkable resilience to market volatility. Mutual fund houses continued to be bullish on the equity markets in 2015 and purchased shares worth Rs 70,716 crore, primarily on account of strong participation from retail investors. This is on top of Rs 23,843 crore already being infused in the entire 2014. FPIs were net buyers of equities to the tune of just $3.2 billion in 2015. Before that, they had invested $20 billion each in stock markets in the preceding three years.
The Indian rupee was one of the few emerging market currencies that did not depreciate significantly against its US counterpart last year. That meant that, in dollar terms, it was one of the most stable equity markets amongst the world’s emerging economies. The year 2015 also saw commodities fall and there is a clear evidence this working to India’s advantage. Further, low inflation, improving CAD and fiscal outlook and rising order backlogs in some key infrastructure related industries point to a
steadily improving growth prospects of the economy, especially of the capex cycle. The policy direction is right and economy is making good progress on most fronts. Economy and equity markets appear to be in transition from consumption to capex. Improving margin outlook of corporates, likely lower interest
rates, soft commodity prices and reasonable valuations lead to a positive outlook for equity markets over the medium to long term. We believe that there is merit in increasing allocation to equities from a medium to long term perspective in a phased manner and to stay invested.
IndianEquity Markets
During the month of December 2015, the yield on 10-year benchmark Government bond (7.72% GoI 2025) ended at 7.76%, rising by 22 bps during the quarter and then rose marginally to close at 7.78% in January. Foreign Portfolio Investors (FPIs) infused a net amount of Rs 45,856 crore ($7.4 billion) in the debt markets in 2015
as compared to a record investment of Rs 1.6 lakh crore ($26 billion) in the previous year. Interestingly, most of the inflows witnessed in 2015 into Indian debt market has gone into government securities. The annual rate of inflation, based on monthly WPI, stood at -0.73% for the month of December, 2015. CPI came in at ~5.61%
YoY in December 2015. The INR appreciated to 66.15 against the US dollar as compared to 66.67 at the end of previous month.
After a long wait, the US Federal Reserve raised the federal funds rate by 25 bps, from 0-25 bps range to 25-50 bps range in
MARKET WRAP-UP
WEALTH WATCH | 1
THE OBSERVER
Key Indices 31-Jan-16
24870.69
7563.55
7651.70
3191.12
6339.45
12469.10
10869.84
10417.26
18399.00
Trailing PE
18.08
20.22
19.61
19.91
22.08
25.43
54.98
24.64
20.31
S&P BSE Sensex
NIFTY 50
S&P BSE 100
S&P BSE 200
NIFTY 500
NIFTY MIDCAP 100
S&P BSE Small Cap
S&P BSE Midcap
NIFTY NEXT 50
9.72
9.81
9.81
9.92
9.50
11.31
7.63
13.06
12.22
10 Years
6.66
6.91
7.00
7.42
7.82
9.92
7.53
11.38
11.39
5 Years
7.74
7.83
7.91
9.06
9.77
14.27
13.89
15.23
14.49
3 Years
-14.78
-14.14
-14.06
-12.36
-11.54
-4.99
-4.06
-2.99
-5.87
1 Year
-6.70
-6.23
-6.62
-6.26
-6.10
-5.81
-3.94
-5.08
-6.76
3 Months
-4.77
-4.82
-5.51
-5.52
-5.73
-6.92
-8.17
-6.51
-7.90
1 Month
Returns are calculated on absolute basis for less than one year and on CAGR basis for one year or greater.
% Returns
% Returns
Sectoral Indices
S&P BSE Auto
S&P BSE Bankex
S&P BSE FMCG
S&P BSE Healthcare
S&P BSE Metal
S&P BSE Oil & Gas
S&P BSE Realty
S&P BSE TECk
Nifty India Consumption
Nifty Infra
Nifty Media
Nifty Dividend Oppt 50
31-Jan-16
17046.03
17603.89
7438.52
16304.98
6894.01
9258.06
1208.95
5928.25
3337.95
2424.40
2468.40
1789.80
Trailing PE
18.92
13.93
43.72
36.74
NA
14.02
NA
20.97
28.38
17.06
47.23
15.42
14.23
13.32
13.99
16.65
-0.36
7.54
NA
9.35
12.27
1.04
9.11
NA
10 Years
14.57
8.17
16.30
20.85
-15.50
-0.05
-10.79
9.98
14.68
-4.00
11.51
5.24
5 Years
15.77
6.50
8.36
26.68
-13.40
-0.36
-18.60
16.03
12.93
-1.82
10.72
0.77
3 Years
-14.71
-22.50
-10.11
4.08
-32.35
-8.73
-33.26
-3.39
-5.43
-26.41
4.71
-17.84
1 Year
-6.17
-10.97
-5.21
-9.75
-5.66
2.12
-11.86
-3.05
-4.18
-14.44
2.63
-5.30
3 Months
-7.95
-8.92
-5.50
-3.55
-6.81
-3.11
-10.07
-2.06
-7.44
-12.45
-6.25
-6.52
1 Month
India Equity Markets – Key Indices
India Equity Markets – Sectoral Indices
IndianDebt Markets
WEALTH
The year 2015 was a year of increased uncertainty in the global economy lead by financial market stress in China and monetary policy dilemmas in advanced economies, amidst a fragile global recovery. The weakness in emerging market currencies is hurting global trade and growth as also corporate performance. There was very little for equity investors to get excited about last year as positive returns were hard to come by in most markets. The MSCI All Country World Index, which covers a broad universe of both developed and emerging markets ended the year 4.35% lower. This is a good indication that the environment was generally negative across the globe. The MSCI frontier markets and MSCI emerging markets were sharply lower, while the S&P Developed BMI, which covers all the major developed markets, also ended the year below where it began.
The positives in global equity markets were rather few and far between. Perhaps the most encouraging spots were Europe and Japan, where investors could have seen some gains. The FTSE in the UK has now seen two negative years in a row. It is currently trading at the same levels it was
in late 2012. Last year also saw the end of the major bull market on wall street. After gaining 63% between the start of 2012 and the end of 2014, the S&P 500 was effectively flat in 2015. Emerging markets were generally under pressure and once again exchange rates had a big role to play, exacerbating losses in local currency and turning many gains into negative returns once they were converted into dollars. The Shanghai Composite in China ended the year
9.41% higher, despite the 45% decline it suffered in just two months in the middle of the year. However, those gains were more muted in dollar terms due to the devaluation in the yuan. The biggest losses were felt in frontier markets - the likes of Nigeria, Kuwait, Morocco, Argentina and Pakistan. Generally these markets are feeling the effects of investors shying away from riskier assets and currency weakness in the face of dollar strength.
GlobalEquity Markets
2 | WEALTH WATCH
THE OBSERVER
December. With US rate hike behind us, anticipation of slow rise in US interest rates and high current spreads between India and the US 10 year yields, experts feel that Indian yields should head lower. The moderate pace of economic recovery, low commodity prices, relatively stable exchange rate vs other emerging market currencies & proactive measures by the government with regard to food supply management should help in containing inflation over the medium term. The recent hikes in excise duty on petrol and diesel will provide significant cushion to government to manage fiscal deficit against the additional burden of seventh pay commission and One Rank One Pension (OROP). Low inflation and benign inflation outlook, falling fiscal
deficit and low Current Account Deficit (CAD) are all supportive of lower yields.
Investors in debt markets may continue to add duration to fixed income portfolios.
Key Debt Market Indicators
BenchmarksAs on
31-01-16As on
31-10-15As on
31-12-15Change (Month)
Change(Quarter)
7.17%
7.25%
7.78%
8.05%
9.15%
8.80%
8.65%
7.75%
6.75%
5.75%
355.10
34.08
1111.80
0.50%
1.92%
4.00%
-0.07%
0.04%
0.02%
0.80%
1.55%
0.20%
0.15%
0.00%
0.00%
0.00%
4.74
-2.49
51.80
0.00%
-0.35%
0.00%
-0.01%
0.17%
0.14%
0.78%
1.47%
0.60%
0.40%
0.00%
0.00%
0.00%
1.46
-12.67
-30.55
0.25%
-0.23%
0.00%
7.18%
7.08%
7.64%
7.27%
7.68%
8.20%
8.25%
7.75%
6.75%
5.75%
353.64
46.75
1142.35
0.25%
2.15%
4.00%
7.24%
7.21%
7.76%
7.25%
7.60%
8.60%
8.50%
7.75%
6.75%
5.75%
350.36
36.57
1060.00
0.50%
2.27%
4.00%
364 Day Tbill
91 Day Tbill
10-year Benchmark (7.72% 2025)
3 Months Certificate Of Deposit (CD)
3 Months Commercial Paper (CP)
AAA Corp Yields - 1 Yr
AAA Corp Yields - 3 Yrs
Bank Rate
RBI LAF-Repo rate
RBI LAF-Reverse Repo rate
Foreign Exchange Reserve($ bn)
Brent Crude Oil ($/bbl)
Gold ($/oz)
US Fed Funds Rate
US 10-yr Gilt
CRR
Key Global Equity Market Indices Global Indices 31-Jan-16
741.62
4,613.95
17,518.30
1,912.06
16,466.30
1,667.80
5,056.60
6,083.79
4,615.16
6,687.62
8,080.60
40,405.99
2,737.60
24,870.69
1,300.98
19,683.11
2,629.11
RTS Index (Russia)
Nasdaq (USA)
Nikkei 225 (Japan)
Seoul Composite (S. Korea)
Dow Jones Ind Avg (USA)
KLSE Composite (Malaysia)
All Ordinaries (Australia)
FTSE 100 (UK)
Jakarta Composite (Indonesia)
PSE Composite (Phillippines)
Taiwan Weighted (Taiwan)
Bovespa (Brazil)
Shanghai Composite (China)
S&P BSE Sensex
SET (Thailand)
Hang Seng (Hong Kong)
Straits Times (Singapore)
-5.71
7.30
0.47
3.36
4.26
NA
0.41
0.57
14.02
11.98
1.96
0.80
NA
9.72
5.74
2.29
0.74
10 Years
-17.30
10.91
11.27
-1.60
6.47
1.88
0.83
0.42
6.05
11.80
-2.45
-9.86
-0.44
6.66
6.28
-3.47
-3.77
5 Years
-23.00
13.69
16.32
-0.86
5.92
0.82
1.05
-1.04
1.20
2.33
1.07
-12.25
4.71
7.74
-4.09
-6.05
-7.15
3 Years
0.92
-0.46
-0.88
-1.91
-4.07
-6.37
-8.92
-9.86
-12.75
-13.03
-13.69
-13.86
-14.73
-14.78
-17.72
-19.68
-22.47
1 Year
-1.97
-7.86
-7.96
-2.51
-5.50
-1.46
-5.39
-2.54
0.48
-3.80
-3.09
-6.79
-22.65
-4.77
1.01
-10.18
-8.80
1 Month
-11.98
-8.70
-8.20
-5.79
-6.78
0.13
-4.39
-4.36
3.59
-6.26
-5.54
-11.91
-19.07
-6.70
-6.74
-13.06
-12.31
3 Months
Returns are calculated on absolute basis for less than one year and on CAGR basis for one year or greater. Table is sorted on basis of 1 year returns.
WEALTH
WEALTH
The clear message now is that the global economy will need to adapt to a new period of more modest growth in large emerging markets, characterized by lower commodity prices and diminished flows of trade and capital.
The simultaneous slowing of four of the largest emerging markets-Brazil, Russia, China, and South Africa-poses the risk of spillover effects for the rest of the world economy. Worsening prospects for developing countries have coincided with a sharp slowdown in global trade, a rise in financial market volatility, and a substantial decrease in capital inflows.
Global Growth: Global growth again fell short of expectations in 2015, slowing to 2.4% from 2.6% in 2014. The disappointing performance was mainly due to a continued deceleration of economic activity in emerging and developing economies amid weakening commodity prices, global trade, and capital flows to emerging markets. Going forward, global growth is projected to edge up, but at a slower pace than envisioned earlier, reaching 2.9% in 2016 and 3.1% in 2017-18.
Developing Economies: Growth in 2015 is estimated at a post-crisis low of 4.3%, down from 4.9% in 2014. The economic rebalancing in China is continuing and accompanied by slowing growth. Brazil and Russia have been going through severe adjustments in the face of external and domestic challenges. On average, activity in emerging and developing commodity exporters stagnated in 2015, as they continued to be hard hit by declining commodity prices. As a result, the contribution to global growth from these economies has declined substantially. The slowdown reflects both cyclical and structural components. Commodity exporters have continued to adjust to steep declines in oil and other commodity prices.
United States: For 2015, growth is estimated at 2.5%, the highest annual rate
in the post-crisis period. Robust consumer spending and investment in the non-oil private sector supported above-trend growth in 2015, and should continue to be the main drivers of growth in 2016. The unemployment rate has dropped to lows seen during previous recoveries, but labor participation and growth in productivity have been declining, constraining potential output. A strengthening U.S. dollar and weakening external demand are weighing on exports and manufacturing activity. This points to a very gradual tightening cycle by the U.S. Federal Reserve.
Euro Area: Growth picked up in 2015, as domestic demand strengthened and exports accelerated, partly due to the lagged effect of a Euro depreciation. For 2015, Euro Area growth is estimated at 1.5%, with activity firming in Spain, somewhat disappointing in Germany, and still lagging, but gradually recovering, in France and Italy. Low oil prices and favorable financing conditions are supporting consumer spending and investment. Pickups in credit and intra-European trade growth point to a broadening recovery. Deflation concerns have receded, but core inflation and wage growth remain subdued among economies with high long-term unemployment rates.
Japan: Growth remains fragile, with private consumption and investment failing to pick up in 2015. Growth is expected to recover moderately to 1.3% in 2016, from 0.8% in 2015. Past offshore investments have helped raise sales and profit by overseas subsidiaries, but restrained exports. Skill shortages continued to increase, raising prospects of a gradual acceleration in wage growth. Rising female participation has boosted employment rates and is helping to offset demographic pressures. Long-term inflation expectations remain below the 2 percent inflation target, despite further policy easing by the Bank of Japan.
GlobalEconomy
STATE OF ECONOMIES
Despite improved macro-economic fundamentals, sluggishness in domestic demand and private investment call for higher public investment at a time when government is committed to fiscal consolidation. The weaknesses in external demand has adversely affected exports even though current account deficit has remained at comfortable levels. In the corporate sector, declining profitability, high leverage and low debt servicing capacity continue to cause concern with their attendant adverse impact on the financial sector, notwithstanding a marginal improvement observed during the first half of current financial year.
The policy makers and stakeholders will need to remain watchful about the potential adverse impact of possible developments in global scenario including sharp increase in international oil and commodity prices, increased volatility in financial markets and further slow-down in global trade. On the domestic front, risks arising from erratic climatic conditions, limited policy space, corporate performance, asset quality of financial institutions and low investment growth, among other factors, could pose challenges.
Growth: The Indian economy expanded 7.4% y-o-y in the three months to September of 2015, following an upwardly revised 7.1% expansion in the second quarter. Figures came better than market expectations of a 7.3% increase, boosted by financial, real estate and insurance activities & manufacturing.
Inflation: The CPI for Dec-15 stood at 5.61%, marginally higher than 5.41% in Nov-15. The vegetable inflation noted seasonal deflationary pressures, falling to -7.20% in the current reading from -1.25% in previous month. Wholesale inflation for Dec-15 stood at -0.73%, marking fourteenth straight month of negative figure.
IndianEconomy
WEALTH WATCH | 3
THE OBSERVER
Interest Rates: The RBI left its benchmark repo rate at 6.75%, as expected. RBI said that it will monitor commodity prices, especially food and oil, while tracking inflationary expectations and external developments.
Bank Credit: Outstanding credit disbursed by Scheduled Commercial Banks (SCBs) grew by Rs.638.3 billion to Rs.70.8 trillion during the fortnight ended 8 January 2016. Food credit fell by Rs.109 billion to Rs.1 trillion, while non-food credit grew by Rs.747.3 billion to Rs.69.8 trillion. On a y-o-y basis, the outstanding bank credit grew by 11.3%, non-food credit rose by 11.6% but food credit fell by 8.4%.
Infrastructure: During 2016-18, a road network of over 13,000 kms entailing an investment of Rs.1.6 trillion is likely to be built as per CMIE’s CapEx database. Of this, projects spanning 8,455.7 kms and worth Rs.1 trillion are scheduled for completion in the next fiscal year. Most of these projects relate to highway expansion through four-laning or six laning and construction of expressways, flyovers & ring roads.
Manufacturing: Indian manufacturing activity unexpectedly returned to growth in January as firms raised output on stronger demand. The Nikkei Manufacturing Purchasing Managers' Index (PMI), jumped to a four-month high of 51.1 in January after slumping to a 28-month low of 49.1 in December. The 50-mark demarcates contraction from expansion.
China has allowed Reserve Bank of India (RBI) to trade spot products, forwards, swaps, currency swaps and options in China's domestic foreign exchange market.
4 | WEALTH WATCH
THE INFO CORNER WEALTH
THE HEADLINES
POLICY CORNER
IndianEconomy
Commodities: The World Bank has cut its price forecast for 80% of the world's major commodities as oversupply and weaker emerging market growth prospects weigh on demand. The 2016 forecast for crude oil prices was cut to $37 per barrel, down from $51 per barrel in its October report.
US Inflation: Consumer prices in the United States increased 0.7% year-on-year in December of 2015, higher than 0.5% in the previous month. Yet, it is the highest rate in a year.
US Fed Funds Rate: The Federal Reserve left the target range for its federal funds rate unchanged at 0.25% to 0.5 % during its FOMC meeting held in January 2016, following last month’s hike. Policymakers didn’t rule out a March rate increase but said they are monitoring the impacts of global economic and financial developments on US outlook.
Japan Interest Rate: The Bank of Japan
kept its pledge to increase the monetary base at an annual pace of about 80 trillion yen at its January 2016 meeting, but said it had adopted a benchmark rate of (-) 0.1%. The surprise decision to introduce a negative interest rate was made aiming to achieve price stability target of 2%.
Euro Area Inflation Rate: Consumer prices in the Euro Area are expected to increase 0.4% year-on-year in January of 2016, higher than 0.2% in the previous two months and in line with expectations. Preliminary figures show it as the biggest rate since October of 2014.
China Manufacturing: Activity in China's manufacturing sector contracted more than expected in January, missing market expectations and weaker than the previous month. The official Purchasing Managers' Index (PMI) stood at 49.4 in January, compared to the previous month's reading of 49.7 and below the 50-point mark that separates growth from contraction on a monthly basis.
Start-Up India: The Start-Up India mission which was initiated on January 16, 2015 envisages technology business incubators and research parks including a 100 billion rupee ($1.48 billion) fund & a string of tax and compliance breaks. The Human Resource Development Ministry & the Department of Science & Technology have agreed to partner in an initiative to set up over 75 such startup support hubs in technology institutes.
Digital India: The Digital India mission got a boost with the launch of 23 new e-products and e-services. This includes
electronic payments for government services, a GIS based decision-support system, a request for proposal for selecting private cloud service providers for government departments, the setting up of an online laboratory for students to perform virtual experiments for all CBSE schools. The government is also working on the concept of digital villages - rural areas that will have telemedicine facilities, virtual classes and solar power-based wi-fi hot spots. Ravi Shankar Prasad, Indian minister of communications & information technology, declared: “By
GlobalEconomy
IndiaPolicy Updates
WEALTH
INDUSTRY CORNER
An easier interest rate scenario led to substantial gains in income funds last year, with the AUM swelling by over 42% to about Rs 60,000 crore in December 2015, from Rs 42,300 crore a year ago, a report by Crisil said. The easing monetary situation provided a fillip to income funds, especially early movers, which invested in longer tenure debt instruments," the report said.
Equity mutual fund (MF) schemes have seen an addition of about 43.44 lakh new SIPs during 2015, a nearly 66% increase on a year-on-year (y-o-y) basis. Equity MFs received maximum inflows via SIPs during the second half of the year when the markets slipped into the red. Total inflows into SIPs came at about $2 billion (Rs 13,503 crore) between July and December 2015.
Asset base of equity mutual funds has surged 29 per cent to Rs 3.64 lakh crore at the end of December from a year ago on the back of retail investors pouring money into these schemes. The industry's equity assets under management (AUM) rose to Rs 3.64 lakh crore last month, from Rs 2.83 lakh crore in December 2014, according to Association of Mutual Funds in India (AMFI). In November, the asset base of equity MFs read Rs 3.62 lakh crore. Despite a 6% slump in the BSE benchmark Sensex in 2015, investors pumped in money into equity schemes.
Investors have pumped in a whopping Rs 1.62 lakh crore into various mutual fund schemes in the first 9 months of the current fiscal, mainly in equity and money market categories. In contrast,
inflows worth Rs 87,942 crore were witnessed in the April-December period of last fiscal. Equity and equity linked schemes witnessed an inflow of Rs 69,958, while 'liquid' or money saw an investment of Rs 53,220 crore. Further, balanced funds and income funds registered an inflow of Rs 17,844 crore and Rs 14,697 crore respectively. However, Gold ETFs saw an outflow of Rs 575 crore.
Market regulator Sebi has decided to reduce the additional exposure limit provided to housing finance companies in the finance sector to 5% from 10% of net asset value in order to mitigate the risks of mutual funds betting in this sector.
March, we will reach 50,000 gram panchayats and 100,000 gram panchayats by the end of next year.”
NIIF: Indian FM Arun Jaitley will formally
launch the Rs 40,000 crore ($6 billion) National Investment & infrastructure Fund (NIIF), which will be structured like a sovereign wealth fund, on February 4.
The government will contribute half the corpus, from the Budget but will hold a 49% stake to give it a private sector character.
Indian MutualFunds Industry
WEALTH WATCH | 5
THE INFO CORNER
State-owned general insurers have outpaced their peers in private sector in premium collection, though marginally, by recording 12% growth in the first nine months of the current fiscal. The state- owned non-life insurers mobilised a total premium of Rs 35,000 crore in nine months to December against Rs 31,300 crore during the first nine months of previous fiscal. In contrast, 24 private sector general insurers, recorded a growth of 11.70% in premium collection at Rs 28,650 crore in the reporting period against Rs 25,631 crore in the year-ago period.
The Telangana government recently
started the recognition of ‘e-Motor Insurance policies’ in the state, in collaboration with the IRDA and the Insurance Information Bureau of India (IIB). “Telangana is the first state in the country to formally recognize electronic motor insurance policies. This measure is likely to add to the citizens’ convenience and also improve the compliance levels of motor insurance,” the government statement said.
As per the regulations, there is a provision for flexible premium payout option and non selling of MI products under unit linked platform among others. On March 23 2015, the government
notified the hike in foreign direct investment (FDI) cap to 49% from 26%. According to IRDA, the total FDI in insurance sector as on March 31, 2015, was about Rs 8,031 crore.
Non-life insurers have so far received 10,000 claims valued at Rs 2,500 crore arising out of the Tamil Nadu floods. General Insurance Council, which represents all the non-life, health & re-insurers, said insurance companies are taking all steps to expedite settlement with minimum documents for the purpose.
IndianInsurance Industry
WEALTH6 | WEALTH WATCH
THE INFO CORNER
THE INVESTORS CORNER
LumpsumInvestment
Scheme Category
Equity - General Purpose Funds
Equity - ELSS (Tax Savings)
Equity - MultiCap Funds
Equity - Large Cap Funds
Equity - Mid /Small Cap Funds
Equity - Sectoral Funds
Equity - Arbitrage Funds
Balance - All Funds
Debt - MIPs
Debt - Liquid & Floating Rate Funds
Debt - Money Manager Funds
Debt - Short Term Plans
Debt - Income Funds
Debt - Gilt Funds
1 Year
-7.99
-8.78
-8.31
-10.84
-2.83
-8.13
7.16
-5.77
2.31
8.09
8.04
7.57
4.90
4.29
3 Years
15.83
15.09
14.37
12.10
23.74
14.93
8.08
13.51
8.81
8.69
8.70
8.61
7.78
8.21
5 Years
12.36
11.84
11.05
9.82
17.98
14.15
8.24
11.14
8.82
8.76
8.54
9.02
8.51
8.54
7 Years
20.68
19.49
19.92
17.50
26.92
25.05
7.38
17.32
9.32
7.62
7.46
8.04
7.09
6.74
10 Years
12.21
10.98
11.77
11.49
14.27
14.95
7.91
11.58
8.29
7.64
7.72
7.99
7.35
7.54
12 Years
17.02
16.83
16.58
16.16
22.53
19.15
N.A.
14.85
8.50
7.28
6.67
7.62
6.59
6.78
15 Years
17.73
18.33
18.39
16.43
21.95
15.31
N.A.
13.77
9.78
N.A.
6.98
8.21
7.61
8.61
Average % Annualised Returns of all Schemes as per category as on 31st January, 2016.
SIPInvestment
Scheme Category
Equity - General Purpose Funds
Equity - ELSS (Tax Savings)
Balance - All Funds
1 Year
-10.84
-12.02
-7.41
3 Years
15.82
13.96
12.44
5 Years
15.82
14.78
13.27
7 Years
14.80
13.66
12.58
10 Years
12.97
11.88
11.62
12 Years
13.91
13.41
12.57
15 Years
19.12
19.16
15.35
Average % Annualised Returns of all Schemes as per category as on 31st January, 2016.
ELSS Tax Savings Matrix
Applicable Tax Slab Tax Savings (Rs.) (Total investments made in ELSS by lumpsum or SIP)
10.00%
20.00%
30.00%
25,000
2,575
5,150
7,725
50,000
5,150
10,300
15,450
75,000
7,725
15,450
23,175
1,00,000
10,300
20,600
30,900
1,25,000
12,875
25,750
38,625
1,50,000
15,450
30,900
46,350
Estimated Tax Savings with investment in the popular Equity Linked Savings Schemes (ELSS) offered by mutual funds. The matrix is for tax saving for investments made in Financial Year 2015-16 for investors falling under different tax slabs.
Note that the above table is for indicative purposes only. Tax slab assumption is for Resident Individuals (under 60 years of age) with total income not exceeding Rs. 1 Crore. Tax includes education cess of 3%.
WEALTH WEALTH WATCH | 7
THE INFO CORNER
Multiply the respective EMI with [Loan Amount / Rs.1 Lakh]. For eg. For Rs.12.5 lakh of loan, multiply the EMI by 12.50
EMI Indexfor Loan of Rs.1 Lakh
Loan Tenure
8%
9%
10%
12%
14%
3 Years
3,134
3,180
3,227
3,321
3,418
5 Years
2,028
2,076
2,125
2,224
2,327
7 Years
1,559
1,609
1,660
1,765
1,874
10 Years
1,213
1,267
1,322
1,435
1,553
15 Years
956
1,014
1,075
1,200
1,332
20 Years
836
900
965
1,101
1,244
25 Years
772
839
909
1,053
1,204
30 Years
734
805
878
1,029
1,185
Know your loan affordability with this matrix
India Forex RatesLoan Tenure
1 US$
1 Euro
100 Yen
1 Pound
31-Jan-16
67.78
74.07
56.26
97.76
31-Dec-15
66.15
72.50
55.09
98.35
31-Oct-15
65.27
71.67
53.92
99.93
31-Jan-15
61.87
70.03
52.40
93.13
% Change (Month)
-2.40%
-2.12%
-2.08%
0.60%
% Change (Quarter)
-3.70%
-3.24%
-4.16%
2.22%
% Change (Year)
-8.72%
-5.45%
-6.86%
-4.74%
Mutual FundIndustry Snapshot
Note: No. of schemes also includes serial plans. Source: SEBI.
Loan TenureNo. of
SchemesNo. ofFolios
Net Flows(Rs. Crores)
Average AUM(Rs. Crores)
Net Assets31-01-16
A. Income/Debt OrientedSchemes (i+ii+iii+iv)
i. Liquid/Money Market
ii. Gilt
iii. Debt (other than assured return)
iv. Debt (assured return)
v. Infrastructure Development
B. Growth/Equity OrientedSchemes (i+ii)
i. ELSS
ii. Others
C. Balanced Schemes
D. Exchange TradedFund (i+ii)
i. Gold ETF
ii. Other ETFs
E. Fund of FundsInvesting Overseas
Total (A+B+C+D+E)
1,630
54
41
1,528
0
7
475
58
417
27
57
13
44
31
2,220
80,59,637
3,56,509
66,965
76,36,115
0
48
3,51,38,492
69,54,178
2,81,84,314
23,90,142
7,08,514
4,44,183
2,64,331
1,29,840
4,64,26,625
Funds mobilized(Rs. Crores)
1,09,92,448
1,05,46,606
10,638
4,34,974
0
230
1,41,033
6,613
1,34,421
23,266
14,963
24
14,940
235
1,11,71,945
Repurchase/Redemption(Rs. Crores)
1,09,04,427
1,04,90,931
8,234
4,05,262
0
0
68,162
2,924
65,238
4,541
9,951
680
9,271
598
1,09,87,680
88,021
55,675
2,404
29,712
0
230
72,872
3,689
69,183
18,724
5,012
-657
5,668
-363
1,84,266
9,05,481
3,19,923
17,689
5,66,362
0
1,508
3,87,760
39,389
3,48,372
41,063
17,861
5,971
11,890
1,899
13,54,065
8,27,625
2,36,702
17,478
5,71,933
0
1,512
3,84,350
39,169
3,45,181
41,121
18,741
6,096
12,645
1,877
12,73,714
WEALTH
Q1) 2015 year remained subdued for
equity market. What is your
assessment for 2016?
We remain positive on the outlook for
equities. We feel returns in 2016 could
be back ended due to global
deflationary risk, slow down in China.
However domestic macro is improving
and we believe the recovery will be
gradual but sustainable. The foundation
of fiscal deficit in control, lower CAD,
strong reserves and soft bias on
inflation and interest rates are positives.
This coupled with efforts from
Government to revive the economy will
help in the medium term.
Valuation are also reasonable at 15x on
FY17 and 12.8x on fy18 on conservative
growth rates (Sensex / NIFTY). Also
Indians are significantly underinvested
in equities and hence we believe that
shift towards equities will continue.
Going forward we would like to
highlight a few positives which can
play out:
Two key legislative bills (which could
clear in coming sessions): Good and
Services Tax (GST) and Bankruptcy
Code. It is "when" rather than "whether"
Dedicated Freight corridor (DFC) and
Delhi Mumbai Industrial Corridor
(DMIC)
Skill India / Digital India / Start-up India:
All these measures will push forward
the Make in India
Reduction in corporate tax rate from
30% to 25%
Reduced interest rates
Ease of doing business – Cutting down
on red tape
Curtailing the parallel money (Black
Money): boosting the organized sector
Full benefits of lower crude, leading to
long-term competitiveness for Indian
manufacturing sector, besides a strong
country Balance Sheet with lower twin
deficits
Normal monsoon, leading to rural
economy adding to GDP growth
Visible impact of huge government
spending in areas of railway, defence,
roads, power, etc.
Cleansing of bank books, removing the
overhang and uncertainty and allowing
banks to focus again on core credit
growth.
Expectations have toned down
meaningfully and any uptick might lead
to big surprises and reaction.
A possible development and growth
focused Union budget on February 29th
Q2) There are some macros which are
still not showing signs of
improvement, viz. IIP, PMI, etc. What is
your outlook of Indian economy in
next few years?
The 2nd quarter FY16 (Jul-Sep) Real
GDP at market price (new standard to
measure real GDP growth) grew at
robust 7.4% y/y as against 7% y/y in 1Q
FY16 (Apr-Jun) indicating pick-up in
real economic activity. While 2Q FY15
IIP numbers shows much lower growth
(around 4.6% y/y), the new GDP data
has better coverage in terms of
numbers of industries.
On the manufacturing space the short
cycle capex segments driven by
EquityFund Manager
8 | WEALTH WATCH
RED CARPET
INTERVIEW
Mr. Sanjay ParekhSenior Fund Manager – EquityReliance Mutual Fund
Mr. Sanjay Parekh has over 18 years
experience in equity research and
fund management, 9 years in fund
management & 8 years as an analyst
across various sectors.
Prior to joining Reliance Capital Asset
Management Ltd., he worked as
Senior Fund Manager with ICICI
Prudential Asset Management
Company Ltd. He has also been
associated with organisations like ASK
Investments Managers.
WEALTH
Government capex witnessed an
improvement in few areas like roads
and power transmission sector. Newer
areas like Defence have also started to
contribute to order book
improvements. In some construction
sectors, order book improvement has
been meaningful and the impact of the
same will be visible in the next 12
months in terms of execution.
Thus we believe the manufacturing
activity can positively surprise over the
next few years as the benefits to policy
initiatives become more visible and
positive tailwinds of lower inflation &
lower interest rates drives demand in
the economy.
Q3) US Federal Reserve rate
increased recently. There are further
hikes imminent in 2016. How do you
think it will impact global and Indian
markets?
In global deflationary environment, we
believe US will delay the second hike
before its very sure of recovery in US
economy. We do not expect major hikes
during 2016. Further any delay in Fed
tightening would be taken as positive
surprise. Also, other Central banks like
ECB, PBoC, BoJ could soften their policy
stance as deflation fears have mounted.
Q4) What are your views on
commodity related sectors as these
sectors have not performed since
long?
We believe the slowdown in
Chinese economy and Global
deflationary risk remains and one
should avoid commodity related
sectors (remain underweight). One can
invest into companies which would
benefit due to low commodity prices.
Q5) It is likely that earnings growth
for FY16 will be in single digit. What
do you think earning growth for
FY17?
Earnings growth for FY16
will be weak but the
downgrades have been
largely contributed by
Metals, Oil & Gas and
PSU banks. With many
macro enablers in
place, Indian corporate sector should
see a meaningful improvement in
earnings from the cyclical lows over a 1
to 3-year period. On a low based on
FY16, we believe earnings growth of
15-16% plus for FY17 is quite possible.
Disclaimers:
The information herein below is meant only for
general reading purposes and the views being
expressed only constitute opinions and therefore
cannot be considered as guidelines,
recommendations or as a professional guide for
the readers. Certain factual and statistical
information (historical as well as projected)
pertaining to Industry and markets have been
obtained from independent third-party sources,
which are deemed to be reliable. It may be noted
that since RCAM has not independently verified
the accuracy or authenticity of such information or
data, or for that matter the reasonableness of the
assumptions upon which such data and information
has been processed or arrived at; RCAM does not
in any manner assures the accuracy or authenticity
of such data and information. Some of the
statements & assertions contained in these
materials may reflect RCAM’s views or opinions,
which in turn may have been formed on the basis
of such data or information.
The Sponsor, the Investment Manager, the Trustee
or any of their respective directors, employees,
affiliates or representatives do not assume any
responsibility for, or warrant the accuracy,
completeness, adequacy and reliability of such
data or information. Whilst no action has been
solicited based upon the information provided
herein, due care has been taken to ensure that the
facts are accurate and opinions given are fair and
reasonable, to the extent possible.
This information is not intended to be an offer or
solicitation for the purchase or sale of any financial
product or instrument. Recipients of this
information should rely on information/data arising
out of their own investigations. Before making any
investments, the readers are advised to seek
independent professional advice, verify the
contents in order to arrive at an informed
investment decision.
None of the Sponsor, the Investment Manager, the
Trustee, their respective directors, employees,
affiliates or representatives shall be liable in any
way for any direct, indirect, special, incidental,
consequential, punitive or exemplary damages,
including on account of lost profits arising from the
information contained in this material.
The Sponsor, the Investment Manager, the Trustee,
any of their respective directors, employees
including the fund managers, affiliates,
representatives including persons involved in the
preparation or issuance of this material may from
time to time, have long or short positions in, and
buy or sell the securities thereof, of company(ies) /
specific economic sectors mentioned herein,
subject to compliance with the applicable laws and
policies.
Mutual Fund investments are subject to market
risks, read all scheme related documents carefully.
WEALTH WATCH | 9
RED CARPET
WEALTH
Q1) What is your assessment on recently concluded bi-monthly monetary policy review?
Our assessment of monetary policy
suggests that RBI remains
accommodative in its monetary policy
stance, even as it has maintained status
quo on interest rates in last two policy
reviews. Given the RBI’s intent of
sustaining disinflation in the economy,
any data points which can affect the
trajectory of inflation including any
deviation from stated fiscal path of the
government assumes signicfance and
will shape the future policy moves.
Presently, the inflation has evolved
closely along the trajectory set by the
RBI and provides comfort. The RBI is of
view that Jan’16 target of 6% CPI
inflation should be achievable (last
count of CPI recorded at 5.6% for
Dec’15). It has projected inflation to be
around 5% by the end of FY17 based on
the assumption of a normal monsoon
and current level of international crude
oil prices & exchange rates.
All in all, the policy statement has
sounded optimistic and more room
could open up for easing monetary
policy to support growth, if aforesaid
indicators remain supportive.
Q2) 10 year G Sec yield remained elevated. Where do you think it can settle by end of 2016?
True, the G-sec yield remains elevated
and has hovered in the range of
7.60%-7.80% in last 3 months, after
seeing initial declines post the repo rate
cut of 50 bps in Sep’15 policy review.
Now, with the end of government
borrowing programme, absence of
supply is expected to help the
sovereign prices to appreciate and
outperform till new borrowing calendar
is announced for the next financial year.
The de-regulation of small savings
interest rates, Open Market Operations
(OMOs) from RBI, Marginal Cost of
Funds based Lending Rate and eventual
pick up in credit growth is expected to
work in building up of the money
supply. These steps should work
towards price appreciation in Gilts. We
expect the 10 year g-sec yield to move
in the 25-50 bps band over repo rate
over 2016.
Q3) What are your expectations from the Budget 2016-17?
We expect the FM to continue the path
of fiscal consolidation and target a fiscal
deficit close to 3.5% for FY17.
Q 4) In next 1 year, which category of debt funds should relatively perform well?
Short maturity bond funds are
expected to outperform in the
beginning as liquidity enhancing
measures like term repo auctions and
continuous Open Market Operations
(OMOs) will lead to liquidity built-up at
the shorter end of the curve, and will
benefit yields at the shorter end of the
curve.
Later, long duration bonds fund should
outperform as the market is expected
to move as per RBI rate decision which
is largely expected to be dovish and
continuation of the rate reduction cycle.
In such a scenario, we recommend
investors to get invested in income and
gilt funds with fund duration longer than
their individual investment horizon as
the market braces for capital
appreciation over the next few years.
DebtFund Manager
Mr. Sujoy Kumar DasHead of Fixed IncomeReligare Invesco Mutual Fund
Sujoy has over 18 years’ experience in the Fixed Income market. In his last assignment, Sujoy was Head - Fixed Income with Bharti AXA Mutual Fund. Prior to Bharti AXA, he was with DSP Merrill Lynch Mutual Fund as Fund Manager, managing several fixed income funds. Sujoy has also worked with Bank of Punjab as a trader & traded in govt. securities, corporate bonds etc. and was a senior member of their treasury function. In May 2005 & April 2012, he was featured amongst the top debt fund managers in the country, in the "Top Fund Managers of India" survey conducted by Business Today & Mutualfundsindia.com. Sujoy graduated as a Bachelor in Science (Economics) from University of Calcutta.
10 | WEALTH WATCH
RED CARPET
WEALTH
With growing aspirations of the country’s young working population, most individuals today avail of various types of loans - home loans, vehicle loans, personal loans etc. which are liabilities and have to be repaid. In case of the untimely demise of the individual i.e. the earning member, the family would not only lose their source of income but also be burdened with the responsibility of repaying the loans.
An extremely competitive and fast paced lifestyle has made individuals susceptible to several lifestyle-related ailments. While, healthcare facilities today are advanced and have resulted in higher life expectancy, it does not come cheap. Critical illnesses can adversely impact financial plans forcing individuals to abandon their financial goals. The joint family system is on the decline, which means the loss of a support system. It is therefore crucial that individuals have a support system in place to protect themselves and their families.
The question which bogs every individuals mind is how much life insurance should I buy?
Broadly speaking young individual’s upto the age of 40 years should typically purchase term cover of 20-30 times their annual income. A person in the 40s should have a cover of 10-20 times the annual income and a person in the 50s, a cover of 5-10 times the annual income is recommended.
The Indian life insurance has its ear to the ground and innovates to provide products which are best suited to meet the requirements of customers. A critical illness can have a serious impact of the finances of the family due to healthcare costs. Today products which combine the benefits of life and health insurance
are available at affordable prices. It is significantly easy for the customer to manage a single product rather than three different products. Life insurance companies offer innovative products which cover death, critical illness, accidental death as well as disability. Not only this, customers have the flexibility to choose the premium payments-single, limited or regular. While the loss of the earning member is irreplaceable, life insurance companies offer the claimants the option to receive the claim proceeds either as a lumpsum or as monthly income over a period of time. This can provide the family with the required time to plan their future steps, to ensure financial stability.
Technology has made some sweeping changes in the life insurance industry - enabled customers to quantify their financial goals, empowered them to make informed buying decisions, virtually done away with paper-work, offers a seamless on-boarding experience and most importantly the entire buying process can be concluded in a matter of minutes.
Internationally, where the concept of life insurance is more prevalent as a tool for protection the sum assured to GDP ratio is far higher vis-à-vis the Indian markets, for example, USA: 270 per cent; Japan: 260 per cent; Singapore: 226 per cent; South Korea: 166 per cent; Malaysia: 149 per cent; & Germany: 106 per cent. The fact that life insurance is slowly gaining acceptance is evident from rise the country’s Sum Assured to GDP ratio from 55.8% in FY11 to 62.8 % in FY15. The consumer attitude towards life insurance is definitely shifting and life insurance companies on their part promise to provide financial security to the families of their customers in their absence.
The Need of the HourEnhanced Financial Protection
Mr. Puneet NandaExecutive Director,ICICI Prudential Life Insurance
WEALTH WATCH | 11
RED CARPET
All individuals have the basic instinct
to protect and safeguard themselves
and their families. It stems from the
fact that individuals strive to build a
safety net around the things that are
dear to them. Life insurance should be
viewed as tool which provides a safety
net in terms of financial protection to
the family. It can ensure the continuity
of the financial plan and security of the
family.
A term insurance plan is the simplest
and most cost effective route to
provide protection to loved ones. It
can actually act as an income
replacement for the family till such
time as they plan out their future
course of action.
WEALTH12 | WEALTH WATCH
READING ROOM
The Most Important Thing: Uncommon Sense for the Thoughtful InvestorBy Howard Marks
OFF THE SELF
Intro:
Howard Marks's The Most Important Thing, is a like condensed dose of investment
insights and philosophy of an industry veteran. Howard Marks, the chairman and
cofounder of Oaktree Capital Management, is renowned for his insightful assessments of
market opportunity and risk.
With over four decades experience in investment management, Marks is a sought out
figure by the world's leading value investors. His letters to investors are celebrated for
being filled with insightful commentary and a time-tested, fundamental philosophy. The
book is a compilation of the knowledge & wisdom from these investor letters. With a
lifetime of experience & study, the book explains the keys to successful investment and
the pitfalls that can destroy capital or ruin a career. This is not a how-to-do book but an
investment thought process book with broad takeaways for both amateur & seasoned
investors.
Top quotes:
“Experience is what you got when you didn’t get what you wanted.”
“There are old investors, and there are bold investors, but there are no old bold investors.”
“Here’s the key to understanding risk: it’s largely a matter of opinion.”
“The correctness of a decision can’t be judged from the outcome. Nevertheless, that's how people assess it. A good decision is one that’s optimal at the time it’s made, when the future is by definition unknown.”
“Risk is incredibly important to investors.
It’s also ephemeral and unmeasurable. All
of this makes it very hard to recognize,
especially when emotions are running
high. But recognize it we must.”
Key Takeaways:
Second Level Thinking:
The book starts by making a distinction
between first-level thinking and
second-level thinking. First-level thinking
is simplistic and superficial, and just about
everyone can do it. Second-level thinking, as opposed, is deep, complex and convoluted. The second-level thinker tends to take and consider many things before arriving at any decision. Obviously, Marks thinks that most average investors are only first-level thinkers while very successful investors are second-level thinkers. The difference lies in the depth of thinking. For example, first-level thinkers may argue that with an outlook of low growth and rising inflation you should dump stocks; second-level thinkers would argue that if the outlook is bad and everybody is selling you may want to buy stocks. Marks argues that only second-level thinkers can hope to obtain above-average returns.
It's Not Easy: Markets are Efficient
Everyone wants to make money and they are many intelligent and motivated people out there looking for opportunities to do so. In such a world, it is hard to imagine free lunches. People who think it can be easy overlook substantial nuance and complexity are mistaken. So investors must give a great deal of thought before
making investment decisions. However, efficiency of markets is not so universal that superior performance cannot be achieved. But hopes & promises of 'excess' returns should be thoroughly examined. Every investment thesis should be questioned - “who doesn’t know that?” to make money.
Price is extremely important, always.
Every investment decision involves the critical element of price. Marks argues that most investors think quality, as opposed to price, is the determinant of whether something is risky. But high quality assets can be risky, and low quality assets can be safe. It’s just a matter of the price paid for them. He also argues that when greed goes to excess, security prices tend to be too high. That makes prospective return low and risk high.
Marks clearly reveals himself as a value investor. He argues that “of all the possible routes to investment profit, buying cheap is clearly the most reliable.” He also argues that “trying to buy below value isn’t infallible, but it’s the best chance we have” to earn above-average
WEALTH WEALTH WATCH | 13
READING ROOM
returns. But when prices are high, it’s inescapable that prospective returns are low (and risks are high). During times of bubbles in markets, the term attractive is interpreted as attractive at any price by investors. People stop questioning the price driven by emotions and following the herd behaviour. What is needed that investors stick to evaluating price independent of any market excesses and cycles based on fundamentals.
It's not easy to make money as a contrarian.
Being conventional and doing what everyone else does will not make you money as it is what everyone does. To be successful as an investor, one needs to be unconventional. But being so should not be your goal but a way of thinking. One needs to think and view things differently and then arrive at decisions with fresh perspective that may or may not match market expectations. But doing so is not easy as many times there may not be any market excesses present to adopt such an approach. At other times, the market excesses may continue for such long periods of time that your patience /confidence may fade off. It will be hard to hold on to a contrarian view point for a long time.
Keep risk at heart of every decision
Particularly illuminating is the discussion of the critical issue of risk, to which Marks allocates three chapters: one on “understanding” risk, another on “recognizing” risk, and another on “controlling” risk. Generally, people do not think enough about risk, only when it exists visibly in form of a loss. As per Marks, volatility of returns doesn’t imply anything about risk. Instead, the possibility of permanent loss is the risk that everyone should worry about. Risk pertains to the final outcome which is less certain. Marks says that investors should always look for a hidden risk, especially when the return seems far too generous when compared to apparent risk.
Another point made is that risk is always a probabilistic value which cannot be determined and evaluated in absolute
terms. For eg. You may invest in a risky asset and end up making a profit. It doesn't mean that your investment did not have risk: perhaps it had gone through a lot of risk which you did not notice. As an investor we must realise that. One should take risk when others are fleeing from it, not when they are competing with you to do so. Interestingly, although the prevailing popular expert view is that value investing (buying cheap and underrated stocks) is riskier than growth investing (buying expensive and glamor stocks), Marks begs to disagree; he argues that the opposite is pretty much the case.
Understand business cycles:
Marks strongly believes in the recurrence of cycles. One side of the pendulum occurs when people seems think that there are minimal risks, either because of recent history or some new invention that eliminates risk. Often, the only worry remaining is that we’ll miss out on the opportunity for great returns. The other side of the pendulum is when uncertainty is everywhere. Here, people will think of staying out of the market until the everything gets settled.
As an investor, it is imperative that we understand where we stand in the business cycle. The power of business cycles and its' effect on economy, businesses & markets cannot be underestimated. We may not be experts in predicting the timing and scale of trends or business cycles. But as smart investors, we should have a fair understanding of the business cycle which exists today and act accordingly. If you’re going to pick a time to invest, it’s better when people are scared, because at least they are properly considering all the potential risks. It should be scary and uncomfortable so that you may find the value. He reminds you, as Charlie Munger says, “It’s not supposed to be easy.” If you wait until the dust has settled, there won’t be great prices anymore.
Have reasonable expectations
Extraordinary skill is rare. When someone else promises returns “too good to be
true”, the next question to ask is “why me?” If they found a can’t miss investment opportunity, why are they sharing this with you? If some talking head on TV makes a bold prediction, why aren’t they busy betting their net worth on the outcome?
This is good reminder about having a clear goal as to what you want to achieve with your portfolio, but also to keep that goal within reason. The key questions are what your return goal is, how much risk you can tolerate, and how much liquidity you’re likely to require in the interim. Having reasonable and practical expectations is a valuable attribute found in successful investors.
Profit from the panic
Marks says that the best buying opportunities come when there are signs of a crisis and there is panic and there are others who are acting in reaction in large numbers. Sometimes, there may be technical or compliance issues for which there may be huge sell-offs in the markets which have nothing to do with fundamentals of the company. Investors hoping to make superior returns should play it right at times of such crisis and panic when the reaction of the markets is in excess of the problem at hand.
Defensive investing is the way to go
Marks argues that defensive investing, where you focus on avoiding bad outcomes, is the way to invest. He says that it is not as negative or non- aspirational as that but instead it actually can be seen as an attempt at higher returns. The idea is to do it by avoiding the losses backed by consistent but perhaps moderate progress rather than relying on occasional flashes of brilliance. Exclusion of losers from portfolios can be accomplished by conducting extensive due diligence, applying high standards, demanding a low price and being less willing to bet on uncertain factors. It is also about avoidance of poor years and, especially, exposure to meltdown in crashes. Defensive investing also requires thoughtful portfolio diversification, limits on the overall riskiness borne, and a general tilt toward safety.
WEALTH14 | WEALTH WATCH
READING ROOM
Rakesh is a well respected professional working as a consultant in a reputed organisation in Mumbai. He works hard for about 12-14 hours a day, including traveling. At a young age of 41, he feel exhausted at all times. Rakesh has gained weight, lost stamina, is unable is sleep very well and has unusual eating habits. He finds little time for family and the quality of that time is too in question. Overall, in spite of being professionally successful, Rakesh isn't really happy in life. The question is now is - what should be done?
Rakesh's experience is not uncommon. Most of us put in longer working hours, take extra responsibilities to respond to rising demands at our workplaces. Inevitably, we often pay the price for it in physical, mental and emotional ways. In spite of it, we keep pushing ourselves further and further to the point where we begin feeling as if we are at a breaking point.
Time is a challenge mainly because it is finite in nature. Even though we may all focus of time management, we would never be able to add meaningfully to the hours that we have. However, when it comes to energy, the story is entirely different. Energy for us would mean the capacity to do work. There are four sources of energy for us - body, mind, emotions and spirit. The extent to which we can each harness and expand our energies in each of these sources is infinite. The key is to adopt behaviours & practices which would regularly renew and systematically expand our energies. Often we do know most of these techniques but refrain to follow it in our lives. We now take a look at some of the simple ways in which we can expand our energies and also begin the transformation in our lives.
The Body:
It is hardly a news that we do not sleep, eat properly while leading a very sedentary lifestyle. Surprisingly though, we still are unable to find time for our body. If you really care about your body, here are the 4 things that you must do...
1. Set an early bed-time & wake-up time.
2. Discontinue drinking & smoking habits.
3. Exercise for at least 20 minutes daily.
4. Avoid big meals after big gaps. Instead eat small meals at small gaps, say 3 hours.
The Mind:
The mind is a very powerful tool that can either eat or build up energy. It all depends on how you manage it. Our minds may need to be tamed & trained by following a proper schedule, repeatedly. Over time, the mind starts doing things automatically & efficiently with less & less of energy. Here are a few things that you should do get more energy from your mind...
1. Focus on one task at a time: Studies show that this saves us the 'switching time' we are likely to finish our works 20% faster than while multi-tasking.
2. Take on the biggest challenge first: We should ideally begin any day by identifying the most important challenge & then doing it the first thing in the morning.
3. Take short breaks often: Taking short breaks, say after every 3 hours, from work can greatly refresh our minds, improve focus and keep energised for the day.
The Emotions:
On any given day, we would typically go through many different emotions. Feeling positive gives us energy but sustaining them for a long is not easy. The key then is to control our negative emotions which burn energy. Here are a few things that can help…
1. Observe and study your emotions: Begin by observing the pattern of your emotions, reasons, time and results. Knowing them can help us moderate our negative emotions.
2. Practice deep breathing: Deep and slow breathing for few seconds can
immediately help us release negative energy, especially when in stress.
3. Appreciate others: Appreciating and thinking good about others is a powerful way to feel positive ourselves. As a regular rituals, it can potentially transform you and your relationships.
4. Talk positive about self: It is a very powerful way of cultivating positive emotions. We should stop seeing ourselves as victims but how others may positively see ourselves..
The Human Spirit.
We can only tap into the energy of our souls when we do things that are closet to our hearts and our values. While doing so, we often feel having more energy, positive emotions, focus and perseverance. Here are a few ways by which we can reconnect ourselves to this enormous form of energy...
1. Set Priorities: Begin by self introspection. Ask simple questions like say, what you want? how do you want to be remembered? etc. This will help us prioritise in our lives by doing three things-doing what we do best, doing what we love or enjoy and by allocating and prioritising time for work, family and self.
2. Embed Values in Work: During our daily lives we may find it tough to devout time to our values such as - charity, cleanliness, compassion, etc. But we can very easily incorporate or adopt these values in our daily chores & rituals.
3. Meditate: A few minutes of meditation every day can help us in multiple ways, physical, mental and spiritual.
We can see ourselves as a manifestation of energy. The energy embodies itself in every character and is impacted by the sources we discussed earlier - the body holds the physical energy, the mind gives the focus of energy, the emotions dictate the quality of energy while the human spirit gives meaning and purpose to energy. The seeds transforming our lives lies in realising that we have the control over energy and that energy can be harnessed and nurtured.
Beyond Wealth Forget Managing your Time. Focus on Expanding your Energy.
WEALTH
Change Your Financial Plans with Change in Life Stage
WEALTH WATCH | 15
READING ROOM
Financial Planning is the process of
defining your dreams or goals in
financial terms and laying out
detailed plan to make best use of
available resources to achieve these
goals. A proper financial plan helps
you to give direction & meaning to
your financial decisions and life goals.
It enables you to understand how
each financial decision you make
affects other areas of your finances
and life goals. For example, buying a
particular investment product might
help you pay off your home loan
faster or it might delay your
retirement significantly. By looking at
each financial decision as part of the
whole, you can evaluate its' short and
long-term effects on your life goals.
You can also adapt more easily to life
changes and feel more secure that
your goals are on track.
Financial planning is not a one time
exercise but a process & a life long
exercise. As we all go through
different phases and events in our
lives, our financial plan will not remain
suitable for us any longer than
originally thought.
What is required is to keep modifying
your plan with changes in your life
stage or simply due to change in your
financial status. Just as how you
undergo regular health checkups to
review your health and regular
service for your vehicle, your
financial plan also needs regular
examination and tune. Without timely
changes in the financial plan, you may
wander away from the required path
to achieve your financial goals in life.
But before we begin reviewing the reasons that warrant a relook at our financial plans, let us first broadly look at the different life stages we normally go through in our lives. This will help us appreciate the different financial conditions and different priorities at different stages of our lives. We can broadly identify & categorise four life stages as given below:
1) Starting Out (25 to 30 years): Typically you can put young unmarried professionals/entrepreneurs in this stage. They are the one who have started earning, fresh after finishing their studies and with many aspirations. These are typically in their 20's planning to save for buying car, house & marriage as these are their priorities. The most important thing to consider at this stage is to avoid falling in debt trap and have an asset allocation geared towards equity for long term wealth creation.
2) Accumulation Phase (30 to 50): This phase can be typically divided in two sub categories. The first is newly married, starting new phase of married life without kids. They may be paying high EMIs for home, car, etc. which would take a big share of their rising incomes. The second is middle age group with children going to school & college. Typically such persons may be at high levels of income
in their business & professional lives. It is also likely that the home & car loan are already settled.
3) Reaping Phase (50 to 60): This is the stage when most of
the liabilities are paid off and income levels have reached a peak with even children now likely to be working or on verge of completing their education. An individual is planning to retire in few years.
4) Distribution Phase (60+): This is the retired phase of life. For many in salaried /business class, it is time for activities or hobbies or even work which you were not able to do during your working life. But most will be able to do so only if proper planning was made during working life. It is also time to plan for distribution /wealth transfer to the next generation.
Having developed a financial plan is a starting point and depending on your life stage, your financial plan will undergo complete revisions as your risk profile, life goals, income levels and expenses undergo drastic changes as you move through these stages in life.
Key Life /Financial Changes:
Apart from changing financial plan to keep track with life stage changes, which are few and spread far apart in time, changes must be made on a more regular basis. We recommend that the plan should be reviewed on at least an annual basis if not on a six-month basis. Apart from the timely review, reviews may also be done to adjust the financial plan for key life or financial changes & events that impact your finances in a meaningful way.
Change in financial conditions: The first reason why a financial plan is reviewed is for a change in financial conditions which may happen suddenly and unexpectedly rather than gradually where you may have
the time to adjust your financial plans. Such conditions may be cause of some external events like emergencies. Financial emergencies
related to life, health & well-being will impact finances if proper protection or insurance is not taken. Still there
WEALTH
may be emergencies which cannot be insured against like business losses, loss of job and so on. Whatever, may be the situation, such change in financial conditions do call for a review in financial plans.
Change in income levels: Given the uncertain and competitive nature of the market, it is possible that your income may see unfavourable or even favourable developments like – rise /fall in income levels, shortfall of bonus/variable pay, change of job, change in business profits, and so on. In adverse cases, your planned savings may go for a toss and you may even be forced to dig into your existing savings. In case of good surprises, again you may feel the need to accumulate & save as much as possible for future goals. All good and not so good developments call for a review of your financial plan.
Change in the number of dependents: Getting married or having children? Be prepared to see a big change in your responsibilities and expenses as the number of dependents on you increase. Such events often impact your cash flows and your financial plan. There will be a big need to review your insurance coverage and cover your dependents and increase the sum insured. Also when your children become independent & working or get married, they no longer remain dependent. This too will reflect a change
in your cash flows. A review of financial plan should consider these aspects properly.
Change in goals: We have different goals and priorities in life in different stages of our lives. When young you may plan for home and marriage, when in middle age, you may begin dreaming of starting your own startup or may prioritise education for children. Retirement planning unfortunately gets priority only when its late. Thus, your goals change as you progress in life. As a result, your investments and financial strategies also need to be updated to reflect the changing goals.
Change in risk profile: Just like your goals change in life, your risk profile and capacity also undergoes changes. At different times in your life your risk profile & ideal asset-allocation between equities & debt changes. When young you may afford to be very aggressive but with age and responsibilities, you may need to moderate your aggression. The risk profile, apart from age & family, is also an outcome of your income levels and your financial goals. As your life changes, your risk profile will change, calling for the need to change your financial plan after proper review.
Conclusion:
Clearly, review is something we must do regularly but what should be scope of
review? Almost everything material in your life can be reviewed along with the old plan. While reviewing, the falling things should be kept in mind...
Consider all financial goals - old & new and adjust for any changes in target amounts, horizon, priority, etc.
Consider the number of dependents, the risks exposed to & the insurance coverages
Review your financial cash-flows, standard of living, income & expenses
Review your existing investment plans, assets, liabilities & net-worth
Review plans keeping in mind inflation
The idea behind a financial plan is that all personal and economic changes in life are appropriately incorporated in the plan. This means that your financial plan grows and changes with your situation/ background. This however, does not mean that your financial plan should be reviewed only if you face the above changes in your life. Even if things do not change, you must review your financial plan at least once a year to analyse the position of your investments and see if this is helping you achieve your goals. Reviewing the plan regularly, making changes as required and leading a disciplined life will help you meet your goals and achieve financial stability.
16 | WEALTH WATCH
READING ROOM
RECHARGE
FOOD
TRAINBOOKING
MOBILEBANKING
FLIGHTBOOKING
MOVIETICKETS
EMAIL
TAXIBOOKING
SHOPPING
YOU CAN DO SO MUCH THROUGH YOUR MOBILE...
NOW MANAGE YOUR WEALTH THROUGH MOBILE WITHW E A L T H O N Y O U R F I N G E R T I P S
E-WealthAccountE-WealthAccount
W E A L T H O N Y O U R F I N G E R T I P S
E-WealthAccountE-WealthAccount
NJ E-Wealth Account is a comprehensive platform where you can view your entire wealth at a single place, be it in Mutual Funds, Direct Equity, ETFs, IPOs, Bonds together with their current valuation. Not only that you can also transact from anywhere in the world in all these products and buy, sell or switch your investments in any product simply through your computer or smart phone.
NJ E-Wealth Account Features
EASY & MULTIPLE MODES OF TRANSACTIONS
ONLINE MOBILE APP OFFLINE* ON PHONE* (CALL)0261 - 3987500
*Terms & conditions applicable.
E-WEALTH AC
Download Mobile Application
APPLE(App Store)
BLACKBERRY(App World)
ANROID(Play Store)
WEALTH WEALTH WATCH | 17
READING ROOM
1. “I don't need a separate insurance cover as I am already covered by my employer”
For salaried class individuals, many believe that the group medical & life cover provided by the employer is adequate enough for the family and there is no need for any additional insurance. But most of us conveniently forget that the said cover remains valid only till we continue to work and that the policy cover remains stagnant for many years. Also with high inflation, the question is whether the cover available is adequate? Another big reason to buy early is that the longer we delay, the costlier it gets for us. The good strategy is not wait and get personal life & health insurance covers as soon as possible.
2. “Term Plans should be avoided as I do not get any returns back”
Accept and get used to the fundamental objective of getting insurance – risk coverage. Not returns. The coverage should be adequate enough to cover the financial loss arising out of any unfortunate event. If we try to seek returns, we would need to compromise on the coverage aspect and end up not getting the best of either insurance coverage or returns. Pure term plans focus only on providing the maximum coverage for your money and that is a good thing since we can then insure our family for a much larger amount.
3. “Purpose of buying insurance policy is to save tax”
On many occasions insurance policies are bought for giving investment declaration towards end of financial year in order to save taxes. Such decisions
made are often without proper consideration of the product features or suitability. Remember that insurance is in nature of a long-term contract and one decision may have huge impact for a very long time. Making a decision without proper need assessment and research can prove to be very costly. Explore other suitable avenues if you want to save taxes in a hurry.
4. “I am young & fit and I don't need insurance”
Most believe that insurance is not needed when one is young as there are no dependents and also when the person is in good health. Well, the best time to insurance is in fact when you are young and healthy. That way you can get insurance for the maximum period and for the cheapest possible premiums. Buying insurance after you have passed your prime age can prove to be much costly. Also, if you are diagnosed with any disease, you may not get insurance at all. Another view is that young persons today are much more prone to life-style related diseases and accidents.
5. “Insurance is a forced form of savings”
Many people, believe that insurance is a forced form of savings and this is also pitched by many insurance advisors who push products offering both insurance cover and investment returns. But is this right? To take it as a savings tool is a crude form of saying that you cannot save money otherwise. It would do wonders if we explore other much more sophisticated and suitable products for savings like mutual funds to help you save regularly. Doing insurance primarily
for the purpose of saving has huge opportunity costs as we may miss the returns and benefits which other pure investment products offer.
6. “Private insurers cannot be trusted to pay claims”
A very common myth that most traditional investors have is that private insurers are out there only for business and will often reject claims. Well nothing can be far from truth. Of course private insurers are running a business but that does not mean that they are not customer oriented. Private insurers are likely to be more efficient, technology powered, customer friendly and will surely pay all genuine claims. They often also have more competitive, innovative products to suit your needs at affordable premiums. At the end of the day, there are good and bad insurers in both segments, but it is better that we decide based on research and without any preconceived notions.
7. “Only the breadwinner of the family needs insurance”
Every person in the family needs insurance cover. The only thing which changes is the extent of coverage depending on the earning capacity. Most Indians often do not buy adequate life & personal accident insurance coverage for wife and young adults. The insurance coverage is only limited to the health coverage as part of a family floater policy. Needless to say, both the insurance scope and the coverage adequacy is in question. Realise that even homemakers have an economic value as they run the house and manage everything in your life even though it cannot be substantiated. It is recommended that
InsuranceMyths Decoded:It is a sad reality that in India, insurance is sold & not bought. Also the maximum selling happens during January-March quarter towards end of financial year with people rushing into financial products & insurance for tax benefits. This defeats the primary purpose of insurance. Tax
benefit, should be a by-product and not the primary reason for insurance as most people perceive it to be. Unfortunately, the list of common but incorrect, misunderstood or wrongly perceived notions and myths for insurance abound; perhaps more than any other financial
product. As savvy investors, we must acknowledge the real facts and background behind these myths and bust them before we take any new step in planning our insurance.
WEALTH18 | WEALTH WATCH
READING ROOM
Test Your WQThe Wealth Quotient Quiz1. Which of the following is not a
characteristic of Insurance?a) Insurance helps build your the risk
capacity
b) Insurance allows financial security against future risk, accidents and uncertainty
c) Insurance helps in reducing anxiety and fear before and after the loss occurs
d) Insurance protects and prevents the asset from loss due to the peril
2. If each of the following persons had the same amount of take home salary, who would need the greatest amount of life insurance?
a) Ranvir - 30 years old, single with no children
b) Sachin – 39 years old with one young child
c) Amitabh - 65 years old with two adult children
d) Salman - 48 years old, single with no children
3. What does GDP, a key indicator of macro economics for a country, stand for?
a) Gross Distribution Product
b) General Domestic Product
c) Gross Domestic Product
d) Gross Distribution Power
4. Which of the following products can be accessed by an Investor through a trading and a demat account?
a) Mutual Funds
b) Direct Equities
c) Exchange Traded Funds
d) All of the Above
5. If Mr. Rahul Rs.10,000 to invest in savings product with the following options, which option, in your view, would give him the best returns after one year?
a) Monthly compounding @ 1% per month
b) Quarterly compounding @ 3% per quarter
c) Yearly compounding at @ 12%
6. Which of the following is not a familiar style of investing into equities?
a) Value Investing
b) Growth Investing
c) Price Investing
d) Technical Analysis
7. Which among the following credit lines often carries the highest rate of interest?
a) Credit Card
b) Personal Loan
c) Home Loan
d) Bank Over Draft
8. In finance terms, what does 'Opportunity Cost' stand for?
a) The loss /cost of the next best alternative option when you have made one choice
b) The total cost for pursuing any decision/project or opportunity
c) The costs/losses that occur after an opportunity has failed to succeed
9. If you have caused an accident, which type of automobile insurance would cover damage to your own car?
a) Collision Policy
b) Comprehensive Policy
c) Third Party Liability Policy
10. Debt mutual funds are highly advisable for investors having an investment horizon of over three years because …
a) The long term capital gains is at only 20% after indexation
b) There is no TDS deducted on the investments
c) Tax is not levied every year like bank FD but only on year of maturity
d) There is an upside potential to returns as they are market linked
you explore all possible risks and coverages for other family members.
8. “The old Mediclaim Policy documents are useless”
Many of us think there is no use of expired mediclaim policy specially when the policy is successfully renewed. But sometimes a insurer may change the TPA and there is a possibility that the TPA may have insufficient data about your previous claims and continuity of policies. TPAs sometimes demand copies of your previous policies of last 3 or 4 years to check continuity of policy in case of any claim. It is therefore advised
to keep repository of old policies as they may come in handy in claim settlement.
9. “I have Personal Accident Rider in my Life Insurance Policy. I don't need a separate policy”
Having rider can not substitute the features & benefits of a stand-alone policy. Adding rider is only additional benefit that company provides at additional cost in terms of higher premiums. Rather than adding rider on main policy, it makes more sense to buy independent policy specially in case of personal accident as still in India personal accident policies come cheap
in terms of premium to sum assured.
10. “Insurance is a must have for everyone”
Again objective of buying insurance needs to be understood here. Insurance is bought to cover financial liability or give financial protection to family members in case of untimely death of earning member. Now this does not necessarily mean that everyone needs to have an insurance. If you do not have any financial liability, do not have any dependent or you are rich enough to support your family then you may not require to buy insurance.
WEALTH WEALTH WATCH | 19
READING ROOM
WILLSAn Effective Tool for Estate Planning
We all dream of leaving a legacy where we are fondly remembered by our loved ones who would be well taken care of. This is a desire which everyone carries, irrespective of our age. The cruel fact of life is that your dream, your preparation for a better tomorrow for your loved ones can be put to test any day, again irrespective of your age. As rational, caring and responsible persons, it is thus our duty to do all that is expected to protect the future of our loved ones from any eventuality. In this article, we will talk about an important aspect of wealth management / planning which no one can afford to evade.
Estate Planning is an important aspect of financial planning but is very often neglected by us. We often talk about wealth creation, management and protection but rarely do we think about wealth transfer. In India, estate planning is not a popular topic and the awareness about estate planning is very limited to most of us, however educated we may be. Most believe that estate has something to do with real estate and that is the level of ignorance most carry with us. But this does not mean that estate planning is not needed for us. The fact is, estate planning is as important to us as any thing else, even though our estate itself may not be a huge thing.
Apart from ignorance, there is also a visible cultural reluctance to discuss estate and succession planning. There is a huge need for greater awareness for estate planning since a lot of wealth is today present in our families which needed to be effectively protected & managed for smooth transfer the next generation. This observation certainly echoes in India where the majority of businesses today are family-run but most Indian businesses families do not have succession plans in place for personal and/or business wealth.
What is Estate Planning?
An estate is the net worth of a person at any point in time alive or dead. It is the sum of a person's assets – legal rights, interests and entitlements to property of any kind – less all liabilities at that time.
Estate planning is the process of anticipating and arranging, during a person's life, for the disposal of their estate. An Estate Plan incorporates a person’s wishes about his estate, could be regarding management, preservation and distribution of his/her legacy during and post life. The primary goal of estate planning is ensuring that the estate of the individual passes to the estate owner’s intended beneficiaries in an tax efficient manner while avoiding complexity and delays by legal processes & courts interventions.
Tools of Estate Planning:
There are various tools that a person can adopt for getting an estate plan in place. Some tools are effective during the lifetime of an individual while some after his/her death. The following are the popular tools used for estate planning by transferring the assets to the beneficiary, with or without restrictions,
A) During lifetime:
Gift
Trusts
Power of Attorney
Partition
B) Post Death:
Will
What is a Will:
A Will is the most practical first step in estate planning and also often the most appropriate for majority of us. The importance of drawing up a Will is often highlighted as one of the biggest
f inancial planning steps
you Will take and it is something that is
ideally suitable for a majority of us.
A Will is a legal declaration of the intention of a person regarding assets that the individual desires to take effect after his or her death. It is a confidential, personal document that clearly states how you want your assets to be distributed when you are no longer physically present.
Not Having A Will:
If you don't have a will, and thus die 'intestate', your estate will be distributed according to the succession laws of India based on your religion. Your property will then be distributed differently than what you would like it to be. Your loved ones will have no control over your estate and there are chances that conflicts may arise. A Will obstructs the natural flow of succession laws so that the assets are inherited as per the wishes of the person concerned. Further, it is most likely that your family, in your absence, will face huge problems and delays in getting the assets transferred to their names. It would involve a lot of legal procedures, visits to courts and not surprisingly, much delays at a time when your family needs emotional & financial support.
The laws of succession certainly do not cater to the specific needs of your family. For example, in absence of a Will, your father may end up getting nothing as per laws and everything will go to your spouse, mother and children under the Hindu Succession Act. Another problem will arise where laws do not distinguish between handicapped or mentally challenged persons and the only way to make sure that such dependents get a higher share is through a Will. Also, apart from the legal heirs recognised by law,
none of other loved ones and dependents will get anything and this will cover your siblings, even if they need care and support. One also needs to remember that even if you have appointed nominees to your financial assets, they are only 'custodians' of the assets and not owners! Your legal heirs, as per the succession act, will be the real owners after your death.
Advantages of writing a Will:
India is fast changing. We no longer rely on our traditions where family legacy was passed on from father to sons without much issues. Today, things are much difficult and family dynamics have also changed and so have the laws. Today, it is difficult to leave a legacy without family conflicts even though they may not be visible today. For many families wealth distribution may take place within the lifetime of the main owners. Though, this is not the case with every family, and some very famous incidents have occurred in some of the wealthiest families which clearly highlights the issue of “lack of proper estate planning” and how quickly a family dispute can spiral into a big conflict.
The clear answer to avoid all this confusion and conflict is to write a Will. A Will is the best way to ensure hassle free transfer /distribution of assets to the beneficiaries as per wishes of Will writer called as the “Testator”. Having a Will greatly helps by...
Consolidation of all asset details at one place
Ensuring financial care of dependents, special child, and minors
Appointing guardians /care takers to your child and other dependents
Distribution of assets as per your wishes and not as per the laws of the land
Preventing disputes in the family by stating distribution of assets clearly
Ensuring your loved ones do not face lengthy legal processes /hassles in your absence
Protection and handling of assets as per your wishes
Avoiding courts issuing Letter of Administration and appointing an Executor
Reducing chances /grounds of disputes /fights in family regarding distribution
Survival and continuation of business and/or charitable causes
Who can make a Will and what are the characteristics of a Will?
Well, any person who is an adult, in sound state of mind and free from influences, can write a will. Further, there are no restrictions as to how a will needs to written or drafted. A hand written will signed by you and at least two witnesses is good enough as per law.
The following are the important characteristics of a will:
1. Will is a very flexible document and easily modifiable
2. A Will can be in any written in any language, manner or form as there is no specific requirement for same
3. A Will is not required to be written on stamp paper or be registered by law
4. Will ensures the proper method and proportion of distribution of assets
5. A Will can be modified or altered at any time and any number of times during life time
6. A Will is revocable during the lifetime
Requirements of a good Will:
While there appears to be no big requirements for writing a Will, it is very often seen that such Wills are often contested and are held up in disputes. The entire effort and purpose of writing a Will can go for a toss if the Will document is not correctly drafted. Hence, proper care & time should be taken while drafting the same. The following are the requirements for a Will to be considered good & properly drafted...
1. All necessary identification details of the all parties including, Testator, Beneficiaries, Executor and Witnesses
2. Clear & detailed information of all assets and liabilities
3. Clear information about the
Beneficiaries & their relationship with the Testator
4. Clear information of what assets will be given and in what proportion to which Beneficiary
5. A Will has to be signed by Testator and Witnesses (at least 2) to be legally valid
6. Will should be printed on a valid stamp paper and registered with the Registrar to reduce chances of any contest
7. Statements on family background, including statements justifying disproportionate allocation or non-allocation of assets to Beneficiaries
The Will document, in spite of being clear and detailed, can still be contested and challenged if the language and other declarations are not clearly mentioned in the document. Our approach to preparation of our Will should be uncompromising when it comes to quality. Hence, it is strongly recommended that this important piece of document be prepared by experts, in proper formats and clear language.
Conclusion:
You work hard to build your assets (investments, property, etc) to provide a level of financial security for loved ones. Hence, it makes sense that we work to protect them and ensure that they continue to enjoy the fruits of our labour in the event something happens to us. It is surprising that, on one hand, we are very open and informed about taking a life insurance policy for such a scenario. But on the other hand, we are not giving the same level to important to estate planning which again is related to the happening of the same event. Should we not realise that estate planning is as much important as taking life insurance if not more and they are different sides of the same coin? It is better that you ask this question to yourself and make the right decision in the best interests of your loved ones.
WEALTH20| WEALTH WATCH
READING ROOM
WEALTH WEALTH WATCH | 23
READING ROOM
RecommendedELSS Funds (Tax saving)
RECOMMENDED MUTUAL FUND SCHEMES
Scheme Name
Axis Long Term Equity Fund
Birla Sun Life Tax Relief 96 Fund
BNP Paribas Long Term Equity Fund
Religare Invesco Tax Plan
SBI Magnum Tax Gain Fund
Inception Date
29-Dec-09
29-Mar-96
05-Jan-06
29-Dec-06
31-Mar-93
Avg. AUM (Crs)
6,480
1,948
409
255
4,719
Sharpe
0.40
0.29
0.26
0.27
0.22
Beta
0.84
0.95
0.94
0.98
0.93
Treynor
1.81
1.27
1.17
1.17
0.96
Alpha
0.76
0.35
0.26
0.27
0.05
Performance as on December 31, 2015. Returns are calculated on CAGR basis.
Min. Investment-FreshAdditional InvestmentSIP – MonthlyEntry LoadExit Load
Risk Analysis*:4.550.390.941.890.94
Standard DeviationSharpeBetaTreynorAlpha
Sector Exposure (Top 5)
MUTUAL FUND SCHEME CLOSE-UP
Investment Objective:
To provide investors with opportunities for long-term growth in capital along with the liquidity of an open-ended scheme by investing predominantly in a well diversified basket of equity stocks of Midcap companies.
Fund Manager:
Ms. Sohini Andani, has an experience of more than 19 years in the field of financial services, managing this fund since July 2010.
(As on December 31, 2015)
Growth of s1 lac invested on inception date
Calendar Year Wise Performance:
SBI Magnum Midcap Fund
S&P BSE Midcap
Avg of Peer Funds
14.92
9.95
9.20
71.94
46.41
75.51
13.57
0.34
5.15
47.98
48.58
41.70
-25.78
-32.81
-24.85
Scheme Name CY 2015
CY 2014
CY2013
CY2012
CY2011
Scheme Snapshot:Type : Open-ended growth schemeAAUM : R1,326 CrsNAV (Gr) : R61.74Expense Ratio : 2.55%Inception Date : March 29, 2005Benchmark : S&P BSE MidcapAvg Mkt Cap : R9,150 CrsNote: Avg market cap is based on available portfolio detail of 94% of equity holdings.
*Based on 3 year period
0
5
10
15
20
25
30
35
40
7 Yr5 Yr3 Yr2 Yr1 Yr
0
10
20
30
40
50
7 Yr5 Yr3 Yr2 Yr1 Yr
Financial Services
Pharma
Industrial Products
Consumer Goods
Fertilisers
0% 2% 4% 6% 8% 10% 12% 14% 16% 18%
16.02%
15.32%
12.92%
9.54%
9.53%
SBI Magnum Midcap Fund S&P BSE Midcap
Mar
05
Mar
06
Mar
07
Mar
08
Mar
09
Mar
10
Mar
11
Mar
12
Mar
13
Mar
14
Mar
150
100000
200000
300000
400000
500000
600000
700000Rs 6.17 Lacs
Rs 3.64 Lacs
WEALTH WEALTH WATCH | 27
MUTUAL FUNDS UPDATES
Reliance EquityOpportunities Fund
Performance Analysis - Lumpsum:
Reliance Equity Opp. Fund
S&P BSE 100
Avg of Peer Funds
0.51
-3.25
2.90
26.68
13.13
24.58
18.83
10.66
17.02
14.15
5.51
9.94
26.39
15.41
19.67
Scheme Name 1 Yr 2 Yr 3 Yr 5 Yr 7 Yr
Performance
Reliance Equity Opportunities Fund S&P BSE 100 Avg of Peer Funds
Performance Analysis - SIP:
Reliance Equity Opp. Fund
S&P BSE 100
Avg of Div. Equity Funds
0.50
-6.19
0.87
15.49
3.76
15.38
22.09
9.32
21.27
20.43
10.37
18.72
20.80
10.28
17.12
Scheme Name 1 Yr 2 Yr 3 Yr 5 Yr 7 Yr
Performance
Reliance Equity Opp. Fund S&P BSE 100 Avg of Div. Equity Funds
Min. Investment-FreshAdditional InvestmentSIP – MonthlyEntry LoadExit Load
Risk Analysis*:4.490.211.010.950.06
Standard DeviationSharpeBetaTreynorAlpha
Sector Exposure (Top 5)
Investment Objective:
The primary investment objective of the scheme is to seek to generate capital appreciation & provide longterm growth opportunities by investing in a portfolio constituted of equity securities & equity related securities & the secondary objective is to generate consistent returns by investing in debt and money market securities.
Fund Manager:
Mr. Sailesh Raj Bhan, has over 18 years of experience in Equity research and fund management, managing this fund since March 2005.
(As on December 31, 2015)
Growth of s1 lac invested on inception date
Calendar Year Wise Performance:
Reliance Equity Opp. Fund
S&P BSE 100
Avg of Peer Funds
0.51
-3.25
2.90
59.67
32.28
49.89
4.55
5.87
5.24
47.35
29.95
32.84
-21.63
-25.73
-24.40
Scheme Name CY 2015
CY 2014
CY2013
CY2012
CY2011
Scheme Snapshot:Type : Open-ended equity schemeAAUM : R11,427 CrsNAV (Gr) : R74.41Expense Ratio : 2.21%Inception Date : March 31, 2005Benchmark : S&P BSE 100Avg Mkt Cap : R64,000 CrsNote: Avg market cap is based on available portfolio detail of 99% of equity holdings.
*Based on 3 year period
-10
-5
0
5
10
15
20
25
7 Yr5 Yr3 Yr2 Yr1 Yr
-5
0
5
10
15
20
25
30
7 Yr5 Yr3 Yr2 Yr1 Yr
Reliance Equity Opp. Fund S&P BSE 100
Banks
Industrial Capital Goods
Pharmaceuticals
Software
Industrial Products
0% 5% 10% 15% 20% 25%
20.71%
15.97%
11.34%
9.25%
7.15%
Mar
05
Dec 0
5
Sep 0
6
Jun
07
Mar
08
Dec 0
8
Sep 0
9
Jun
10
Mar
11
Dec 1
1
Sep 1
2
Jun
13
Mar
14
Dec 1
4
Sep 1
5
0
100000
200000
300000
400000
500000
600000
700000
800000 Rs 7.44 Lacs
Rs 4.01 Lacs
WEALTH28 | WEALTH WATCH
MUTUAL FUNDS UPDATES
AxisEquity Fund
Performance Analysis - Lumpsum:
Axis Equity Fund
NIFTY 50
Avg of Peer Funds
-2.85
-6.35
-4.47
-1.24
-4.06
0.23
17.94
12.27
19.39
16.44
10.40
14.51
10.00
5.31
8.38
Scheme Name 6 Mth 1 Yr 2 Yr 3 Yr 5 Yr
Performance
Axis Equity Fund NIFTY 50 Avg of Peer Funds
-10
-5
0
5
10
15
20
5 Yr3 Yr2 Yr1 Yr6 Mth
Performance Analysis - SIP:
Axis Equity Fund
NIFTY 50
Avg of Div. Equity Funds
-1.17
-6.94
0.87
9.10
2.90
15.38
14.32
8.47
21.27
16.24
10.18
20.78
15.51
9.84
18.72
Scheme Name 1 Yr 2 Yr 3 Yr 4 Yr 5 Yr
Performance
Axis Equity Fund NIFTY 50 Avg of Div. Equity Funds
Min. Investment-FreshAdditional InvestmentSIP – MonthlyEntry LoadExit Load
Risk Analysis*:3.870.200.870.88-0.02
Standard DeviationSharpeBetaTreynorAlpha
Sector Exposure (Top 5)
Investment Objective:
To achieve long term capital appreciation by investing in a diversified portfolio predominantly consisting of equity and equity related securities including derivatives. However, there can be no assurance that the investment objective of the Scheme will be achieved.
Fund Manager:
Mr. Pankaj Murarka has over 17 years of total experience, managing this fund since June 2013.
(As on December 31, 2015)
Growth of s1 lac invested on inception date
Calendar Year Wise Performance:
Axis Equity Fund
NIFTY 50
Avg of Peer Funds
-1.24
-4.06
0.23
40.84
31.38
42.43
13.49
6.75
5.61
31.73
27.69
29.27
-22.55
-24.61
-22.65
Scheme Name CY 2015
CY2014
CY2013
CY2012
CY2011
Scheme Snapshot:Type : Open-ended growth schemeAAUM : R1,929 CrsNAV (Gr) : R19.07Expense Ratio : 2.55%Inception Date : January 05, 2010Benchmark : NIFTY 50Avg Mkt Cap : R1,31,500 CrsNote: Avg market cap is based on available portfolio detail of 97% of equity holdings.
Min. Investment-FreshAdditional InvestmentSIP – MonthlyEntry LoadExit Load
Risk Analysis*:7.460.221.131.460.63
Standard DeviationSharpeBetaTreynorAlpha
Sector Exposure (Top 5)
Investment Objective:
To generate capital appreciation from a portfolio of predominantly equity and equity related securities. The portfolio will generally comprise of equity and equity related instruments of around 50 companies which may go up to 59 companies but will not exceed 59 at any point in time.
Fund Manager:
Mr. Harish Krishnan has over 10 years of total experience, managing this fund since November 2013.
Growth of s1 lac invested on inception date
Calendar Year Wise Performance:
Kotak 50
NIFTY 50
Avg of Peer Funds
3.77
-4.06
0.23
42.47
31.38
42.43
4.26
6.75
5.61
23.41
27.69
29.27
-18.46
-24.61
-22.65
Scheme Name CY 2015
CY2014
CY2013
CY2012
CY2011
Scheme Snapshot:Type : Open-ended equity schemeAAUM : R1,231 CrsNAV (Gr) : R169.95Expense Ratio : 2.40%Inception Date : December 29, 1998Benchmark : NIFTY 50Avg Mkt Cap : R1,44,100 CrsNote: Avg market cap is based on available portfolio detail of 97% of equity holdings.
*Based on 3 year period
Banks
Software
Auto
Consumer Non Durables
Cement
0% 5% 10% 15% 20% 25%
24.55%
15.26%
10.82%
8.63%
6.80%
Kotak 50 NIFTY 50
Dec 98
Jun 0
0
Dec 01
Jun 0
3
Dec 04
Jun 0
6
Dec 07
Jun 0
9
Dec 10
Jun 1
2
Dec 13
Jun 1
50
500000
1000000
1500000
2000000
2500000Rs 22.99 Lacs
Rs 9.11 Lacs
WEALTH30 | WEALTH WATCH
MUTUAL FUNDS UPDATES
-5
0
5
10
15
20
25
7 Yr5 Yr3 Yr2 Yr1 Yr
L&T IndiaLarge Cap Fund
Performance Analysis - Lumpsum:
L&T India Large Cap Fund
S&P BSE 100
Avg of Peer Funds
-0.23
-3.25
0.23
20.10
13.13
19.39
15.72
10.66
14.51
8.59
5.51
8.38
20.10
15.41
17.30
Scheme Name 1 Yr 2 Yr 3 Yr 5 Yr 7 Yr
Performance
L&T India Large Cap Fund S&P BSE 100 Avg of Peer Funds
Performance Analysis - SIP:
L&T India Large Cap Fund
S&P BSE 100
Avg of Div. Equity Funds
-4.79
-6.19
0.87
9.48
3.76
15.38
15.26
9.32
21.27
14.30
10.37
18.72
14.36
10.28
17.12
Scheme Name 1 Yr 2 Yr 3 Yr 5 Yr 7 Yr
Performance
L&T India Large Cap Fund S&P BSE 100 Avg of Div. Equity Funds
-10
-5
0
5
10
15
20
25
7 Yr5 Yr3 Yr2 Yr1 Yr
Investment Details:Rs. 5,000Rs. 1,000Rs. 500NIL1% upto 1 yr
Min. Investment-FreshAdditional InvestmentSIP – MonthlyEntry LoadExit Load
Risk Analysis*:3.970.180.900.79-0.10
Standard DeviationSharpeBetaTreynorAlpha
Sector Exposure (Top 5)
Investment Objective:
The investment objective of the Scheme is to generate long-term capital appreciation from a diversified portfolio of predominantly equity and equity related securities, including equity derivatives. The Scheme will predominantly invest in large cap stocks. The Scheme could also additionally invest in Foreign Securities.
Fund Manager:
Mr. Venugopal Manghat, has over 21 years of rich experience, managing this fund since November 2012. Mr. Abhijeet Dakshikar, has over 11 years of experience, looking after investments in Foreign Securities.
(As on December 31, 2015)
Growth of s1 lac invested on inception date
Calendar Year Wise Performance:
L&T India Large Cap Fund
S&P BSE 100
Avg of Peer Funds
-0.23
-3.25
0.23
44.57
32.28
42.43
7.43
5.87
5.61
23.60
29.95
29.27
-21.17
-25.73
-22.65
Scheme Name CY 2015
CY2014
CY2013
CY2012
CY2011
Scheme Snapshot:Type : Open-ended equity schemeAAUM : R383 CrsNAV (Gr) : R19.97Expense Ratio : 2.80%Inception Date : October 23, 2007Benchmark : S&P BSE 100Avg Mkt Cap : R1,22,200 CrsNote: Avg market cap is based on available portfolio detail of 93% of equity holdings.
*Based on 3 year period
Banks
Auto
Pharmaceuticals
Cement
Software
0% 5% 10% 15% 20% 25%
22.47%
11.22%
8.81%
7.11%
7.10%
L&T India Large Cap Fund S&P BSE 100
Oct 07
Jun 08
Mar
09
Dec 09
Sep 10
Jun 11
Mar
12
Dec 12
Sep 13
Jun 14
Mar
15
Dec 15
0
50000
100000
150000
200000
250000Rs 2.00 Lacs
Rs 1.46 Lacs
WEALTH WEALTH WATCH | 31
MUTUAL FUNDS UPDATES
MARS - DynamicAsset Allocation Portfolio
PERFORMANCE UPDATES
Scheme Name
DAA-AGGRESSIVE
Nifty 500
DAA-MODERATE
60% Equity & 40% Debt
DAA-CONSERVATIVE
30% Equity & 70% Debt
1 month
-2.01
-5.73
-0.99
-2.94
-0.29
-1.06
3 Months
-1.24
-6.10
-0.30
-2.61
0.53
-0.23
6 Months
-2.11
-10.79
-0.08
-4.64
1.58
-0.22
2 Years
23.39
16.03
17.33
13.90
13.12
11.59
1 Year
2.26
-11.54
4.03
-3.36
5.78
2.70
Since Inception
21.92
14.47
16.52
12.93
12.76
11.09
MARS - FixedAsset Allocation Portfolio
Scheme Name
FAA E10
10% Equity & 90% Debt
FAA E20
20% Equity & 80% Debt
FAA E30
30% Equity & 70% Debt
FAA E40
40% Equity & 60% Debt
FAA E50
50% Equity & 50% Debt
FAA E60
60% Equity & 40% Debt
FAA E70
70% Equity & 30% Debt
FAA E80
80% Equity & 20% Debt
FAA E90
90% Equity & 10% Debt
FAA E100
Nifty 500
1 month
% Returns as on 31 January 2016
% Returns as on 31 January 2016
-0.18
0.10
-0.85
-0.47
-1.42
-1.06
-2.00
-1.67
-2.56
-2.30
-3.25
-2.94
-3.90
-3.61
-4.55
-4.29
-5.24
-5.00
-5.94
-5.73
3 Months
0.78
1.26
0.16
0.53
-0.54
-0.23
-1.14
-1.00
-1.90
-1.79
-2.63
-2.61
-3.34
-3.44
-4.05
-4.30
-4.78
-5.19
-5.53
-6.10
6 Months
2.16
2.63
0.83
1.21
-0.66
-0.22
-2.22
-1.68
-3.29
-3.15
-4.69
-4.64
-6.01
-6.15
-7.32
-7.68
-8.71
-9.22
-10.10
-10.79
1 Year
6.30
6.69
5.47
4.70
3.73
2.70
2.26
0.69
0.74
-1.33
-0.55
-3.36
-1.88
-5.39
-3.22
-7.44
-4.61
-9.49
-6.02
-11.54
2 Years
10.54
9.70
13.22
10.68
14.94
11.59
17.02
12.43
19.03
13.20
20.78
13.90
22.52
14.53
24.18
15.10
25.61
15.60
26.96
16.03
Since Inception
10.39
9.53
12.84
10.34
14.41
11.09
16.23
11.77
18.09
12.38
19.66
12.93
21.20
13.41
22.65
13.83
23.91
14.18
25.09
14.47
Notes: (a) Performance as on 31 Jan 16. Date of Inception: 16 December 2013. (b) Returns for one year or less period are on an absolute basis and for more than a year period are on CAGR basis. (c) Benchmark is made of Nifty 500 (Source: NSE) and Bank FD (data from RBI). (d) Clients performance may differ from the model portfolio performance. (e) Past Performance may or may not sustain in the future.
WEALTH32 | WEALTH WATCH
NJ UPDATES
MARS - Dynamic AssetAllocation Portfolio - Aggressive Equity Holding Pattern
Equity PMS:Large Cap Portfolio
Equity PMS:Mid Cap Portfolio
Scheme Name
Large Cap Portfolio
CNX Nifty
1 year
-14.35
-14.14
3 years
15.99
7.82
5 years
12.69
6.55
Since Inception
25.50
16.94
Scheme Name
Mid Cap Portfolio
CNX Midcap
1 year
1.13
-4.99
3 years
31.83
14.24
5 years
26.48
9.49
Since Inception
16.60
4.86
Month wise trend line for % equity holding
Strategy Inception Date: Mar 24, 2003; The Above strategy returns are of a Model Client as on January 31st, 2016. An investment of Rs.1 crore made in this portfolio in March 2003 is worth Rs.18.56 crores as on January 31st, 2016. The same investment if made in the CNX Nifty is worth Rs.7.48 crores.
Strategy Inception Date: Dec 11, 2007; The Above strategy returns are of a Model Client as on January 31st, 2016. An investment of Rs.1 crore made in this portfolio in December 2007 is worth Rs.3.50 crores as on January 31st, 2016. The same investment if made in the CNX Mid Cap is worth Rs.1.47 crores.
The following Equity Portfolios are being offered under NJ Equity PMS:
Large Cap Portfolio
Mid Cap Portfolio
Large Cap Portfolio
This Portfolio is a mirror image of
Motilal Oswal Value Strategy. The key
highlights of the portfolio are as follows:
1. Focus on companies that are
growing 20-25% on their net worth year
on year.
2. Maintain a margin of safety by
buying great businesses at a fraction of
their true value.
3. Focus on buying undervalued
companies or buying reasonably priced
companies with stable earnings/ cash
flow.
4. Money is made by investing for the
long term only. No short cuts to wealth
creation.
5. Identity potential wealth creating
companies by focussing on their
individual strengths and management
bandwidth.
6. Portfolio size will be restricted to 15
– 20 stocks.
Strategy Objective
The Strategy aims to benefit from the
long term compounding effect on
investments done in good businesses,
run by great business managers for
superior wealth creation.
This strategy will be implemented with
the philosophy of value investing where
a business is prudently picked for
investment after a thorough study of its'
underlying hidden long-term potential.
Value Investment involves determining
the Intrinsic value of a stock, and
investing in it if the difference between
the value and the stock price provides a
sufficient Margin of Safety.
Investment Process:
A rigorous investment process is
followed covering the following:
1. Creating an Investment Universe from
existing and emerging Large Cap
companies including event-driven
'special situation' ideas
2. Doing a Quantitative Screening of the
universe with focus on earnings, free
cash flow, return on assets and earnings.
This results in a long-list of around 500
stocks.
3. Fundamental Analysis is done on
each of the companies which covers
'360 degree view' of the company,
identifying competitive advantages,
nature, duration and sustainability of the
business and the model and barriers to
entry. This creates a short-list of 80 – 100
stocks.
4. The Fund Portfolio is created from this
short-list which comprises of the high
conviction ideas with superior
risk-adjusted returns for clients. The
portfolio comprises of 15 – 20 stocks.
NJ Equity PMS is a new offering from the
NJ PMS Platform. NJ PMS is managed by
NJ Advisory Services Pvt. Ltd. (NJAS), a
subsidiary of NJ India Invest Pvt. Ltd.
NJAS is a SEBI licensed Portfolio Manag-
er and manages AUMs of Rs.209.12
crores with 904 live accounts as on
December 31st, 2015.
Till date, NJAS has offered a Mutual Fund
– Fund of Funds (FOF) strategy called
Dynamic Asset Allocation Portfolio
(DAAP). With its strong background in
Mutual Fund research and analysis,
NJAS strength lies in identifying good
Fund Managers to manage and grow
client's wealth through the Mutual Fund
route. With this offering, NJAS endeav-
ours to identify good PMS managers for
managing wealth of HNI clients and
family groups.
NJ Equity PMS
WEALTH34 | WEALTH WATCH
NJ UPDATES
Performance Track Record:
Mid Cap Portfolio
This Portfolio is a mirror image of Motilal Oswal Next Trillion Dollar Opportunities Portfolio (NTDOP). Before we share details about this portfolio, let us look at some characteristics of the Mid Cap market:
Large universe of stocks available for investments
The companies are generally under-owned by investors and under-researched by analysts.
The companies are in fewer business lines and therefore very focussed in their approach
The valuation as compared to Large cap stocks is very attractive.
Strategy Objective
The objective of the Mid Cap Portfolio is to deliver superior returns by investing in focused themes from the small and mid cap stock segment which will be part of the Next Trillion Dollar GDP growth opportunity. Some themes which are likely to participate in this opportunity are as follows:
Consumption Theme – which can include increasing consumer spending, retail, consumer durables, passenger cars and utility services
Banking and Financial Services – will
include Banks, Broking houses, Insurance and other financial intermediaries which are likely to benefit from the high GDP growth and savings rates.
Infrastructure and related themes - which can include power, cement, capital goods, construction, real estate, engineering and any other sector likely to benefit from government spending.
Investment Process:
Stock selection plays a very important role in this portfolio due to the large universe of stocks and the limited research available in the market. The portfolio manager & his team will follow the following process for stock selection:
1. Meeting with company management to understand the business dynamics
2. Visit the company's plants and work-sites to understand manufacturing process, quality of fixed assets and entry barriers to setting up business
3. The focus of the meetings and visits is to understand the corporate governance standards, management track record and capabilities for scalability
4. The portfolio manager with also keep an eye out for turnaround stories, emerging sectors and product innovations.
Performance Track Record:
Conclusion
The Large Cap and Mid Cap Portfolios have done very well in the last 3 – 5 years and with the positive sentiments in the economy, are expected to perform very well doing forward. Since the underlying asset class in both portfolios is equity, it comes with its inherent risks and volatility. The minimum time horizon recommended for investment in both portfolios is at least 3 - 5 years. These portfolios are designed and managed for
long term investors who are looking to create substantial wealth for themselves and their families.
At NJ PMS, our endeavour has always been to provide our clients and partners with meaningful products which capture a significant chunk of the market upside while limiting the downside risk. Thereby, providing positive risk-adjusted returns across market cycles.
Happy and Safe Investing!!
I n v e s t m e n t Philosophy
“Buy Right : Sit Tight” is the investment philosophy followed by the MOAMC which has been distilled from over 25 years of wealth creation.
Buy Right entails the following:
Q) Quality: Buying Quality businesses and management
G) Growth: Focus on Growth in earnings and sustained ROE
L) Longevity: Identify companies that have Longevity of competitive advantage or economic moat
G) Price: Buy good businesses at fair Prices rather than fair businesses at good prices.
This approach is called the Q-G-L-P approach to buying the right stocks.
Sit Tight can be split into 2 parts:
Buy and Hold: Stocks are bought with the intention of holding them for the long term. Buying the right business requires skill and holding onto these businesses through the entire growth cycle requires even more skill and patience.
Focus: The portfolios consist of high conviction stocks only with the number of stocks per portfolio not exceeding 20 – 25 stocks. While the stocks are well diversified across sectors & industries, over- diversification of the portfolio can result in dilution of returns for investors and increase in market risk.
Strategy Inception Date: Mar 24, 2003; The Above strategy returns are of a Model Client as on January 31st, 2016. An investment of Rs.1 crore made in this portfolio in March 2003 is worth Rs.18.56 crores as on January 31st, 2016. The same investment if made in the CNX Nifty is worth Rs.7.48 crores.
Scheme Name
Mid Cap Portfolio
CNX Midcap
1 year
1.13%
-4.99%
3 years
31.83%
14.24%
5 years
26.48%
9.49%
Since Inception
16.60%
4.86%
Scheme Name
Large Cap Portfolio
CNX Nifty
1 year
-14.35%
-14.14%
3 years
15.99%
7.82%
5 years
12.69%
6.55%
Since Inception
25.50%
16.94%
Strategy Inception Date: Dec 11, 2007; The Above strategy returns are of a Model Client as on January 31st, 2016. An investment of Rs.1 crore made in this portfolio in December 2007 is worth Rs.3.50 crores as on January 31st, 2016. The same investment if made in the CNX Mid Cap is worth Rs.1.47 crores.
Mutual Fund investments are subject to market risks. Investors are advised to read the o�er documents/scheme related documents and other risk factors carefully before investing in any scheme.
MUTUAL FUND AUTOMATED PORTFOLIO REBALANCING SYSTEM
MARSMARS
Give WINGS to your Investments...
Every investor while investing wishes to maximise his returns while minimising his risk. MARS (Mutual Fund Automated Portfolio Rebalancing System) tries to overcome these issues for investors whereby they can manage their asset allocation and invest in better performing schemes by the click of a mouse and maximise their returns. As the process is system driven and operationally smooth, it also helps weed out behavioural biases. MARS gives a wide array of portfolios to choose from to the investor based on his risk appetite and periodically triggers portfolio rebalancing based on deviations from the asset allocation of the model portfolio resulting in better returns to the investor over a period of time.
Disclaimer: This booklet named “Wealth Watch” prepared by NJ IndiaInvest Pvt. Ltd. (the “Wealth Watch”) is not for sale and is only for private circulation. This “Wealth Watch” is for reading & assistance purpose only and is not intended to be and must not be taken as the basis for any investment decision. Nothing in this “Wealth Watch” should be construed as investment or financial advice, and/or as an advice to buy or sell or solicitation to buy or sell the mutual funds / schemes covered in this “Wealth Watch”. The intent of this “Wealth Watch” is not in recommendary nature. NJ IndiaInvest Pvt. Ltd. has taken due care & caution in compilation of this booklet with the information being obtained from various sources. However, the “Wealth Watch” takes no responsibility or liability, expressed or implied, whatsoever for any investment decisions made or taken by the readers of this booklet based on its contents thereof. The readers are strongly advised to exercise due caution and/or verify the contents and/or seek independent professional advice before making any investment or any other decision based on any content, information, analysis, statements, opinions expressed or implied, in this “Wealth Watch”. The “Wealth Watch” does not make any gaurantees or warranties whatsoever, expressed or implied, regarding the completeness, timeliness, accuracy, adequacy, fullness, reliability, functionality, and/or the reliability of the information, statistics, statements, opinions and materials contained or expressed in this “Wealth Watch” or the results obtained, direct or consequential, from the use of such information, statistics, statements, opinions and materials. Mutual Fund investments are subject to the market risks. Readers should read the offer document carefully before making any investment decisions. The past performance is for indicative purpose only and is not necessarily a guide to the future performance of the funds. Reproduction of this publication in any form or medium by any means without prior written permission of the publishers is strictly prohibited. All disputes shall be subject to Surat Jurisdiction only. All rights reserved.
You can send in your queries and feedback at [email protected] mentioning your name & city.


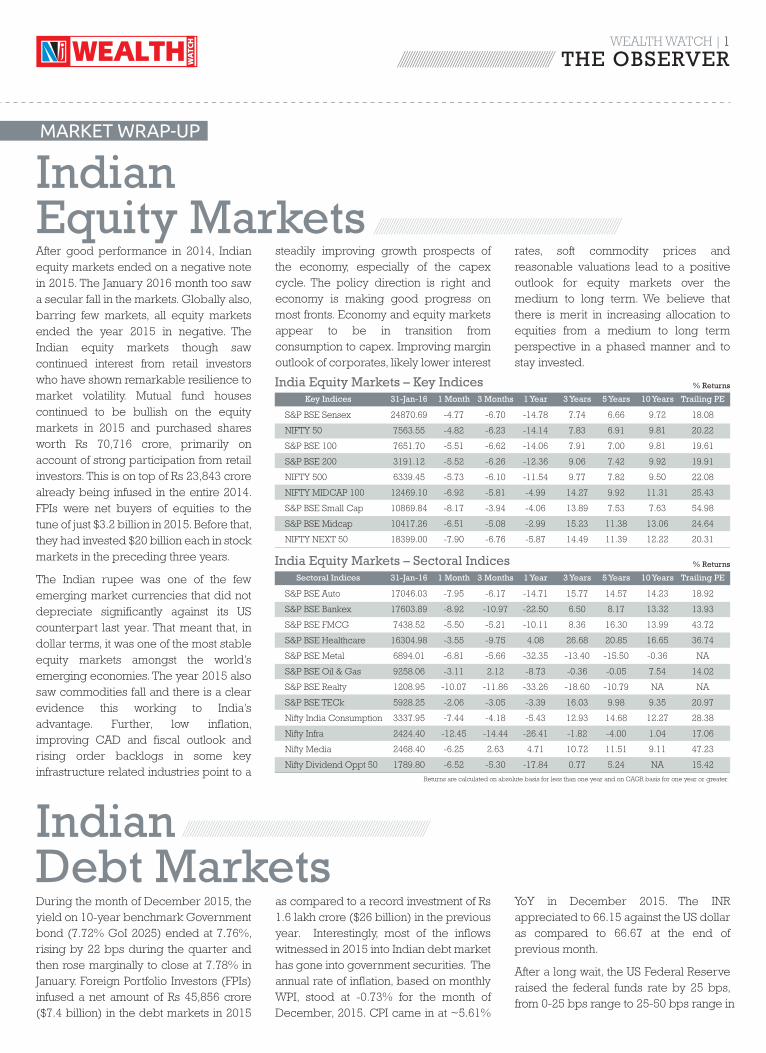


![CHAPTER-1 WHO IS KETAN PAREKH?docshare01.docshare.tips/files/21046/210466680.pdf · 2016. 6. 22. · Ketan Parekh [KP] was a chartered accountant by profession and used to manage](https://static.documents.pub/doc/80x56/61493820080bfa626014783a/chapter-1-who-is-ketan-parekh-2016-6-22-ketan-parekh-kp-was-a-chartered.jpg)


