Page 1
WEAR DETECTION IN TRIBOLOGICAL SYSTEMS BASED ON
ACOUSTIC EMISSIONS
Gabriel Stadler1, Philipp Bergmann
2, István Gódor
3, Florian Grün
4
1, 2, 3, 4Chair of mechanical engineering, Montanuniversität Leoben, A;
[email protected]
1. INTRODUCTION
Novel environmental laws force technical companies to reduce CO2
emissions in their manufactoring process and products. In the automotive sector
may this be done by lightweight constuctions or the increase of efficiency in energy
transfer [1]. New engine process technologies like “start-stop”, higher ignition
pressures and operation temperatures raise the efficiency level but lead also to a
higher wear rates of ICE1-components. In order to deal with this problems, the most
concerned parts, a large share are found in tribological systems, need to be taken
under examination. Tribological systems consist basically of two surfaces in
relative motion, supported by lubrication. Such systems can be found in ICE, gear
couples, generators and other moving machine parts. To describe them theoretically,
several mathematical methods, material parameters and operation diagrams are
used. One of the most important graphs to show the frictional interaction between
liquid lubricated sliding partners is the “Stribeck curve”, see figure1, plotting the
COF2 against speed. This curve illustrates the liquid lubricated sliding process at
different interaction stages. The three main stages are: solid friction (I), mixed
friction (II) and lubricant friction (III). In the first stage (I) the high friction
coefficient results from solid interactions like interlock or welding. In the second
area (II) liquid lubricant gets between the surfaces and starts to separate them
partially, reducing the COF. In the last stage (III) the surfaces are fully separated
with a continuous lubrication film between the surfaces. The COF starts to rise
again, due to rheological friction at higher speeds.
1 ICE=internal combustion engine
2 COF=coefficient of friction
MultiScience - XXX. microCAD International Multidisciplinary Scientific ConferenceUniversity of Miskolc, Hungary, 21-22 April 2016, ISBN 978-963-358-113-1
DOI: 10.26649/musci.2016.085
Page 2
Speed [rpm]
I
II
III
COF,µ [-]
Fig. 1
Stribeck curve
Conventional engines start runs from the left side along the curve till it reaches the
area of operation in the liquid friction stage. At this area the system is running with
low friction and hardly any wear. As illustrated in figure 1, the main area for start
stop is below this point in the mixed lubrication stage with higher friction and wear.
In order to investigate the interaction between two sliding surfaces under such
conditions, analogous models are used. For research applications, small specimens
with structures of practical components are tested because they can be handled
easier than whole components and deliver concentrated information about the
material interaction in tribological system. Especially for the pair, shaft and journal
bearing, different test methods are available. Two test methods which allow detailed
investigations are developed at AMB3 and described in the following. Additional to
the existing measurement parameters a novel parameter the acoustic emissions are
recorded and interpreted with mathematical methods.
2. TEST METHODS
These methods to analyze the tribological systems are on the one hand “ring
on disc“-setup (see figure 2) and on the other test with journal bearing adapters. The
ring on disc which is set up on a rotationary tribometer TE92 from Phoenix
Tribology, uses a steel disc, coated with a soft bearing material and a ring made of
steel representing the crankshaft. The disc is fixed at the bottom of a vertical shaft
which is driven by an electrical motor via a V-belt. The ring is inlaid in a pot filled
with oil, which is located on a crosshead (Fig. 2). A bellow moves the pot upwards
3 Chair of Mechanical Engineering, Montanuniversität Leoben
operating area
start-stop area
Page 3
and develops a normal load between the ring and disc. Due to the relative rotation
between the two components friction sets in.
Fig. 2
Ring on disc test rig
This test set up focuses on the material interaction between the friction partners (e.g.
journal bearing- crankshaft) and lubricants. The input parameters are the normal
load (FN), system temperature (T2), and the rotational speed (n), shown in figure 3.
Input parameter variations allow the realization of different test modifications, like
temperature test or wear test. Figure 3 depicts exemplary a wear test with firstly a
running in phase allowing both surfaces to reach a energy optimized state and
increasing load stepwise until the system collapses.
Time
T2, F
N, n
n FN T2
Running in
Fig. 3
Input parameter
normal load
rotation
disc ring
AE-
Sensor
pot
Page 4
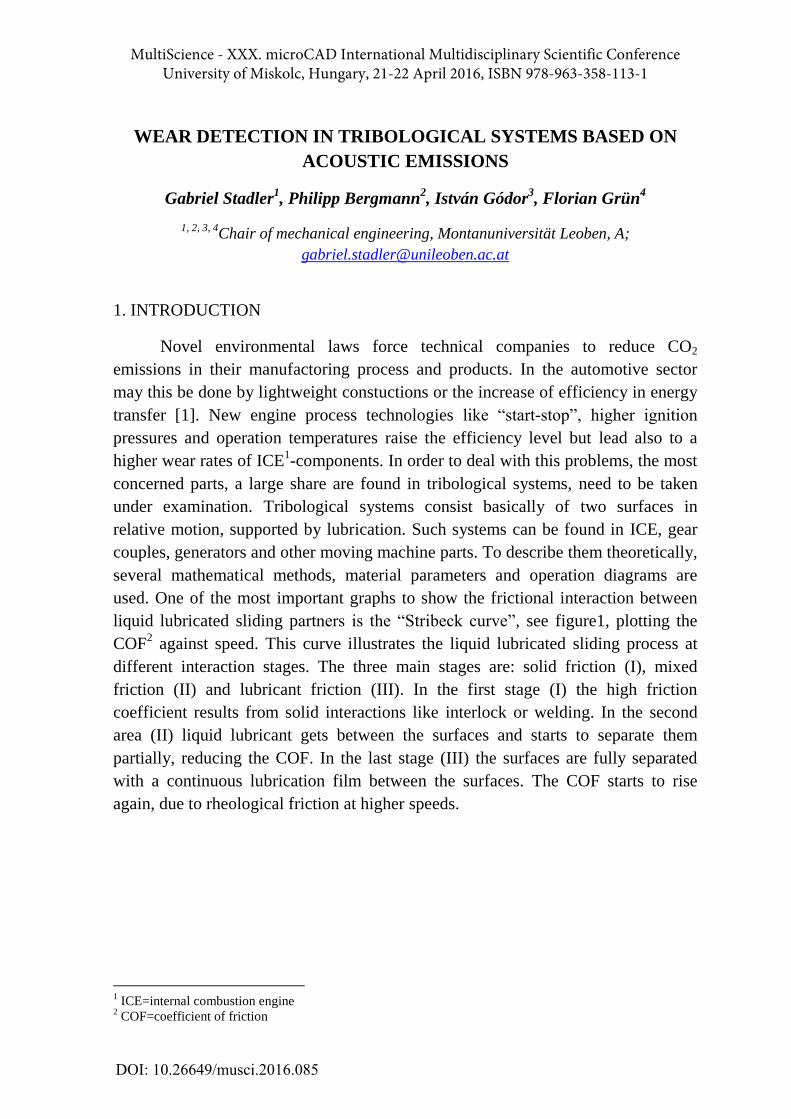
The result from such a test is a graph with different measurements (see figure 4).
The normal load is measured with a load cell between the bellow and the pot. It’s
denoted in Megapascal (MPa), because the load is related to the normalized contact
area. Two temperatures are detected, a near-contact (T1) and a system temperature
(T2). The friction coefficient can’t be measured directly, but is calculated from the
normal load and the resulting frictional moment. The state of friction is measured
via the contact potential which is realised with an electrical flux through these two
parts. If they are separated by lubrication, the resistance between both surfaces rises
and increases the contact potential. In the case of solid contact the contact potential
drops. Consequently this is an indicator to estimate the moment when solid friction
and as a result wear occurs. The measurement of the wear rate is determent with
electrical induction.
Fig. 4
Test data graph from ring on disc
A typical graph for a wear test shows that the contact potential starts at a
certain level and drops shortly before the wear rate starts to rise. The system
temperature and the contact temperature are increasing constantly during the whole
test time due to heating up caused by friction losses. The coefficient of friction
decreases in the first part by the reason of surface adjustment and shows an unstable
behaviour when wear occurs, due to the continuous changing surface conditions.
This kind of test result is used to determine seizure load limits. The journal bearing
test method was developed on a rotationary tribometer TE92 HS with the main
difference of a directly driven shaft. The shaft specimen made of steel is directly
Steel
Contact Potential
Temperature 1 Temperature 2
Normal Load
COF
Wear rate
Page 5
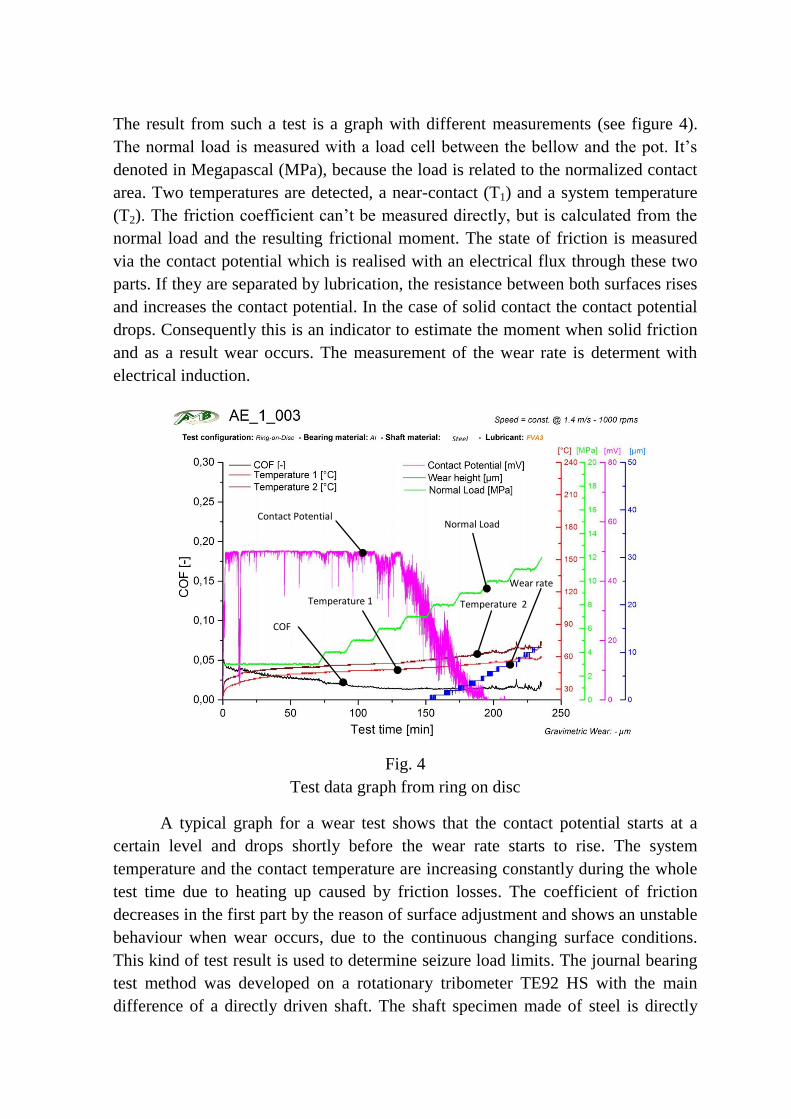
mounted on the drive shaft. The bearing shells are hold in a journal bearing adapter.
The two shells are pushed against the shaft sample via a bellow and set of levers
(Fig. 5). One main advantage is the direct driven shaft, which allows it to realize
“start-stop cycles”.
Fig. 5
Journal bearing adapter
This method uses specimens with practical shape. So they are one step closer to real
components, but keeping the possibility of good measuring. The focus of this test is
to investigate the behaviour of the whole system. The input- and output parameters
are the same as the ring on disc method (Fig. 3) delivers respectively needs. A
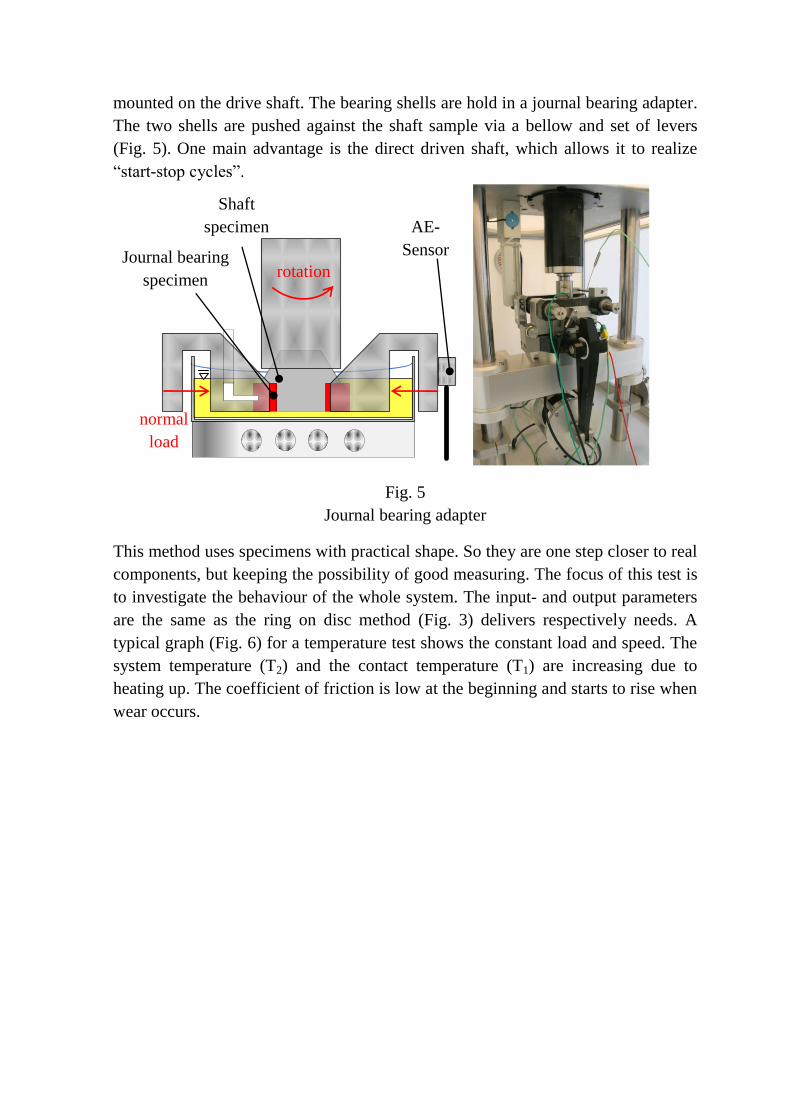
typical graph (Fig. 6) for a temperature test shows the constant load and speed. The
system temperature (T2) and the contact temperature (T1) are increasing due to
heating up. The coefficient of friction is low at the beginning and starts to rise when
wear occurs.
rotation
normal
load
AE-
Sensor
Journal bearing
specimen
Shaft
specimen
specimen
Page 6
Fig. 6
Test data graph from journal bearing adapter
Additional to the existing test parameters a novel measurement variable, the
acoustic emissions have been introduced which lead to promising results in
available literature [2, 4, 5]. To lead the possibilities of this measuring method, test
in ROD and JBA configuration were conducted. The material configuration for both
test methods are aluminium based bearing materials in combination with a typical
crankshaft steel. The ring on disc test uses mineral oil (FVA 3) lubrications. The
regarded test is a wear test with a stepwise increasing load after a running in part
(figure 3). The speed and the temperature are kept at a constant level. The viewed
test with the journal bearing adapter ran at a constant speed and load level. After a
running in phase, the system is heated up while keeping the other parameter
constant. This test uses also mineral oil (Shell Rimula) lubrications.
4. ACOUSTIC EMISSION
Acoustic emissions occur in every dynamic system. Mainly machine
elements, like gear couplings and ball bearings are producing characteristic
structure-borne sounds but also frictional systems emit detectably acoustic waves
[2, 6]. Due to the interactions between frictional partners, the amplitudes of the
waves and their frequencies are changing during the operating stages. The lubricant
Contact Potential
Temperature 1
Temperature 2
COF
Normal Load
Steel
Page 7
friction stage emittes a low rate of acoustic emissions because of the impedance and
the damping effect from the oil. Another point is that no transversal waves can be
transmitted in liquids. Partial solid contact increases the friction and the amplitudes
of the AE signal [2]. The contact of asperity summits, slip-stick effects and weld
surfaces are reasons for this higher AE response. Modern measurement systems
allow detecting such waves and converting it into a usable signal. The
transformation from an ultrasonic structure-borne noise to an electrical signal
happens in an AE Sensor based on the “piezzo effect”. The resulting signal is
transmitted by wire to an amplifier with integrated filter. Further it’s send to an
analogue-digital-converter (AD converter) to get a processable signal for the
computer. The main advantage of this method is to detect frictional wear, even if a
measurement of conventional parameters is impossible. Another benefit is that it
can be installed at sealed systems with no entry to the operation space. So it can be
installed at different test rigs easily. But several aspects need to be considered to
ensure a reliable measurement. In order to satisfy the Nyquist–Shannon sampling
theorem, it’s necessary to sample with the double frequency of the upper level from
the band pass filter. The signal intensity is reduced from the friction area to the
sensor due to the specific impedance of steel. Also the quantification from the
analogue digital converter (16 bit) needs to be considered. The detection range for
this application is located between 0 and 1 MHz. The sensor exhibits its highest
sensitivity between 50 and 400 kHz. The sampling rate of 2 MHz causes a high
amount of data per sampling, which makes it necessary to trigger data storage at
specific times.
5. DEVELOPMENT OF THE METHODS
The following methods are developed by using the acoustic emission signal
gathered during the wear test depicted in figure 4. The electrical signal is a
quantitative, noisy signal. In order to get useful information, the whole signal needs
to be filtered. A common filter for smoothing waves, based on a polynomial
regression, is the “Savitzky-Golay-Filter” [3]. This filter uses a polynomial function
with a certain order in given points, to smooth the curve between them. Figure 7
depictes the filterd and original signal starting at a time of 120 minutes until the test
end. In the phase of stabile contact potential the acoustic emissions show low
amplidudes. At the point of wear start the intensity of the original and filtered signal
rises.
Page 8
Filtered signal
120 140 160 180 200 220
Test time [min]
0.14
0.12
0.1
0.08
0.06
0.04
0.02
0
-0.02
-0.04
Vo
lta
ge
[V
]
original signal filtered signal
5.1 SPECTRAL ANALYSIS
During a test run, a certain range of frequencies is activated. FFT transforms
the time dependent signal into a frequency spectrum which can be used
subsequently to perform spectral analysis. The sequence of the time dependent
frequencies spectra results in a waterfall chart (Fig. 8). This chart shows the change
of excited frequencies during the test. An intensity change in a frequency area 50-
400 kHz can be observed at a start of wear at approximately 150 minutes.
Spectrum
0
50 1
00 150
200
250
Test time [min]Frequency [Hz]
0 0.1 0.2 0.3 0.4 0.5 0.6 0.7 0.8 0.9 1
110
100
90
80
70
60
50
40
30
20
10
Am
plit
ud
e [
dB
]
x10^6
Filtered Signal Original Signal
Fig. 8
Diagram of a spectrum
Fig. 7
Difference between original and filtered signal
Page 9
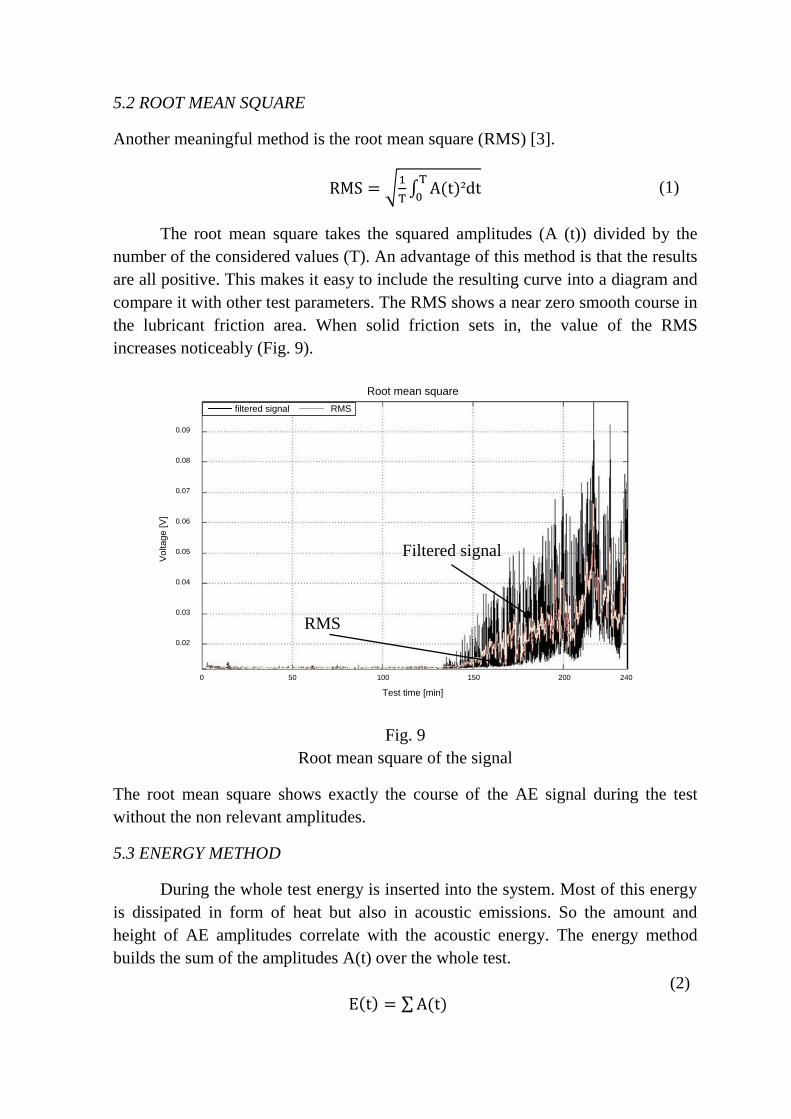
5.2 ROOT MEAN SQUARE
Another meaningful method is the root mean square (RMS) [3].
The root mean square takes the squared amplitudes (A (t)) divided by the
number of the considered values (T). An advantage of this method is that the results
are all positive. This makes it easy to include the resulting curve into a diagram and
compare it with other test parameters. The RMS shows a near zero smooth course in
the lubricant friction area. When solid friction sets in, the value of the RMS
increases noticeably (Fig. 9).
Root mean square
0 50 100 150 200 240
Test time [min]
0.09
0.08
0.07
0.06
0.05
0.04
0.03
0.02
Vo
lta
ge
[V
]
filtered signal RMS
Fig. 9
Root mean square of the signal
The root mean square shows exactly the course of the AE signal during the test
without the non relevant amplitudes.
5.3 ENERGY METHOD
During the whole test energy is inserted into the system. Most of this energy
is dissipated in form of heat but also in acoustic emissions. So the amount and
height of AE amplitudes correlate with the acoustic energy. The energy method
builds the sum of the amplitudes A(t) over the whole test.
(1)
RMS
Filtered signal
(2)
Page 10
The result is a representative pseudo energy E(t). Therefore the raise of this curve
depends on the amount and value of amplitude peaks in a certain time section. If the
curve raises very fast, a huge amount of peaks with a high value occur (Fig. 10).
„Energy“
0 46 92 138 184 230 276
Test time [min]
12
10
8
6
4
2
0
Vo
lta
ge
[V
]x10^4
Sum of amplitudes
Fig. 10
Sum of the amplitudes
The rise of the curve represents the intensity of wear. In this case there is a viewable
difference at the moment when solid friction occurs and wear starts.
6. DISCUSSION AND CONCLUSION
The AE show a strong correlation between COF and occurring wear. The developed
methods deliver valuable information about the tribological behaviour. Especially
the RMS is suitable for the direct implementation in-situ supervision of tribological
systems, see figure 11. This is showing the RMS of the AE implemented in the
measuring graph of the conducted seizure limit load test.
Steel
Fig. 11
Test data graph (ring on disc incl. AE-signal)
AE Signal
Page 11
The AE curve from the ring on disc test shows a comparable raise with the wear
rate and a correlation between the AE signal and the coefficient of friction. One
result of this graph is that the AE signals conditioned by friction. Additional the
response of the signal is higher than the others and so it’s a usable source to
evaluate friction.
Fig. 12
Test data graph (journal bearing incl. AE-signal)
Having a look at the measure graph form the JBA and the included a similar
behaviour to the ring on disc test may be seen (Fig. 12). The essential message is
that the two test modifications deliver the same trend referring to friction
respectively wear and underline the usability of AE to characterise tribological
systems. The spectral analysis shows that several specific frequencies between 50-
400 kHz are activated and change during the test. This method is promising for
future work. The resulting graph of the energy method turns out to a helpful
variable to evaluate wear intensity. The graph (Fig. 10) shows, that the amount of
inserted energy, increases significant at the moment when solid friction and wear
occurs. AE signals from the tribological test deliver new infomation to describe
such a system. The analysis methods are useful for different considerations of
friction and wear. In the future the signals may be used to characterise the wear,
detect mixture friction earlier or to control the test.
AE Signal
AE Signal
Steel
Steel
Page 12
7. ACKNOWLEDGEMENT
Financial support by the Austrian Federal Government (in particular from
Bundesministerium für Verkehr, Innovation und Technologie and
Bundesministerium für Wissenschaft, Forschung und Wirtschaft) represented by
Österreichische Forschungsförderungsgesellschaft mbH and the Styrian and the
Tyrolean Provincial Government, represented by Steirische
Wirtschaftsförderungsgesellschaft mbH and Standortagentur Tirol, within the
framework of the COMET Funding Programme is gratefully acknowledged. In
addition the authors are deeply grateful to the company partner Miba Gleitlager
GmbH for their support.
8. REFERENCES
[1] PROFF, H.; PASCHA, W.; S SCHÖNHARTING, J.; SCHRAMM, D.:
Schritte in die künftige Mobilität, 2013, ISBN 9783834943071
[2] BURGER, W.; ALBERS, A. ; NGUYEN, H. T.: Reducing power loss of
hydrodynamic journal bearing by means of condition monitoring and
automatic lubrication flow control. - 18 th international colloquium
tribology –TAE
[3] SOPHOCLES J. ORFANIDIS.: Introduction to Signal Processing, 2010
[4] RASTEGAEV, I.; MERSON, D.; VINOGRADOV, A.: Enhancement of
efficiency of tribological testing by using acoustic emission
measurements. -Journal of AE, Volume 32/2, - AEWG, 2013. p. 597 – 603
[5] CHACON, J. L. F.; KAPPATOS, V.; BALACHADRAN, W.; GAN, T.-H.:
A novel approach for incipient defect detection in rolling bearings using
acoustic emission technique. – Applied Acoustics 89, 2015. p. 88 – 100. –
ISSN 0003–682X
[6] ZELLER,P.: Handbuch Fahrzeugakustik, 2012, ISBN 9783834886576


![The tribological wear behavior of carbon fabric …web.iyte.edu.tr/~gokhankiper/ISMMS/Sahin2.pdfsignificant factor affecting the wear behavior of polymer composites [25]. Tribological](https://static.documents.pub/doc/80x56/5ea8bfebf651c53b782484dd/the-tribological-wear-behavior-of-carbon-fabric-webiyteedutrgokhankiperismms.jpg)


![Investigations on Mechanical and Tribological Behaviour of ... › pdf › JMMCE_2013072317260956.pdffatigue and microcracking [6]. Wear is defined as damage to a solid surface, generally](https://static.documents.pub/doc/80x56/60b8643c907453512948938b/investigations-on-mechanical-and-tribological-behaviour-of-a-pdf-a-jmmce.jpg)