AD-AZU4 tUiu WEAR MECHANISM EVALUATION • AND MEASUREMENT IN FUEL-LUBRICATED COMPONENTS INTERIM REPORT ELQC" , BFLRF No. 286 SEP 2 8 1994 . F By P.I. Lacey Belvoir Fuels and Lubricants Research Facility (SwRI) Southwest Research Institute San Antonio, Texas 'Jnder contract to U.S. Army TARDEC Mobility Technology Center-Belvoir Fort Belvoir, Virginia Contract No. DAAK70-92-C-0059 Approved for public release; distribution unlimited September 1994 944
P.I. LaceyBelvoir Fuels and Lubricants Research Facility (SwRI)
Southwest Research InstituteSan Antonio, Texas
'Jnder contract to
U.S. Army TARDECMobility Technology Center-Belvoir
Fort Belvoir, Virginia
Contract No. DAAK70-92-C-0059
Approved for public release; distribution unlimited
September 1994
944
Dieclaimers
The findings in this report are not to be construed as an official Department of theArmy position unless so designated by other authorized documents.
Trade names cited in this report do not constitute an official endorsement or appro-val of the use of such commercial hardware or software.
DTIC Availability Notice
Qualified requestors may obtain copies of this report from the Defense TechnicalInformation Center, Cameron Station, Alexandria, Virginia 22314.
Disposition Inmructions
Destroy this report when no longer needed. Do not return it to the oriSinator.
REPORT DOCUMENTATION PAGE mo ppoeFOUB No. 07'04-18
Publo reporting burden for this oollection of Information Is atihated tr eve,'age 1 hour per rr,sona, induding the "me for reviewing instruction, earchng existing data souroes, gatheringand m&aWManqM the clta needed, and oompleting and reviewing the oollection of information. Send ommants reg•rding this burden estimate or any other aspect of this olke-lion ofInfortmation, Inoiuding suggoestIOn f#0 reducing this burden, to Washington Hea'quArters SerMOie, Directorae for Infonatior. ,perstions and Rapofto, 1215 Jefferson Davis Highway, awe1.04, A,•ing, VA 202-4302, and to ft Offic of Management and Sudget, Paperwork Redhcion Proec (0704-01 ), Washington, DoC 2053.
1. AGENCY USE ONLY (Leave blank) 2. REPORT DATE 3. REPORT TYPE AND DATES COVERED
Submitted 1994 Jan InterimIssued 1994 Sep Jan 92 to Sep 93
4. TITLE AND SUBTITLE 5. FUNDING NUMBERS
Wear Mechanism Evaluation and Measurement in Fuel-Lubricated Components (U) DAAK70-87-C-0043; WD 18
., AUTHOR(S) DAAK70-92-C-0059; WD 10
Lacey, Paul I,
7. PERFORMING ORGANIZATION NAME(S) AND ADDRESS(ES) 0i. PEAPORMING ORGANI7ATIONREPOPT NUMBER
Belvoir Fuels and Lubricants Research Facility (SwRI)Southwest Research InstituteP,O. Drawer 28510San Antonio, Texas 78228-0510 BFLRF No. 286
9, SPONSORINQ/MONITORING AGENCY NAME(S) AND ADDRESS(ES) 10. SPONSORING/MONITORINGAGENCY REPORT NUMBER
Department of the ArmyMobility Technology Center-Belvoir10115 Grldley Road, Suite 128Ft, Belvoir, Virginia 22060-5843
11. SUPPLEMENTARY NOTES
12a. DISTRIBUTIONIAVAILABILITY STATEMENT 12b. DISTRIBUTION CODE
Approved for public release; distribution unlimited
13. ABSTRACT (Maximum 200 words)
Previous studies have demonstrated that the durability of some fuel injection systems on compression-ignition engines will be adverselyaffected by fuels of sufficiently low lubricity, However, no widely accepted lubricity measure is available; indeed, the wear mechanismspresent have not been conclusively defined, The results of the present study indicate that oxidative corrosion is the predominantmechanism with very highly processed fuels, resulting in catastrophic wear and rapid failure, A laboratory test procedure directed towardthe oxidative wear mechanism was evaluated and a number of modifications suggested.
Two closely related laboratory wear test procedures that rely on the transition from mild boundary lubricated wear to adhesive scuffingwere also developed. The resulting procedures allow the fuels to be either ranked using a continuous scale or separated using a simplepass/fail criteria. All the procedures are sensitive to the addition of trace quantitiesof lubricity additives and show directional correlation with refinery severity, as mt-asured by sulfur and aromatic content. As a result, thetests produced excellent correlation with full-scale equipment tests performed at a number of locations, as well as the criteria necessary foroxidative corrosion. However, the scuffing load tests show greatly increased separation between good and unacceptable fluids comparedto the oxidative corrosion tests. Evaluation of commercially available fuels indicates that fuel lubricity is decreasing and that very poorlubricity fuels are occasionally observed.
17. SECURITY CLASSIFICATION 18, SECURITY CLASSIFICATION 19, SECURITY CLASSIFICATION 20, LIMITATION OF ABSTRACTOF REPORT OF THIS PAGE OF ABSTRACT
Unclassified Unclassified Unclassified
NUN 7540-01-280-5500 QStandard Form 298 (Rev. 2-19)PrsortI e by/ NII Md. Z10.1
EXECUTIVE SUMMARY
Problems and Oblectives: To reduce its logistics burden, the U.S. Army is using aviationturbine fuel in compression ignition-powered vehicles, Similar fuels are commonly used in arcticconditions, with no apparent durability problems. However, previous full-scale pump stand tests,as well as field experience gained during Operation Desert Shield/Storm, indicate that severewear is produced with neat Jet A-I fuel. Wear rate was reduced by addition of a corrosioninhibitor. However, it was believed that wear mechanisms other than oxidative corrosion, suchas mild scuffing, were also involved. The objective of the work contained in this report is todefine the mechanisms present and develop accurate laboratory-scale wear tests to evaluate theirseverity.
Imvortance of Proiect: Fuel injection system durability is highly dependent on fuel lubricity,which is decreasing. However, the wear mechanisms and lubricity requirements of fuel-lubricated components are only partially defined. As a result, no minimum fuel lubricity standardexists, and the limitations of lubricity additives under adverse conditions are unknown.
Technical Airoach: Full-scale pump stand tests were performed under conditions of controlledhumidity to define the relative importance of oxidative corrosion and adhesive wear. Themeasured wear was then correlated with nonstandard BOCLE tests, as a function of humidity andapplied load. The laboratory wear test data were also compared to independent test data providedby equipment manufacturers.
Accomplishments: The availability of moisture is a predominant variable controlling the onsetof severe wear with low-lubricity fuels that are susceptible to an oxidative corrosive materialremoval mechanism. This wear process may be effectively controlled by use of corrosioninhibitors and evaluated using the ASTM standard BOCLE test. However, long-term pumpdurability in the absence of oxidative wear may be affected by other fuel attributes, such asadhesive wear resistance. As a result, several laboratory wear tests that model scuffing loadconditions were also developed and evaluated using a wide range of fuel compositiors. Thescuffing load tests provide improved discrimination between good and unacceptable lubricityfuels and excellent correlation vith full-scale equipment for fuels above a critical minimumviscosity.
Military Impact: The results of this study confirm that use of highly refined Jet A- 1 in atemperate climate will produce very rapid wear of rotary fuel injection pumps. Use of Jet A-Iin very cold conditions is less likely to produce severe wear, possibly due to reduced moisturecontent in the fuel. Use of JP-8 will reduce wear, although long-term durability and maximumpower output are likely to be lower than with DF-2. Aviation turbine fuels that have acceptableboundary lubricating characteristics may promote increased wear due to their low viscosity. Thelubricity of low-sulfur, low-aromatics fuels is also marginally lower than that of conventionalhigh-sulfur fuel. However, the effect of this decrease on equipment durability has not beendefined. Lubricity additives significantly reduce scuffing wear, particularly when used at highconcentrations (>200 ppm). , • I
iii
FOREWORD/ACKNOWLEDGMENTS
This work was performed by the Belvoir Fuels and Lubricants Research Facility (BFLRF) at
Southwest Research Institute (SwRI), San Antonio, TX, under Contract No. DAAK70-87-C-0043
for the period January 1992 through September 1992 and Contract No. DAAK70-92-C-0059 for
the period October 1992 through September 1993. Work was funded by the U.S. Army
TARDEC, Mobility Technology Center-Belvoir (MTCB), Fort Belvoir, VA, with Mr. T.C. Bowen
(AMSTA-RBFF) serving as contracting officer's representative. Project technical monitor was
Mr. M.E. LePera (AMSTA-RBF) of MTCB.
The author would like to acknowledge the efforts of BFLRF personnel, incluciing Messrs. D.M.
Yost and S.R. Westbrook, who provided much advice and technical assistance; R.E. Grinstead,
who provided fuel injection pump expertise and conducted the pump stand experiments; and
J.J. Dozier, who performed the bench wear tests. The author also acknowledges the editorial
assistance provided by Mr. J.W. Pryor, Ms. M.M. Clark, and Ms. L.A. Pierce in the preparation
of this report. Stanadyne Automotive Inc. and Robert Bosch, GMBH and ARCO Alaska, Inc.
provided much of the data presented in Figs. 3, 7, 15, and 16. Finally, the author would like to
thank the Southwest Research Institute Advisory Committee for Internal Research for financial
assistance that allowed development of the test surfaces detailed in Appendix J.
Accesion For
NTIS CRA&IDTIC I1Al.*,
jlmtiflcic sl ......... . .......
By ........... .... ...... ... ........... ..Distr ib tion /
AvjzilKJb)kiVL ("Odes
Avail o i( 1/ orDist Spial
Av-)
iv
TABLE OF CONTENTS
Section Pal.
I. INTRODUCTION .. .......................................... 1
II. OBJECTIVE............................................... 2
M . BACKGROUND ........................................... 2
IV. TECHNICAL APPROACH .................................... 5
A. Full-Scale Pump Stand Tests ............................... 5B. Laboratory W ear Tests .................................. 7
V. EVALUATION OF OXIDATIVE CORROSION ..................... 8
A. Previous W ork ........................................ 8B. Evaluation of Oxidative Corrosion in the Full-Scale Pump ......... 11C. Evaluation of Oxidative Corrosion in the BOCLE ............... 14D. Evaluation of a Revised BOCLE Wear Test at High Humidity ....... 18
VI. DEVELOPMENT OF A SCUFFING-LOAD WEAR TEST ............. 22
A. Need for a Scuffing Load Test ............................. 22B. Development of a Scuffing Test Using the BOCLE .............. 24C. Test Results ..... .................................. .. 29D. Correlation of Procedure D With Full-Scale Pump Results ......... 33E. Comparison and Correlation Between Scuffing Load Tests ......... 35
VII. DISCUSSION ............................................. 38
VIII. CONCLUSIONS ........................................... 44
IX. RECOMMENDATIONS ...................................... 46
X. LIST OF REFERENCES ........... ....................... 48
APPENDICES
A. Laboratory Test Conditions ............................... 51B. Summary of Full-Scale Pump Tests ......................... 55C. Pump Calibration Stand Results ............................ 69D. Wear Measurement and Pump Disassembly .................... 75E. Engine Test Procedure and Results ........................... 97F. Selected Fuel Characteristic Illustrations ...................... 107
v
TABLE OF CONTENTS (Cont'd)
G. Effects of Temperature on the BOCLE ........................ 113H. Results Obtained in Scuffing Load Tests ...................... 119I. Calculation of Hertzian Contact Diameter ..................... 125J. Characteristics of Test Surfaces .......................... 129K. Suggested Test Procedure for Measurement of Scuffing Load
Capacity Using the Ball-on-Cylinder Lubricity Evaluator(BO CLE) ........................................... 137
vi
LIST OF ILLUSTRATIONS
1 Wear Maps Plotted as a Function of Humidity and Applied Loadfor Jet A -1 .............................................. 10
2 Comparison Between Normalized BOCLE Results and Average WearMeasurements Taken From Components in the Full-Scale Pump ......... 12
3 Correlation Between BOCLE Wear Result Performed According toProcedure A and Refinery Severity as Measured UsingFuel-Sulfur Content ........................................ 15
4 BOCLE Wear Scar Diameter (Procedure A at 0, 10, and 100 Percent Rh)as a Function of Sulfur Content in Fuels 0 and P Varied UsingBatch Distillation ................................ 16
5 BOCLE Wear Scar Diameter (Procedure A at 0, 10, and 100 Percent Rh)as a Function of Sulfur/Aromatic Content in Fuels Detailed in TABLE 2 18
6 Comparison of Modified BOCLE Results at 100 Percent Humidity(Procedure B) With Maximum Acceptable Test Repeatability andReproducibility as Defined in ASTM D 5001 (Procedure A) ............ 19
7 Relationship Between Subjective Measure of Full-Scale Pump Wear andResults Obtained Using Procedures A and B With the Same Fuels ....... 21
8 Wear Maps Plotted as a Function of Sliding Speed and Applied Load ...... 239 Friction Traces Obtained During Scuffing Load Tests .................. 26
10 Variation in BOCLE Wear Scar Diameter as a Function of Time DuringTests Performed According to Procedure A With Test Rings ofDifferent Surface Finish ..................................... 26
11 Bearing Area Curves for Ring Specimens Used in Scuffing Load Tests,Plotted Using a Probabilistic X Axis ............................ 28
12 Effect of Surface Roughness on the Applied Load Required for the Onsetof Scuffing .............................................. 28
13 Effect of Refinery Severity on Scuffing Load Capacity Measured UsingProcedure D With Fuels From TABLE 2 ......................... 31
14 Sensitivity of Procedures A and D to Additive Concentration inISO PA R M .............................................. 31
15 Relationship Between Subjective Measure of Full-Scale Pump Wear andResults Obtained Using Procedure D With the Same Fuels ............. 34
16 Relationship Between Subjective Measure of Full-Scale Pump Wear andResults Obtained Using Procedure E With the Same Fuels ............. 36
17 Comparison of Scuffing Load Test Results With Fuels Detailedin TA B LE 2 ............................................. 37
vii
UST OF TABLES
TL& Ee
1 Fuel Injection Pump Code Sheet ................................ 62 Principal Characteristics of Fluids Used in Wear Tests ................. 93 Test Repeatability of Procedure D With Additized ISOPAR M ........... 32
viii
I. INTRODUCTION
Many fuels piovide a limited range of contact conditions in which successful lubrication is
possible and injection components on compression ignition equipment rely on the fuel to provide
the required lubrication. At present, both military and commercial fuel specifications are being
revised.1(Q)* This process may result in the production of more severely refined fuels, devoid of
the reactive components necessary for effective lubrication and wear prevention. Relatively little
research has concentrated on fuel-lubricated wear in ground vehicles. Lubricity additives are
available; however, no specification for minimum acceptable protection due to variation in
additive quality or concentration exists. The present report reflects a portion of the U.S. Army-
sponsored study to define the effects of highly refined fuels on injection system wear in ground
vehicles, The ultimate objective is to develop laboratory wear tests that may be used to screen
fuels and additives and assure acceptable products are procured for military use.
Effective laboratory wear test simulation of a real environment typically requires accurate
reproduction of the principal contact conditions, such as metallurgy, surface finish, lubricant
condition, geometry, and interfacial temperature.(U2) Other variables such as sliding speed and
contact load/pressure should also reflect the final application, However, in the present instance,
the objective is not to characterize a single contact, but rather to characterize the effects of a
given fuel on the range of injection systems within the military fleet. Moreover, the most
critically fuel-sensitive components are undefined, and it is likely that the relative importance of
the wear mechanisms in each contact will be influenced by both fuel viscosity and
composition.1,) As a result, the approach taken was to broadly define the wear mechanisms
present using wear maps and then develop laboratory tests that define the minimum acceptable
resistance to each mechanism.
A multitude of commercial wear test apparatus are available, in a range of configurations (..), and
the four-ball machine, Dennison Tribotester, Lucas Dwell Tester, and the Thornton Aviation Fuel
Lubricity Evaluator (TAFLE) have all been utilized with fuels.(6.) In the present study, test
procedures for the Ball-on-Cylinder Lubricity Evaluator (BOCLE) were developed, based on
* Underscored numbers in parentheses refer to the list of references at the end of this report.
I
wear mechanism data obtained using the Cameron-Plint test apparatus.(7&.) The resulting tests
provided excellent correlation with the wear observed in full-scale equipment for fuels above a
critical minimum viscosity. The BOCLE apparatus has the additional benefit of previous
application with aviation turbine fuels and widespread availability in the fuels industry.
ii. OBJECTIVE
The overall objectives of this project are (a) to better define the effects of low-iubricity fuels on
diesel injection system wear with particular reference to Jet A-l/JP-8, and (b) to develop bench
wear tests that reflect the wear mechanisms observed in full-scale equipment.
III. BACKGROUND
This report discusses a portion of the U.S. Army study to define the effects of highly refined
fuels on injection system wear. The study to date includes both full-scale pump stand tests, as
well as bench-scale wear test evaluation, resulting in a number of reports and publications.(7- 4)
As far as possible, this report follows the format of those eariler in the series, while providing
the minimum duplication of information necessary to remain complete.
The U.S. Department of Defense is moving toward the use of a single fuel on the battlefield W();
Jet A-1 (15) or JP-8 (L6) will be used in ground equipment, and widespread use of fuels not
meeting these specifications will be curtailed, This directive is currently being implemented, and
aviation kerosene accounted for approximately 21 percent of U.S. Army fuel procured during
financial year 1991*.0_7.) At present, the U.S. Army fulfills much of its remaining CONUS
requirements with commercial-type fuels meeting VV-F-800D.(18) However, the specification
defining commercial fuel is also being revised to reduce vehicle exhaust emissions. The
Environmental Protection Agency (EPA) has specified a maximum sulfur content of
* Total fuel procured includes DF-A, DF- 1, DF-2, JP-8, and Jet A-1. Note some kerosene fuel is used in aviationequipment rather than compression-ignition engines, which are the primary concern of the present study.
2
0.05 mass% for all on-highway fuel nationwide to be effective 01 October 1993. This fuel must
have a minimum cetane index of 40 or a maximum of 35 vol% aromatics. The California Air
Resources Board (CARB) mandates a more stringent requirement of 10 vol% aromatics, also
effective 01 October 1993. In Europe, sulfur content is limited to 0.3 mass% max and is
expected to fall to 0.05 mass% by 1996.
In each instance, the necessary reduction in sulfur content may typically be achieved using more
severe refinery processes, such as hydrogen treating. However, these processes may result in a
fuel devoid of reactive components necessary for effective lubrication and wear prevention.
Indeed, increased failure rates were reported for certain types of rotary fuel injection pumps
operating on Jet A-I during Operation Desert Shield/Storm, due in part to fuel lubricity.Q0., 11)
Similarly, very high fuel injection system failure rates have been reported in Scandinavia, due
to the commercial sale of highly refined low-sulfur fuels. As a result, a number of organizations,
including the U.S. Army and the International Organization for Standardization
(ISO1rC22/SC7/WG6), are attempting to define the minimum lubricity requirements of the diesel
fuel injection system.
Controlled full-scale equipment tests performed by individual participants under laboratory
conditions confirmed that the durability of the rotary injection pump system is highly dependent
on fuel lubricity. Most importantly, from a military perspective, severe wear was observed with
neat Jet A-i.(L) However, overall wear rate was successfully reduced by suitable lubricity
additives or improved metallurgy on critical components. DF-A, which is very similar to Jet A-i,
has been successfully used by the U.S. forces in Alaska for many years. Arctic diesel fuel
(DF-A) comprised approximately 5 percent of the total U.S. Army fuel consumption (DF-1, DF-2,
DF-A, JP-8, and Jet A-i) for FY91, 99 percent of which was used in Alaska. DF-1 fuel
accounted fur approximately 9 percent of total fuel usage.(1J7 The successful use of this fuel
in arctic conditions may be attributed to a number of conditions including cool ambient weather,
very low atmospheric moisture content, and occasional operation on good lubricity fuel.
Previous publications in the present study (7,§) have described the development and application
of a wear-mapping technique using the Cameron-Plint test apparatus. This apparatus provides
3
a leciprocating motion and a range of contact conditions appropriate to the injection Cystem.
Wear mechanism maps were developed in conjunction with wear rate maps to allow comparison
of the bcrh-scale wear tests with .he material rernoval processes observed in full-scale
applications. This technique delineated tlie principal wear mechanisms likely to exist at the
conditions present in various segments of the fuel injection syst-er.i. At lower loads, material
removal with fuels devoid of natural or artificial corrosion inhibitors was primarily described by
an oxidative wear mechanism. Regulation of either moisture or oxygen availability greatly
affected wear rate in laboratory tests under these conditions, However, the weak Andary and
surface oxide films pisent were easily removed, resulting in intermetallic adhesion and severe
scuffing at slightly higher loads. In this study, scuffing describes conditions of severe friction
and wear produced by welding of the subsurface material due to failure of the boundary film or
surface oxide layers.
Typical boundary lubricants at low loads consist of oxygenates, among which are those materials
based on dilinoleic acid specifically approved as boundary lubricating and vorrosion-inhibitor
additives. In contrast, antiwear and extreme pressure (EP) fuel compounds must provide a
boundary lubricating film stronger than the surface oxide layer they replace. As a result,
imperfect correlation exists between the wear rate under lightly loaded conditions and adhesive
wear resistance. Similarly, decreased moisture content may reduce wear under low loads, but
also decrease the scuffing load capacity of the fuel by eliminating the protective surface oxide
layer.
The surface oxidation mechanism has been widely observed in aviation equipment operating on
kerosene fuels and effectively controlled using corrosion-inhibitor additives. As a result, a
standard test procedure exists for the Ball-on-Cylinder Lubricity Evaluator (BOCLE), (ASTM
D 5001) (.9) referred to as Procedure A in the present work. (The principal test parameters for
the various wear-test procedures discussed in the present study are detailed in Appendix A.) This
tecbnique is commonly used by the U.S. Air Force to measure aviation turbine fuel lubricity and
is believed to correlate with lightly loaded aircraft fuel system components such as spool valves.
The lightly loaded Procedure A test corresponds closely to the mild wear portion of the wear
maps and primarily reflects the fuel's resistance to oxidative co'rosion. Previously, oxidation of
4
metallic contact surfaces was demonstrated to be a contributing wear mechanism in pumps from
compression-ignition equipment operating on very low lubricity fuel.Ql4) However, both
adhesive and fretting corrosion wear were also indicated, and the relative importance of each
mechanism was unclear (scuffing failure has also been reported on the highly stressed areas on
the teeth of aviation gear pumps). Finally, the wear maps indicate that the ASTM standard
BOCLE test alone (Procedure A) may not adequately consider the range of metallurgy, humidity,
and contact severity present in practical applications.(8)
IV. TECHNICAL APPROACH
The primary objective of this study is to develop a laboratory wear test that reflects the fuel
lubricity requirements of full-scale equipment. Two principal wear mechanisms have been
suggested. As a result, the work is separated into two distinct phases: a) evaluation and
development of a wear test for oxidative corrosion; and b) development of a wear test based on
the transition to adhesive scuffing.
However, the technical performance of the work is most easily separated as follows: a) full-scale
pump stand tests to define the predominant wear mechanisms; and b) development of bench-scale
wear tests that model these mechanisms. Brief summaries of the technical approach in both areas
follow. The bulk of the supporting full-scale equipment tests is provided in the appendices, with
the results discussed in the body of the text as required.
A. Full-Scale Pump Stand Tests
Pump tests were performed to define the effects of variables such as fuel moisture content,
temperature, and running-in on injection system wear. Detailed descriptions of these tests are
included in Appendix B. Unless otherwise stated, a standard and an arctic pump were tested
simultaneously using recirculated fuel. Five standard and three arctic pumps were procured. For
ease of reference, a code number was assigned to each pump, as described in TABLE 1. The
pumps were similar in configuration, but the arctic unit contained an improved metallurgy in
5
TABLE 1. Fuel Injeetion Pump Code Sheet
CodeNo. Pump Type Serial No. Model No. Condition
I Standard 5608689 DB2829-4524 Rebuilt2 Standard 5608690 DB2829-4523 Rebuilt
3 Standard 6627499 DB2829-4524 New4 Arctic 6624980 DB2829-4523 New
5 Standard 7136688 DB2829-4979 New6 Artic 6913740 DB2829-4980 New
7 Standard 7136689 DB2829-4979 New8 Arctic 6913741 "32829-4980 New
certain critical components. Pump Nos. 1 through 4 are identical to those used in Reference 3.
Pump Nos. 5 through 8 are very similar in configuration to the remaining units, but have slightly
different calibration, as described in Appendix C. Pump Nos. 1 and 2 were previously operated,
but were completely rebuilt to the manufacturer specifications using standard components. These
rebuilt pumps were used in particularly destructive tests, in which the use of new pumps could
not be justified.
Each of the tests was performed during regular 8-hour shifts, with a warm-up period of
30 minutes to attain the normal operating temperature of 79*C (175'F). Pump performance was
continuously monitored so that the test could be terminated prior to catastrophic failure. Samples
of the test fuels were drawn every 20 hours, and a BOCLE wear test performed to ensure that
lubricity was not affected by oxidation [fuel-oxidation reactions from oxygenated species (i.e.,
carboxylic acids, aldehydes, alcohols, etc.) that, because of their polar nature, act as good
lubricity agents]. Overall degradation in pump performance was defined by operating each unit
on an engine and a calibration stand, both before and after each test. Pretest and post-test
measurements were also taken with an unused pump to ensure that the test equipment was
6
self-consistent. Finally, each pump was completely disassembled, and qualitative and quantitative
wear measurements performed, with the results provided in Appendix D.
The pretest engine power for each of the pumps is plotted in Appendix E. Pump Nos. 1 through
4 produced approximately 10 percent higher maximum engine power than the remaining pumps
due to the difference in calibration. The engine power produced with Jet A-I (conforming to
ASTM D 1655) (15) in each of the new pumps is approximately 14 percent lower than with
diesel fuel (VV-F-800D) U8 oer the complete speed range. This result is in good agreement
with previous measurements with this type of pump.(g)
B. Laboratory Wear Teats
Laboratory wear tests were performed using the Ball-on-Cylinder Lubricity Evaluator (BOCLE)
and the Cameron-Plint test apparatus. A more detailed description of both apparatus may be
obtained in Reference 3. The Cameron-Plint test apparatus provides a reciprocating contact
geometry with a wide load range and so may be more suited to this application than the BOCLE
test. Howover, the majority of tests were based on the BOCLE, due to its widespread availability
a id its more accurately controlled test environment.
Initial testing concentrated on minor variations to the ASTM standard procedure (Procedure A):
fuel moisture content and temperature were adjusted to produce significantly improved correlation
with full-scale equipment. It is not suggested that each of the modified procedures should be
incorporated in the standard test. However, the improved correlation achieved by minor changes
in test parameters to better reflect full-scale operation indicates the similarity of the wear
mechanisms in each instance and the utility of the ASTM standard BOCLE test. Nonethelkss,
the results of this and preceding reports indicate that the oxidative corrosion tests defined in
Procedures A and B may only partially reflect the more highly loaded contacts present in some
fuel injection equipment. In addition, they provide poor discrimination between good and
unacceptable lubricity fluids. As a result, considerable emphasis has been placed on developing
alternate wear tests that reflect the scuffing load capacity of the fuel (Procedures C, D, E, and
F).
7
Both the full-scale and laboratory wear test procedures used the fuels detailed in TABLE 2. The
fuels were selected to provide widely varying lubricity characteristics and composition, while
reflecting fuel types likely to be procured around the world by the U.S. Army. The resulting data
base facilitated a broad comparison between the fuels as a function of composition and will also
be of interest to commercial users.
Fuels A, B, C, and F are identical to those used in References 7 through 14 and are also used
in the full-scale pump tests described in Appendix B. Fuels B and C consist of Jet A-1 (Fuel A)
with 15 mg/L DCI-4A and 71/227 mg/L BIOBOR-JF/FOA-15 added, respectively. Fuels G, H,
I, J, N, Q, T, U, V and W were provided by ISO/TC22/SC7/WG6 and have also been evaluated
by that group. Fuels N and Q are ostensibly similar unadditized Class 1 fuels from Scandinavia.
However, Fuel N provides a low BOCLE result and has uncharacteristically good wear properties.
As a result, it is likely that this fhel was inadvertently additized or contaminated. Fuels D, E,
0, P, R, and S are experimental, noncommercially available fluids produced by batch distillation
and were provided courtesy of ARCO Alaska, Inc. Fuel L is a standard calibration fluid for use
with diesel injection systems and contains an antiwear additive. Fuel W corresponds to Fuel J
clay treated according to ASTM D 3948. Fuel Y is a synthetic fuel from Canada.
V. EVALUATION OF OXIDATIVE CORROSION
A. Previous Work
Figs. la and lb are wear maps for AISI E-52100 steel lubricated with neat clay-treated Jet A-1
in a controlled test environment of air and nitrogen, respectively.(.) In each instance, the Y axis
is the ambient humidity in the test chamber, while the vertical axis reflects Archard's wear
coefficient, as defined in Reference 20. The lightly loaded region of the wear map is highly
dependent on the moisture content in the fuel, indicating an oxidati',e/corrosive material removal
process. This portion of the map was found to have good directional correlation with the
BOCLE.
8
TABLE 2. Principal Characteristics of Fluids Used In Wear Tests
Figure 4. BOCLE wear scar diameter (Procedure A at 0. 10. anl 100 ercent Rh) as afunction of sulfur content In Fuels 0 and P varied using batch distillation
16
decrease in the average wear scar diameter occurs during the initial reduction in sulfur content.
Directionally similar results have been observed with artificial sulfur additives (di-tert-butyl
disulfide) probably due to the elimination of a mild corrosive wear mechanism.(U) In the
presence of moisture, a further reduction in end point/sulfur content produced a dramatic increase
in wear rate for both fuels. However, with no moisture present, the wear rate remains low over
the complete end point range studied. The natural corrosion inhibitors in each fuel (not
necessarily sulfur) appear to be eliminated if the end point of the fuel is sufficiently low,
facilitating the severe oxidative/corrosive wear mechanism observed in the full-scale pump tests.
The wear mechanisms observed during the systematic treatment of Fuels 0 and P duplicate the
effects previously observed for the full range of fuels. No relationship is apparent between wear
rate and composition or humidity for fuels that contain a significant volume of reactive species;
however, if the refinery process is sufficiently severe, a sudden increase in wear rate occurs due
to an oxidative corrosion mechanism.
Nonstandard BOCLE wear tests were performed on fuels detailed in TABLE 2 to demonstrate
that the preceding relationship between refinery severity and oxidative corrosion holds for fuels
of varying composition. Once again, the tests were performed at relative humidities of 0 and
100 percent in addition to the ASTM standard conditions of 10 percent, with the results shown
in Fig. 5. The sulfur and aromatic contents of each fuel are also plotted to allow comparison
with the wear test data. Less refined fuels with a sulfur content above approximately 0.025
mass% have a relatively small BOCLE wear scar diameter of less than 0.62 mm in the ASTM
standard BOCLE test described in Procedure A. The BOCLE results for these fuels are almost
independent of both moisture and sulfur content. In contrast, more severely refined fuels produce
greatly increased wear and are highly sensitive to moisture. The relationship between moisture
content and wear rate is erratic for the most severely refined fuels, probably due to trace amounts
of contaminant not reflected by the very low sulfur level. Clearly, however, fuel lubricity and
resistance to oxidative corrosion are adversely affected by severe refinery treatment to reduce
sulfur and aromatic content.
17
1 -45
*100 % HumidityE 10 %Humid4ty
0.9 f 0 % Humidity 35
0.8 30
25~0.7/208
0.8 15
-J 10~S0.5
~5
0.4 0
Fuel
Figure 5. BOCLE weer scar diameter (Procedure A at 0. 10. and 100 Percent Rh) as afunctionof sulfur/aromatic content in fuels detailed ,n TABLE 2
As usual, tests with additized fuo.s were not included in Fig. 5. The addition of corrosion
inhibition and commercially available lubricity additives to severely refined fuels typically results
in a BOCLE wear scar between 0.55 and 0.6 num. This value is in general agreement with the
preceding results obtained with natural inhibitors. A single boundary additive containing more
reactive boron compounds has been shown to provide wear protection in addition to eliminating
corrosion, and it produces a wear scar diameter of less than 0.4 mnu (, which is similar to that
obtained for formulated engine oils.
0. Evaluation of a Revised BOCLE Wear Test at High Humidity
Preceding sections indicate that tht BOCLE diameter of 0.65 mm specified by the U.S. Air Force
(Q) approdnmates the elimination of natural and artificial corrosion inhibitors from the fuel. The
principal difficulty with the ASTM standard BOCLE test is the small separation 1between
acceptable and poor lubricity fuels. However, the results of the preceding section also indicate
that greatei separation may potentially be obtained by increasing the level of humidity in the test
cell. A more detailed evaluation of this approach follows. The effects of varying other test
parameters were also briefly evaluated with mixed results. For some fluids, oxidative wear was
emphasized by decreasing the applied load and speed, although the improvement was not
universal, Clearly, a more detailed evaluation of the remaining test parameters is also required,
but is beyond the scope of the present work.
The repeatability of the ASTM standard BOCLE test (Procedure A) was originally verified using
a round-robin evaluation. That work indicated that tests performed at 10 percent humidity had
better precision than those at 50 percent humidity.(22) However, it is unclear if the decreased
accuracy outweighs the benefits achieved due to increased separation of the test results. Initial
repeatability tests in the present study were performed at a test humidity of 60 percent to prevent
formation of condensation in the test reservoir, However, reproducibility was decreased, possibly
due to inaccuracy of the humidity meter on the BOCLE apparatus. Subsequent tests were
performed under saturated atmospheric moisture conditions (Procedure B; 100 percent relative
humidity), thereby eliminating the requirement for humidity measurement. The results are shown
1.1 -.
1 i... ReproducibilityI'" .S/ - ,, t ."/
IE 0.8 ASTM SpecifiedS0.7 Limits // -
0.6o' / •. ,
~0.5 -
0.4
0.3 Laboratory "A"0.2 ./d" Laboratory "B"I
0 0.1 0.2 0.3 0.4 0a5 0.6 0.7 0.8 0.9 1 1.1
Mean Wear Soar Diameter (mm)
Figure 6. Comparison of modified BOCLE results at 100 percent humidity (Procedure B)with maximum acceptable tost repeatability and reproducibility as defined in
ASTM D 5001 (Procedure A)
19
in Fig. 6. The solid and hollow symbols each denote 1 of 20 single tests performed within
BFLRF and an independent laboratory, respectively, using identical fuel. (Note: Three tests were
performed with each of the fluids in Laboratory A, although some points are not visible due to
overlapping results.) The broken lines define the maximum acceptable repeatability within a
given lab and reproducibility between independent test apparatus, as defined in Equations 1
and 2. The difference between any two test results should not exceed these values in more than
1 case in 20.(j.L) The repeatability and reproducibility in each of the nonstandard tests at
100 percent humidity are comparable to those expected from the ASTM standard procedure at
Reproducibility (2*Std Deviation) f 0.167*D 1 s (Eq. 2)
where D is the wear scar diameter produced in tests performed according to ASTM D 5001.(.•)
Results from the revised BOCLE test procedure at 10 and 100 percent relative humidity
(Procedures A and B) are compared with the wear observed in full-scale pump tests in Fig. 7,
using hollow and solid symbols, respectively. As in. preceding tests, the distinction between good
and unacceptable lubricity fluids is increased by the revised BOCLE procedure at 100 percent
and good directional correlation was observed with full-scale equipment, if Fuel G is excluded.
Clearly, however, the likely range of test repeatability (95 percent confidence from Fig. 6) forms
a significant portion of the discrimination between good and unacceptable fuels, while the effects
of interlaboratory reproducibility will be greater yet. The correlation is likely to be partially
degraded by the accuracy of the pump tests, the repeatability of which has not been defined.
These pump tests were performed at three locations with differing equipment, operating
conditions, and rating procedures, with no attempt being made to control fuel moisture content.
20
12
0 ... . . .........10 0
Fuel 'G'(LOW Vka)
E
S4 ....................................... ........... .............. ................ ............. . ... ,. ,• b ,! ,. m , r, ...... ............
W- 2..o Procedure A-. -.... , P r o c e d u r e A
0.5 0.6 0.7 0.8 0.9 1 1.1
BOCLE Wear Scar Diameter (mm)
(Error bars show 95 percent confidence interval for Procedure A or a BOCLE tests as discussed in Fig. 6.)
Figure 7. Relationship between sublective measure of full-scale pumn wear anresu•ts obtained wing Procedures A and B with the same fuels
The unexpectedly severe pump wear with Fuel 0 may be partially due to its relatively low
viscosity when compared with the remaining beter lubricity fuels, as defined in TABLE 2 (the
BOCLE result is largely independent of viscosity). Many of the pump tests were performed by
the manufacturers*, who indicate that a rating in excess of 4 represents unacceptable wear. Only
low-lubricity fuels are sensitive to moisture, with the result that the transition from mild to severe
pump wear still occurs at approximately 0.62 mm for both the revised and standard BOCLE
procedure, corresponding to the requirements of MIL-I-25017 (a) and the onset of oxidative
corrosion.
*Some pump wear-test data provided through ISOdTC22/SC7/WG6 courtesy of Stanadyne Automotive, Inc., and Robert Bosch
GMBH. It should be noted that many of the fluids are experimental in nature and In no way reflect the durability expectedwith this equipment under field conditions.
21
Previously, it was noted that low-lubricity fuels that produce a BOCLE result above 0.65 mm
have been successfully used in arctic conditions, with no apparent effect on durability. Full-scale
pump tests over a range of temperatures higher than those found in the arctic [320 to 90°C
(900 to 194TF)] failed to show any correlation with temperature, as detailed in Appendix B.
However, the nonstandard low-temperature BOCLE test described in Appendix G showed a
decrease in wear (-7* to 50*C), probably due to reduced solubility of water in the fuel, combined
with increased viscosity.
VI. DEVELOPMENT OF A SCUFFING LOAD WEAR TEST
A. Need for a Scuffing Load Test
The preceding section indicated that severe wear is produced by an oxidative mechanism with
highly refined fuels devoid of naturally occurring corrosion inhibitors, However, the ASTM
standard test (Procedure A) provides relatively narrow separation between fuels of good and
unacceptable lubricity, and a revised procedure, also based around oxidative corrosion
(Procedure B), produced only marginally improved discrimination. In addition, certain aspects
of fuel lubricity were not reflected by the lightly loaded contact conditions of either Procedure A
or B. Preceding studios using wear maps indicate that adhesive wear and scuffing under severe
contact conditions are not directly related to oxidative corrosion at low loads, as shown in Fig. 8.
Composition changes commonly produced proportionately greater variation in the applied load
required for the onset of scuffing than wear under conditions of continuous boundary lubrication.
As a result, direct correlation between a reproducible wear mechanism transition and full-scale
equipment may greatly reduce the measurement errors and uncertainty associated with the ASTM
standard BOCLE (Procedure A). Preceding studies have indicated that the Cameron-Plint test
apparatus provides a very distinct transition from mild oxidative corrosion to adhesive
scuffing.(.) However, the BOCLE apparatus is more suitable due to its widespread availability
and previous application in aviation.(4, _4-2_ Moreover, the preceding section indicates that
the BOCLE at least partially reflects oxidative corrosion in fuel injection systems from ground
Flpre S. Wear maps ptotted tw a function of slidingaRged and avolled Iqad
23
vehicles. A scuffing load procedure developed arnmnd this apparatus would simplify the
equipment requirements for complete description of fuel lubricity.
Many scuffing failure criteria are derived from Blok's hypothesis wherein a system will scuff if
the total contact temperature exceeds a certain critical leveL(,.) As a result, the scuffing onset
conditions for a given contact junction will depend on surface finish, applied load, sliding speed,
and the lubricity of the fluid. Moreover, composition changes commonly produce proportionately
greater variation in the applied load required for the onset of scuffing compared to corresponding
changes in wear scar diameter under conditions of boundary lubrication, as shown in Fig, 8 at
the test conditions defined in Procedure E. (Note: The true wear volume is proportional to the
more commonly reported wear scar diameter to the fourth power and is more closely related to
scuffing load capacity.)
B. DeVeloDment of a S•uffing Test Using the BOCLE
Hadley and Blackhurst (4) developed a modified procedure to ensure that the BOCLE operated
in the scuffing mode, summarized in Appendix A as Procedure C. In this procedure, a series
of 1-minute tests is performed, each with a finite load increment and new test specimens. At a
critical load, failure of the weak boundary layers formed by the fuel will occur as indicated by
an increase in wear scar diameter at that point. The procedure requires that the tests be run (and
preconditioned) with nitrogen to reduce the strength of the oxide film and promote adhesive
welding between the substrate materials. Hadley and Blackhurst (4) used Auger Electron
Spectroscopy to define the predominant wear mechanisms. In th.a present study, the results
obtained using a specially prepared friction force measurement arm were found to be in general
agreement with the results obtained using Auger at considerably reduced cost.
Test results obtained using Procedure C are provided in Appendix H, for selected fuels from
TABLE 2. In most instances, the friction coefficient provided a more precise measure of
scuffing onset than wear scar diameter. The average friction force during boundary lubrication
prior to scuffing was typically between 0.12 and 0.24, while the friction coefficient during
scuffing increased to between 0.25 and 0.35. As a result, the critical load required for the onset
24
of scuffing with the BOCLE may be best derived from consideration of both friction and wear.
Qualitative comparison between different fuels is possible using Procedure C, particularly if
multiple tests are performed at each load. However, in most instances, only a gradual transition
to scuffing is evident from consideration of the wear scar. Moreover, the test repeatability was
comparable to the variation between good and bad fuels and provided little benefit compared to
Procedures A and B.
The instantaneous friction force measured during Procedure C BOCLE scuffing tests at various
loads with Fuel F are plotted in Fig. 9. The variation in friction coefficient observed between
boundary lubrication and scuffing is relatively small. Moreover, a distinct transition from
effective boundary lubrication to adhesive scuffing does not occur at any single load, even within
a short 60-second test. Rather, intermediate loads produce initial scuffing, followed by recovery
and the onset of effective boundary lubricated wear with reduced friction. This change in wear
mechanism is probably due to decreasing contact pressure as the counterformal contact area
increases.
The contact conditions during tests performed according to Procedure C at an applied load of
450 g with Fuels A, B, and F are plotted in Fig. 10, as a function of test duration. (Note: The
applied load is half the specimen contact load due to the geometry of the BOCLE test apparatus.)
The wear scar diameter produced after only 10 seconds of testing is approximately 0.29 mm for
each fuel, with a mean con At pressure of 150 N/mm 2. By comparison, the Hertzian diameter
for the unworn counterformal contact is only 0.15 mm, with a mean contact pressure of
578 N/mm2, as described in Appendix I. Adhesive scuffing is unlikely to be the primary wear
mechanism, as continuous low friction was observed under these conditions for Fuel F, as shown
in Fig. 9. In addition, each fuel produced similar wear, although the scuffing resistance of Fuel F
is significantly greater than Fuels A and B.
25
-~ - - .53
~40
2.4 2,530
2.0 2.J 0 1.5V1kg
Time (min)Fligure 9. Friction trace. obtained du[nn. scuffng load tests
0.8 1 1 I -- 3 50OFue A/Smooth Ring+ Fuel A/Std. Ring ......... 800......... .... .0.7 *~Fuel B/Std. Ring30
'.& .Fuel F/Std. Ring
F0 0.400
0. 0.8
10 100 1000Test Duration (sea~)
Figure 10. Variation In BOCQLE wear scar diatneterwa a function of time Idurngi ItDerformed a1ccordin. to Procedure A with j~t rins. of different surface finish
26
The unexpectedly high friction and wear in the absence of severe scuffing is due to the
circumferential surface texture on the ASTM standard test ring (12), which promotes a number
of unwanted effects, including: abrasion, rapid removal of the surface oxide layers, and distortion
of the Hertzian contact. The resulting combined wear mechanism is likely to decrease the
severity of the transition observed. Initial wear rate was greatly reduced by polishing the ring
specimen to a mirror finish, depicted by circular characters in Fig. 10, Indeed, the diameter of
the wear scar produced by the polished ring after 10 seconds of testing is only marginally greater
than predicted from elastic deformation of the surfaces. Wear rate increases after approximately
40 seconds, and little variation exists between the results of the polished and standard rings after
an extended test period. This minimal variation Is probably due to the formation of an irregular
surface texture on the polished ring opposed by removal of the texture from the standard
specimen,
ASTM standard specimens were sequentially polished, resulting in "two process" surfaces that
consist of the original profile, with the higher peaks removed. As a result, the surface
deformation necessary to achieve a given bearing area is reduced, as shown in Fig. 11. The
results are plotted using a probabilistic X axis, such that a Gaussian (normal) cumulative
distribution function maps to a straight line. The original ground surface approximates a true
random distribution, while the surfaces of intermediate roughness (0.59 and 0.25 pm) retain their
original characteristics only at high bearing areas (high loads). The final specimen (0.015 Pm)
has a mirror finish and retains none of the original surface characteristics. A more detailed
description of the surfaces and their manufacture may be obtained in Appendix J.
The results of scuffing load tests (in air) with ISOPAR M (Fuel M), ISOPAR M + 60 mg/L
DCI-4A corrosion-inhibitor additive, and Fuel F are plotted in Fig. 12 as a function of the Root
Mean Square (Rq) surface roughness of the test ring. A dramatic increase in the apparent
scuffing load capacity of the better fuels was observed for surface finishes better than
approximately 0.18 pm. Comparatively little change was observed for the poor lubricity fuels,
resulting in greatly improved discrinination. In addition, the transition from boundary lubrication
to adhesive scuffing with each fuel was more distinct for the smoother surfaces.
27
4- Rq -O.75pm
3 -- Rq m 0.59pm2..Rq=0.25pm
2 .,-.Rq=O.llprn.......-.. RqO0.14pm I
-2 -,.-----.----.----,.--,----------------
-3
.4 I i.. I , .. I * I L...... , L
% Bearing AreaFIgure 11. Bearing area curves for ring soeclmens used In scuffin. load tets,.
Note: Batch B was clay treated immediately prior to inclusion of additive. Direct comparisonmay not be made between Batch A and Batch B. The test-ring specimens had a surfacefinish of 0.04 pm. Test humidity = 10 percent.
Both neat and additized ISOPAR M containing 30 mg/kg of corrosion-inhibitor additive are
specif:ad as reference fluids in ASTM D 5001, The results of repeat tests performed according
to Procedure D at additive concentration; 0, 30, and 60 mg/kg are p'ovided in TABLE 3. Two
b'atches of ISOPAR M were used (the data in Fig. 14 applies to Batch A), and a distinct variation
between the fluids is apparent, particularly at an additive concentration of 30 mg/L (statistical
probability >95 percent). Both samples produced a wear scar in excess of 0.8 nwil in tests
petformed according to ASTM D 5001. However, Batch B was clay treated irmmediately prior
to use, as its lubricity was superior to that of Batch A in the as-received condition, while Batch B
32
had been clay treated approximately 20 months prior to use, possibly removing oxidation
inhibitor additives. The variation in the ASTM standard BOCLE result obtained with Batch A
over the intervening 20-month period is shown in Appendix F (Fig. F-3). Both Procedures A
and D appear affected by the age of the referenct fluid.
The standard deviation of the test results obtained using Procedure D is 115 g and provides the
basis for the error bars in Fig. 14 (95 percent confidence). Bartlett's test shows no statistically
significant variation in the standard deviation of the test results across the load range examined,
and the coefficient of variation ranges from 2 to 10 percent. By comparison, the ASTM standard
BOCLE results (Procedure A) produced by most real fuels (unike ISOPAR M) are within the
range of 0.55 to 0.72 mm, with a corresponding standard deviation range of 0.019 to 0.032 mm,
as defined in Equation 1. The coefficient of variation ranges from approximately 4 to 5 percent,
which is comparable to that obsarved in Procedure D. Clearly, however, the effects of test
variability will be less significant in Procedure D than Procedure A, as the ratio
between the standard deviation and typical spar of the results observed is reduced frvim
approximately 15 to 3 percent.
D. Qorrelatlon of Procedure D With Full-Scale Pump Results
The results of scuffing load wear tests performed according to Procedure D are compared with
wear produced by the same fuels in full-scale pump tests in Fig. 15. Fig. 15a shows the results
obtained in tests performed with a 30-second break-in period at 50 percent humidity. Fig. 15b
was obtained using specimens that have a slight surface texture and a surface finish of 0.04 pmn
but without a break-in period at 10 percent humidity. Similar results were obtained in both
procedures, and good directional correlation was observed in each instance. [Note: Good
corrlation was obtaitied with Fuel G at high humidity.] Moreover, the correlation is likely to
be partially degraded by the accuracy of the pump tests, which were performed at three locations
with differiag equipment, operating conditions, and rating procedures with no control of fuel
rmoi1.smret content. Clearly, the slightly textured specimen provides increased discrimination,
9lthou•n it is believed that test variability is correspondingly increased. Very low lubricity fuels
33
11
10 08
II 5
8 O a sie Fueli
2 0
1
5 4 3 2 1 a
Scuffing Load Capacity (kg)a. Surface Roughness of Test Ring n 0.015 ism
(30-second break-in period at 500-gram Load, 50 percent humidity)
11
1101
a ~ ) MaxAcet WO
2
a '. . . . ......... ' i . . . .......
6 5 4 3 2 1 0
Scuffing Load Capacity (kg)
b. Surface Roughness of Test Ring = 0.04 pm (no break-in period, 10 percent humidity)
(Error bars in Fig. 8 define 95 percent confidence interval as defined in TABLE 3.)
Figure 15. RelatlonshiD between subjective measure of full-scale =Dun wear andresults obtained using Procedure D with the sane fueh
34
SIllll M II
typically caused severe pump wear and catastrophic pump failure, denoted by a subjective pump
rating of 10. These sudden failures produce a discontinuity at a scuffing load capacity of
approximately 1.2 kg. Both the laboratory and full-scale equipment tests predict relatively severe
wear with JP-8. The equipment manufacturers indicate that this level of wear protection would
not be acceptable in commercial equipment.
Many of the equipment tests were performed by the original manufacturers. Those tests indicate
that a subjective rating in excess of 4 corresponds to unacceptable field wear. Clearly, a scuffing
load capacity in excess of 4 kg for the slightly textured specimens (or 2.8 kg with the 30-second
break-in) indicates that a given fuel is likely to produce acceptable wear in full-scale equipment
(subjective rating <4). The results of laboratory wear tests performed at an applied load of
2.8 kg with highly polished specimens of 0.015 pnn roughness (Procedure E) are shown in
Fig. 16 for tests performed with a 30-second break-in. Clearly, a significant difference is present
between the pass and fail fuels. The single 2-minute test unambiguously discriminates between
good- and bad-lubricity fuels, based on the needs of full-scale equipment. Many tests with low-
lubricity fuels had to be terminated prematurely due to excessive friction and severe scuffing,
resulting in artificially low friction and wear measurements. The BOCLE apparatus is presently
being modified to allow completion of these tests.
E. Comparison and Correlation Between Souffina Load Tests
Three distinct techniques to define the scuffing wear resistance of fuels have been evaluated, two
of which use the BOCLE (Procedures C and D) and one uses the Cameron-Plint test apparatus
(Procedure F). Procedure C was previously shown to produce good correlation with the
well-established Thornton Aviation Fuel Lubricity Evaluator (1) and so was used as the baseline
in the present comparison. Procedure E is derived from Procedure D and was not considered
in the present analysis. The test methodology used for the Cameron-Plilt tests corresponds to
that of the wear maps, with the raw data shown in Appendix H.
35
*1 Friction Cost.
-o Wear scar Dia.
0
0.5. . . 0. 0.7 0. 0.
S 4 ............................................ ....... ,,L '. ,, ,W , ,
(Specimen Ring Roughness . 0.015 Im=, 30-second break-in at applied load of 500 g, 50 percent humidity)
Figure 16. RelatlonhiD betwen subjective measure of full-scale numb wear andresult gbtaned using Procedure E with the same fuels
Good directional correlation was achieved between Procedures C and D, as shown in Fig. 17a,
The applied load required to produce scuffing in Procedures D and E is several times that
required in Procedure C, despite the fact that the sliding speed is increased from 240 to 525 rpm.
Clearly, the differentiation among fuels provided by the polished ring is an order of magnitude
better than the standard specimen, resulting in greatly improved utility. Similarly, the transition
to severe wear P,' scuffing using the Cameron-Plint test apparatus is more severe than that
previously obsern ý.- with either BOCLE test, as shown in Fig. 17b. The applied load required
to produce scuffing in the Cameron-Plint test apparatus is approximately 10 times greater than
for Procedure C. This dramatic difference in required loading is due to the polished surface
topography of the Cameron-Plint specimens, combined with its relatively low average sliding
speed. (Procedure A = 0.616 m/s; Procedure D = 1.53 m/s; Procedure F = 0.238 m/s).
36
ProcedureSProcedureI
,4ooo
joao a. Procedure C Versus Procedure D
iaao
10002
0Pull
3000 30
250, I Procrure d 250 Procedure F
b. Procedure C Ve rsus Procedure F 1500
11000 0
0,Ft5m
*~~O ~ PrdureI Fh
Figur 10. Pomdareso oA sufnlOAdtsreuswthulseaidinT LE
0.7
lea0. CI c. Procedure F Versus Procedure A0.5
~120 0.4
fe0 0.3
rum
Figure 17. CoMggrlson 11f Acuffing load test results with fuels detailed In TABLE 2
37
Procedure A gives a directionally similar ranking to scuffing load capacity, as measured by both
Procedures, D and F shown in Figs. 11 and 17c, respectively. However, the correlation is not
perfect, and Fuels I and I provide unexpectedly good scuffing load characteristics when compared
to their performance during boundary lubrication, particularly in the Cameron-Plint tests. In
addition, the scuffing load capacity for the Jet A-I fuel is less sensitive to low additive
concentrations (i.e., Fuel B), than the standard BOCLE test. Poor correlation between the
oxidative corrosion and adhesive wear mechanisms has been suggested by previous workers.(4)
Sensitivity to additive concentration was increased during BOCLE tests performed at high (50
percent) humidity, probably due to the increased importance of the oxidative corrosion
mechanism.
No quantitative comparison was made between the Cameron-Plint and the BFLRF-modified
BOCLE scuffing load procedure, as Fig. 17a indicates that the results of both BOCLE techniques
are closely related.
VII. DISCUSSION
Fuel lubricity and wear resistance are two of the few properties that may be degraded by certain
refinery processes.(2,) The present study addresses the evaluation of fuel lubricity in two ways:
a) full-scale equipment tests were performed to understand better the wear mechanisms present,
and b) laboratory tests were developed and compared with the results obtained in the full-scale
equipment tests. The premise for the wear mechanism evaluation was that oxidative corrosion
may be controlled by varying moisture availability or use of corrosion-inhibitor additives.
Indeed, oxidative wear appears broadly proportional to humidity, indicating that availability of
moisture is the rate-limiting parameter in the surface oxidation reaction. It is recognized that the
related mechanism of fretting corrosion and, to a lesser extent, adhesion and scuffing will also
be slightly affected by fuel moisture content. However, it is assumed that these effects are
negligible in the present context.
Oxidative corrosion was found to be the primary wear mechanism under lightly loaded conditions
with the most severely refined fuels. Indeed, the wear rate produced by this mechanism was
38
sufficient to cause complete pump failure in less than 8 hours. Even pumps containing an
improved (Arctic) metallurgy failed rapidly in damp conditions, due to severe wear of remaining
nonimproved components. Wear of highly loaded components was pattially reduced but not
eliminated by removal of moisture, and the remaining wear may be attributable to adhesion. As
a result, the severe material removal in highly loaded contacts with these fuels is not solely due
to adhesive scuffing, and a combined wear mechanism is likely. The direct relationship between
moisture availability and wear rationalizes the successful use of highly refined fuels such as
Jet A-1 in military vehicles under arctic conditions. Laboratory wear tests in Appendix 0
confirmed that wear rate is reduced at low ambient tcmperam:ures.
The present work demonstrated better correlpticn between full-scale pumps and the BOCLE
apparatus than previous studies, which did not fully consider the effects of moisture,(,.l.-.1A)
Therefore, the standard BOCLE wear test as defined in ASTM D 5001 (Procedure A) does reflect
both wear rate and mechanism in the fuel injection system with very low lubricity fuel devoid
of corrosion inhibitors. The BOCLE result of approximately 0.62 mm simultaneously reflects
the onset of catastrophic surface oxidation and unacceptable pump wear and closely reflects the
requirements of the U.S. Air Force in aviation equipment,(&.) Marginally improved separation
between good and unacceptable fluids was achieved by increasing the level of humidity in the
test cell (Procedure B), with no apparent decrease in repeatability, However, the principal
difficulty with both oxidative corrosion wear tests is poor differentiation between good and
unacceptable fluids.
Improved results were obtained by measuring the applied load required for transition from
boundary lubricated wear to adhesive scuffing and a detailed test procedure was developed based
around ASTM D 5001. A polished test ring replaces the standard textured specimen to minimize
the asperity tip stresses, resulting in mild wear at all loads prior to scuffing and severe material
removal and surface deformation during scuffing. The scuffing load tests may be used to provide
either a continuous quantitative comparison (Procedure D) or a simple pass/fail criteria
(Procedure E) and provide greatly increased separation between good and poor lubricity fuels
with no apparent increase in test error.
39
Production of an accurate surface finish on the ring specimen is critical to the accuracy of the
scuffing-load wear test procedures. In general, the surface may not be completely defined using
a profilometer, due to the very smooth finish and the significant effect of small variations in
roughness. The load-carrying capacity of the contact is found to decrease significantly if the
surfaces are excessively smooth, This anomalous effect Is probably due to a rapid increase in
the real area of contact within the apparent or geometric contact area, as elastic deformation
accommodates the small surface irregularities. Lubricant flow into the contact may then be
decreased due to the lack of a convenient flow path, Hirst and Hollandar QD also indicate that
in these conditions the surface damnage more easily builds up to serious proportions because there
are no longer any interruptions to prevent the growth of small welded junctions, The results of
the present study Indicate that a slight surface texture (visible as a haze) provides optimum
discrimination; however, the perfectly polished surface may be more accurately reproduced, and
correspondingly superior test repeatability is obtained when a 30-second break-in period is used.
The scuffing load test produced better correlation with the oxidative corrosion mechanism of the
ASTM standard BOCLE procedure (Procedure A) than would have been predicted by the wear
maps. Both tests ait sensitive to the effects of boundary-lubricant additives and produced
qualitative correlation with refinery severity, as defined by sulfur and aromatic content, The
scuffing load test magnifies the effect of the additives, but requires higher additive concentration
and strength when compared to the ASTM standard BOCLE procedure, However, the ASTM
standard BOCLE test is designed to highlight the effects of oxidative corrosion and is therefore
sensitive to lower concentrations of the dilinoleic acid-based corrosion inhibitor additive. It may
be assumed that low additive concentrations prevent formation of a surface oxide layer without
providing a more durable boundary film, Preceding studies performed with the TAFLE (a2) also
indicate that the onset of adhesive scuffing and seizure is relatively insensitive to low
concentrations of corrosion inhibitor additives. Increased additive sensitivity is provided by the
scuffing load wear test at high humidity, probably due to increased importance of surface
oxidation.
Similarly, full-scale pump tests with JP-8 fuel show unacceptably severe wear (this fuel
corresponds to Jet A-i aviation turbine fuel with a low concentration of corrosion inhibitor
40
additive). By definition, JP-8 produces a small (<0.65 mm) wear scar in the ASTM standard
BOCLE test (Procedure A). This result indicates that scuffing-load capacity and adhesive wear
resistance is more closely related to the wear process in full-scale equipment than tests for
oxidative corrosion, Each of the BOCLE tests examined was highly sensitive to fuel
contamination, The importance of the remaining contact parameters such as humidity and
temperature on Procedures D and E is yet to be defined. Preceding results using the ASTM
standard test ring would indicate that these contact parameters may also have a significant
effect.,(a) A number of tests have been peforimed using an AISI E-52100 steel ring In place
of the ASTM standard specimen (SAE 8720) to reduce compatibility (increase mutual solubility)
with the opposing test ball. However, this variation had little apparent effect on the severity of
the transition obtained, possibly due to the relatively high indentation hardness of the
specimens.(2 Full-scale equipment appeared less sensitive than the laboratory tests and were
largely unaffected by initial running-in with a good lubricity fuel prior to operation on Jet A-i.
In general, good correlation was achieved between the laboratory wear tests and full-scale
equipment, However, the BOCLE tests are largely independent of viscosity, while many pump
manufacturers specify a minimum viscosity of approximately 1.8 cSt at pump operating
temperature. As a result, low-viscoaity fuels that provide acceptable boundary protection in the
laboratory tests may still produce severe pump wear. The effects of viscosity are less apparent
for fuels that have low inherent lubricity and produce severe wear irrespective of physical
characteristics, The results of the present study indicate that a scuffing load capacity below 3 kg
(as defined using Procedure D or E) will produce unacceptable equipment wear. Howevor, this
value is unlikely to be absolute and will vaiy as a function of fuel viscosity, equipment operating
temperature, and Individual equipment requirements.
A model defining the dffRcts of hydrodynamic/clastohydrodynamic lubrication on minimum
acceptable chemical lubricity is needed. Sulfur and aromatic content are partially related to
kinematic viscosity, as shown in Appendix F, particularly for straight-run distillate fuels
(processes such as solvent extraction, clay treatment, or catalytic hydrogenation are capable of
producing clean fuels with high viscosity), It additiou, both fuel composition and kineinatic
viscofity (,u) are related to density Q,, although kinematic výscosity may Ie converted to the
41
more fundamental dynamic viscosity (il) using Equation 3. Clearly, thick-film and boundary
lubrication are separate mechanismns that are partially interrelated in some instances.
'U W (Eq. 3)P
The volumes of aromatics, olefins, and sulfur were folnd to be loosely interrelated and together
appear to form a broad measure of the severity of the refining process. Oxidative corrosion
increased dramatically for severely refined fuels with a sulfur content below approximately
0.025 mass%. However, no universal relationship was found between Procedures A or B (which
measure oxidative corrosion) and fuel composition; indeed, these tests are independent of
composition for less highly refined fuels, Trace amounts of a reactive compound greatly affect
the oxidative corrosion mechanism, and small changes in refinery parameters such as endpoint
produced a significant change in lubricity. In contrast, Procedures C and D remain sensitive to
aromatic, sulfur, and artificial additive content for the range of fuels evaluated. Boundary film
strength and resistance to adhesive scuffing in the absence of a surface oxide layer appears
sensitive to the concentration of reactive species present in fuels. Aviation research in the late
1960s also indicated that fuel lubricity is dependent on the presence of polar compounds, most
probably high molecular weight aromatics.,•Z) The composition of these better lubricity fuels
Is highly complex and i,, not easily represented by any simple collection of parameters. In
contrast, it may eventually be possible to predict the expected boundary lubricating performance
of severely refined fuels, as the majority of reitctive compounds have been removed.(U4) The
results suppoet Hadley's conclusion (4) that the relative performances of the fuel in both the mild
and scuffing regime are. dependant on differrit aspects of fuel composition,
The effects of low-lubrIcity fucIs have beet, observed iby isolated commercial users in the United
States and also in Sweden. Light-duty vehicles operating on Jet A-1 that rmeets ASTM D 975
have experienced poor startability in warm armbicnt conditions in Phoenix, AZ.(&) This effect
is in good agrzement with the results of the present study. although it is unclear if this poor
performance is due to low viscosity and internal put-p leakage or incrensed pump wear.(.W) In
conclusion, the results of the present study indicate thtu.t JP-8 providt. only marginal boundary
film prot.ectlon in rotary fuel injectlon systems, while Jet A-1 is acceptable only under cold
"42
ambient conditions. In addition, replacing DF-2 with JP-8 or Jet A-1 will reduce maximum
engine power/startability and will produce an additional undefined decrease in rotary fuel
injection system durability, due to reduced viscosity and poor adhesive wear resistance. The
decrease in durability will depend on a number of factors, including fuel viscosity, composition,
and temperature.
Neat Class 1 low-sulfur fuel, currently on sale in Scandinavia (Fuel Q in TABLE 2) has similar
lubricity to Jet A-i, as measured using the laboratory tests described in the present study,
Durability problems associated with the Scandinavian fuel appear to have been eliminated
through the use of additives, partially validating the results of the present work. By comparison,
most tests performed with U.S. low-sulfur/low-aromatics fuel indicate Intermediate lubricity, with
occasional instances of poor lubricity. Many commercial additivs are available that significantly
Improve lubricity; however, their effectiveness appears to be fuel composition-sensitive.
The test procedures for oxidative corrosion and scuffing described in this paper reflect the
principal wear mechanisms for lower lubricity fuels, defined by the we:r mechanism maps, It
Is likely that other individual mechanisms and combinations also exist in full-scale equipment.
These mechanisms may include corrosive fretting, abrasion by hard metallic oxides, fatigue, and
sulfur corrosion.(&. The present approach attempted to isolate the predominant mechanisms and
model each Individually. Overall, the BOCLE apparatus is an effective tool; however, a number
of effects combine to decrease the repeatability obtained. In particular, the calibration of the
humidity (below saturation) and speed controls requires regular adjustment, while temperature
control, although critical to accuracy, is not automated. More subtle effects such as accidental
fuel contamination, or even the gradual formation of oxygenated species during storage, greatly
affect lubricity and apparent test repeatability, particularly with highly refined fuels. Previous
workers have also emphasized the Importance of these effects.(21 However, such variation is
indicative of an accurate tost configuration that Is highly sensitive to small changes in fuel
composition. Clearly, no single test will fully represent each of the permutations possible.
However, it is hoped that the wear test procedures suggested in the present work may be used
to represent the most critical contacts in full-scale equipment.
43
Vill. CONCLUSIONS
As a result of this study, the following conclusions are made:
1. Wear test procedures based around the transition from mild oxidative wear to
adhesive scuffing were developed for the BOCLE and provide greatly improved
differentiation between good and unacceptable lubricity fuels.
2. The scuffing transition test provided good repeatability. Unacceptable pump wear
occurs for fuels that provide a scuffing load result below 3 kg.
3. The adhesive scuffing test showed directional correlation with preceding tests, such
as those developed by Hadley and the Thornton Aviation Fuel Lubricity Evaluator
(TAFLE).
4. Fuel lubricity is adversely affected by refinery severity,
5. Injection system durability will be reduced by use of JP-8.
6. Relatively small changes in refinery treatment may have a significant effect on
lubricity after a critical fuel composition is achieved.
7. Wear-related failures of rotary fuel injection pumps may be produced in a matter of
hours with very low lubricity fuels such as neat Jet A-1 in a severe operating
environment.
8. Laboratory wear tests indicate that the wear rate with Jet A-1 is reduced at low
temperatures approaching the freezing point of water.
9. The ASTM standard BOCLE procedure is accurate and repeatable, but provides little
separation between good and unacceptable lubricity fuels.
44
10. Addition of dilinoleic acid-based corrosion inhibitors to Jet A-1 (such as those used
in JP-8, 15 to 22 ppm) greatly reduced oxidative wear.
11. Good directional correlation was achieved between the ASTM standard BOCLE test
and the onset of very severe oxidative corrosion in the full-scale pump.
12. Corrosion inhibitors have little effect on scuffing load capacity at the very low
concentration recommended in MIL-I-25017. However, a significant improvement
in scuffing load capacity is observed at significantly higher concentrations (i.e., 250
ppm).
13. The ASTM standard BOCLE is largely insensitive to the lubricity of less highly
refined fuels not susceptible to oxidative wear (in the absence of very strong artificial
boundary lubricant additives).
14. The scuffing load test remains sensitive to the lubricity of less highly refined fuels
that do not produce oxidative wear.
15. Wear with good lubricity fuels (BOCLE <0.62 mm) appears to be independent of
moisture content. The wear rate associated with poor lubricity fuels that produce a
BOCLE wear scar diameter greater than approximately 0.62 is highly sensitive to the
availability of moisture and the associated effects of temperature on water solubility.
16. Engine power is reduced by approximately 14 percent when operated on Jet A-I in
place of a conventional DF-2. (Note: The Jet A-1 used in the present study has
especially low viscosity and represents a worst-case example.)
17, The lubrication qualities of standard test fluids such as ISOPAR M is not constant
and improves slightly with time.
45
18. Scuffing wear resistance of fuel-lubricated contacts is highly sensitive to surface
roughness.
19. Load-carrying ability is significantly reduced for excessively smoot, surfaces
produced during initial manufacturt; or subsequent mild wear.
20. In general, a dramatic increase in oxidative corrosion wear occurs after a critical
level of refinery se,.,t~rity is achieved, as defined by sulfur, aromatic, and olefin
content. Other mec.hanisms include adhesive scuffing, three-body abrasion by oxide
particles, and fretting.
21. The improved metallurgy or "arctic" kits available for some rotary fuel injection
pumps fails to prevent wear in the remainder of the pump when operated with very
low-lubricity fuels.
22. Initial break-in of the pumps with good lubricity fuels has little effect on the
subsequent wear rate observed with low-lubricity fuels.
23. Limited experience with commercially available low-sulfur/low-aromatics fuels
would indicate intermediate and occasionally poor lubricity.
24. Additive effectiveness appears to bc fuel composition-sensitive.
IX. RECOMMENDATIONS
Additional work on this subject is rec.mmended in order to answer the following questions:
1. Is acceptable long-term durability guaranteed in the absence of oxidative corrosion,
particularly in highly loaded unit injection systems?
2. What i3 the importance of viscosity, particularly on long-term durability?
46
3. What is the influeme of viscosity on the correlation between the laboratory wear
tests and full-scale equipmont?
4. Is there a relat,onslidp between minimum acceptable lubricity and
viscosity/temperature?
5. What was the typical lubricity of high-sulfur diesel fuels available prior to October
1993?
6. VU7 at is the typical lubricity of the currently available low-sulfur/low-aromatics
fuels?
7. Will reformulated diesel fuels available to the U.S. Army suffer from the oxidative
corrosion wear mechanism seen in Scandinavia?
8. The ASTM ,tandard BOCLL test is independent of composition for fuels containing
a significant amount of nonsaturated hydrocarbons. Is pump wear also independent
of composition for fuels of this type?
9. What components in the fuel are responsible for lubricity?
10. Are the same fuel components responsible for wear under conditions of both
oxidative corrosion and adhesive scuffing?
11. What ate the effects of fuel lubricity on more highly loaded unit injection systems?
47
X. LIST OF REFERENCES
1. Department of Defense Directive 4140.43, subject: "Fuel Standardization," March 1988.
2. Wear Control Handbook, Peterson, M.B., Winwer, W.O., ed., American Society ofMechanical Engineers, United Engineering Center, '45 East 47th Street, New York., NY10017, 1980.
3. Lacey, P.I., "The Relationship Between Fuel Lubricity and Diesel Injection System Wear,"Interim Report BFLRF No. 275 (AD A247927), prepared by Belvoir Fuels and LubricantsResearch Facility, Southwest Research Institute, San Antonio, TX, January 1992.
4. Hadloy, J.W. and Blackhurst, P., "An Appraisal of the Ball-on-Cylinder Technique forMeasuring Aviation Turbine Fuel Lubricity," Society of Tribologists and LubricationEngineers, Vol. 47, No. 5, pp. 404-411, 1991.
5. Catalog of Friction and Wear Devices, Second Ed., American Society of LubricationEngineers, Park Ridge, IL, 1977.
6. Datchefski, G., "History Development and Status of the Ball-on-Cylinder Lubricity Evaluatorfor Aero Gas Turbine Fuels," Procurement Executive Ministry of Defence, Directorate ofEngines Eng 2a, St. Giles Court, London WC2H 8LD, UK, Reference D/DEngl(PE)33/25/1,1991.
7. Lacey, P.I., "Wear Witi, Low-Lubricity Fuels, Part I - Development of a Wear MappingTechnique," Wear, 160, pp. 325-332, 1993.
8. Lacey, P.I., "Wear With Low.-LLbricity Fuels, Part H - Correlation Between Wear Maps andPump Components," Wear, 160, pp. 333-343, 1993.
9. Lacey, P.I., "Evaluation of Oxidative Corrosion in Diesel Fuel Lubricated Contacts," ASMETribology Transactions, Preprint No, 93-TC-2E-1, presented at the ASME/STLE TribologyConference in New Orlenms, LA, October 24-27,, 1993.
10. Lacey, P.I. and Lestz, S.J., "Failure Analysis of Fuel Injection Pumps From Generator SetsFueled With Jet A-l," Interim Report BFTRF No. 268 (AD A234930), prepared by BelvoirFuels and Lubricants Research Facility (SwRI), Southwest Research Institute, San Antonio,TX, January 1991.
11. Lacey, P.I. and Lestz, S.J., "Wear Analysis of Diesel Engine Fuel Injection Pumps FromMilitary Ground Equipment Fueled With Jet A-i," Interim Report BFLRF No. 272(AD A239022), prepared by Belvoir Fuels and Lubrioants Research Facility (SwRI),Southwust Research Institute, San Antonio, TX, Maiy 1991.
48
12. Lacey, P.I. and Lestz, S.J., "Fuel Lubricity Requirements for Diesel Injection Systems,"Interim Report BFLRF No. 270 (AD A235972), prepared by Belvoir Fuels and LubricantsResearch Facility (SwRI), Southwest Research Institute, San Antonio, TX, February 1991.
13. Lacey, P.I., "Effect of Low-Lubricity Fuels on Diesel Injection Pumps-Part I: FieldPerformance," SAE Technical Paper No. 920823, Society of Automotive Engineers,400 Commonwealth Drive, Warrendale, PA 15096, February 1992.
14. Lacey, P.I., "Effect of Low-Lubricity Fuels on Diesel Injection Pumps-Part II: LaboratoryEvaluation," SAE Technical Paper No. 920823, Society of Automotive Engineers, 41)0Commonwealth Drive, Warrendale, PA 15096, February 1992.
15. "Aviation Turbine Fuel, Grades Jet A-i/Jet A," American Society for Testing and MaterialsStandard D 1655, ASTM, 1916 Race Street, Philadelphia, PA, 1989.
16. Military Specification MIL-T-83133C, "Turbine Fuels, Aviation Turbine Kerosene Types,"NATO F-34 (JP-8) and NATO F-35, 22 March 1990.
17. Compilation of Fuel, Lubricant, and Engine Statistics, Department of the Army, U.S. Army
Belvoir Research, Development and Engineering Center, Fort Belvoir, VA, 28 May 1992.
18. Federal Specification VV-F-800D, "Fuel Oil, Diesel," Grade DF-2, 27 October 1987.
19. American Society for Testing and Materials Method D 50Ci-89, "Test Method forMeasurement of Lubricity of Aviation Turbine Fuels by the Ball-on-Cylinder LubricityEvaluator (BOCLE)," ASTM, 1916 Race Street, Philadelphia, PA, 1989.
20. Archard, J.F., "Contact and Rubbing of Flat Surfaces." J. AppL. Phys. 24, pp. 981-988, 1953.
21. Wei, D. and Spikes H.A., "The Lubricity of Diesel Fuels," Wear, 111, 2, 1986.
22. "Aviation Fuel Lubricity Evaluation," CRC Report No. 560, Coordinating Research Council,219 Perimeter Center Parkway, Atlanta, GA, July 1988.
23. Military Specification MIL-I-25017E, "Inhibitor, Corrosion/Lubricity Improver, Fuel Soluble(Metric)," 15 June 1989.
24. "Handbook of Aviation Fuel Properties," CRC Report No. 530, Coordinating ResearchCouncil, 219 Perimeter Center Parkway, Atlanta, GA, 1983.
25. Biddle, T.B. and Edwards, W.H., "Evaluation of Corrosion Inhibitors as LubricityImprovers," AF Wright Aeronautical Laboratories (AD A198743), July 1988.
26. Blok, H., "LUs Temperatures de Surface Dans des Conditions de Graissage Sous PressionExtreme," Proceedings of the 2nd World Petroleum Congress, Paris, June 1937.
49
27. Durkee, D.B. and Cheng, H.S., "An Examination of a Possible Mode of Scuffing Failure inSimple Sliding," Wear, 59, pp. 223-230, 1980.
28. Odi-Owei, S., Roylance, B.J., and Xie, L.Z., "An Experimental Study of Initial Scuffing andRecovery in Sliding Wear Using a Four-Ball Machine," Wear, 117, pp. 267-287, 1987.
29. Yamamoto, Y. and Hirano, F., "Relation Between Scuffing Resistance and the Increase inSurface Hardness During Tests Under Conditions of Rolling/Sliding," Wear, 63,pp. 165-173, 1980.
30. Torrance, A.A. and Cameron, A., "Surface Transformations in Scuffing," Wear, 28,pp. 299-311, 1974.
31. Hirst, W. and Hollander, A.E., "Surface Finish and Damage in Sliding," Proc. Roy. Sol.
Lond., Ser. A. 337, pp. 379-394, 1974.
32. Goodger, E. and Vere, R., Aviation Fuels Technology, Macmillan, New York, NY, 1985.
33. Hadley, J.W., "A Method for the Evaluation of the Boundary Lubricating Properties ofAviation Turbine Fuels," Wear, 101, pp. 219-253, 1985.
34. Hadley, J.W., "The Effect of Composition on the Boundary Lubricating Properties ofAviation Turbine Fuels," text of presentation given at MOD/TOP Seminar "Tribology ofAviation Turbine Fuel Systems" at the Institute of Physics, London, England, December 13,1989.
35. Excerpts from letter dated August 25, 1992 Mike Lopker, Public Works Dept., City ofPhoenix to Mike Millar, Ford Motor Company. Letter was edited by Mr. P.T. Hendersonand circulated as item N1008 in the ISO/TC22/SC7/WG6 record.
36. Lacey, P.I., "Development of a Fuel Lubricity Test Based on the Transition From OxidativeCorrosion to Adhesive Wear Mechanisms," Paper No. 93111, in press with Journal ofLubrication Engineering.
50
APPENDIX A
Laboratory Test Conditions
51
TABLE A.I. Summary of Conditions Used In Laboratory Wear Tests Discussed orDeveloped In the Present Study
Oxidative Corr. (Some Adhesion) Adhesive Scuffing (Some Oxidative Corr.)Procedure Type: A B C D E F
App. Load, kg 0.5 0.5 0.5 to 2.0 0.5 to 8.0 3 1 to 25.0
Ring Texture Standard Standard Standard Polished Polished -.
Atmosphere Air Air Nitrogen Air Air Air
Humidity, %Rh 10 100 10 50 50 50
Pass/Fail 0.65 mm 0.65 mm 1 kg (Aprx) 3 kg No Scuffing --
Reference 19 -- 4 .... 7
1. Test specimen metallurgy and cleaning procedure as defined in ASTM Method D 5001-89.2. The load refers to the applied load (BOCLE only) and corresponds to half that on the test specimens.3. In each instance, the test is preceded by a 15-minute preconditioning period at the appropriate conditions
of atmosphere and humidity.4. The root mean square surface (RMS) roughness of the ASTM standard ring must be between 0.56 and
0.71 pm. The surface roughness of the polished specimen must be less than 0.05 pm RMS as defined inAppendix J of this report,
5. Severe scuffing may necessitate premature termination of tests performed according to Procedures D andE.
6. The fuel sample was changed after every fifth test in Procedure D in the absence of scuffing and afterevery test that produced very severe scuffing.
7. A detailed description of the test methodology for Procedure D may be obtained in Appendix K of thisreport.
8. All of the results reported in the present study (except Figs. 15a and 16) used Procedure D without a break-in period and 10 percent humidity. Future work will use the break-in period and 50 percent humidity,resulting in marginally different results.
53
APPENDIX B
Summary of Full.Soals Pump Tests
55
SUMMARY OF FULL-SCALE PUMP TESTS
A. Pump Stand Test Methodolony
An arctic and a standard fuel pump were tested simultaneously on a Unitest stand with a common
fuel supply. 'ro ensure a realistic test environment, the mounting arrangement and drive gear
duplicate that of the GM 6.2L engine. For this study, 1,000 liters of test fuel were maintained
in an enclosed reservoir and continuously recirculated throughout thL. duration of each test, A
centrifugal supply pump provided a positive head of 3 psi at the inlet to the test pumps. A
primary (sock) filter (AC Part No. T935) and a cartridge filter corresponding to that used on the
6.2L engine in the High-Mobility Multipurpose Wheeled Vehicle (HMMWV) (GM Part
No. 14075347) were used to remove wear debris and particulate contamination. Finally, a 3-kW
Chromalox explosion-resistant circulation heater produced the required fuel inlet temperature.
The heater has a relatively low watt density of 15 W/in.2 to minimize fuel degradation due to
flash heating, and a 40-liter (11-gal.) reservoir was placed in line after the heater to ensure that
the fuel supply temperature remDained stable as the thermostat cycled, Each pump was fully
insulated using rockwool to ensure that the temperature of the complete unit is similar to that of
the incoming fuel.
The high-pressure outlets from the pumps were connected to eight NA52X fuel injectors from
a GM 6.2L engine and assembled in a collection canister. Fuel from both canisters was then
returned to the bulk storage tank via a common return line, A separate line to the bulk storage
tank was used to carry excess fuel from the governor housing. Fuel-to-water heat exchangers on
both the return lines from the injector canisters and the governor housing were used to control
the temperature of the fuel. The fuel reservoir was maintained below the minimum flash point
of Jet A-I to minimize evaporation of the lighter fractions in the fuel, A pressure gauge was
placed at the inlet to each pump, and a separate tool was manufactured to allow continuous
measurement of the internal transfer pump pressure during normal operation.
57
B. Effect of Dissolved Moisture on Pump Wear
Two full-scale pump stand tests were performed to confirm the effects of dissolved moisture on
fuel system wear. Standard (nonarctic) reconditioned pumps were used, as the arctic components
appear to be largely independent of oxidative wear.(.,2ý)* During these tests, 200 liters of fuel
were contained in a sealed reservoir, with a single vent to the atmosphere. During the initial test,
dry compressed air was bubbled through Jet A-I at a rate of 0,33 ft3/min, to define the baseline
wear rate in the absence of moisture. A prepurge period of 24 hours was performed to remove
existing moisture from the fuel. The neat Jet A-I fuel was continuously clay treated during the
test, further reducing the residual moisture content within the closed system.
In the second test, 4 liters of water were placed at the bottom of the fuel tank to ensure that the
fuel was saturated with dissolved moisture. The flow and return pipes to the pump were
positioned so that no bulk water was transported to the pump. A Stanadyne Model 80 filter
(No. 27288) with integral water separator was placed in line before the pump to remove any free
water from the fuel supply. However, no free water was found in the filter at the conclusion of
the test. The fraction of dissolved water was determined to be approximately 57 ppm, which is
close to the saturation level for Jet A-1 at the reservoir temperature of 330 C (930F).CQ.) Free
water is commonly formed in vehicular fuel tanks due to the effects of condensation (i.e., a drop
of 100C in fuel temperature when that fuel is water raturated will create 15 to 25 ppm of
undissolved or free water).(Q.)
The fraction of dissolved moisture present in the fuel greatly affected pump durability. The
transfer pump pressure and fuel delivery remained almost unchanged during 80 hours of testing
with dry fuel, as shown in Fig. B-1. In contrast, the measured transfer pump pressure and total
fuel delivery changed dramatically after only 8 hours of testing with &q fuel. In addition, the
interior of the pump that had been operated on wet fuel had an oxide coating, confirming the
presence of a corrosive wear mechanism.
* Underscored numbers in parentheses refer to the list of references at the end of this appendix.
Figure E.I. rumn o.eratlna characteristics measured hduAntets& with Fel A(Jet A-1) with and without the Drelence of moisture
59
The transfer pump pressure measured during a previous full-scale pump stand test with Jet A-I
In an open reservoir (.1) Is also plotted in Fig. B-1. The decrease in transfer pump pressure In
this test is less severe than with saturated fuel, probably due to the intermediate moisture content
in the absence of bulk water. At relative humidity values less than 100 percent, the amount of
water dissolved in the fuel will be cotiespondingly less than the saturation values, in accordance
with Henry's Law. The average relative humidity during this test was 63 percent.(,W This
proportional relationship between relative humidity and measured wear is in qualitative agreement
with the lightly loaded region of the wear map in Fig. 1, of the main report. The post-test
operating characteristics of the pumps were not evaluated using a test stand, due to the very
severe wear present on Pump No. 2 and the fact that both pumps were reconditioned,
C. Effect of Lubricity Additive on Corrosive Weo, Under Saturated Moisture
Previous reports noted that the addition of additives qualified under MIL-I-25017 to form JP-8
greatly reduced corrosive wear under conditions of slight, but unknown humidity.(I) However,
the effects of these additives on full-scale pump wear under more severe, saturated moisture
conditions are unknown. As a result, 200-hour tests were performed using Pump Nos, 5 and 6
(TABLE 1 of the rm•ain report) with moisture-saturated Jet A.- 1 containing 20 mg/L DCI-4A
corrosion-inhibitor additive. This additive is qualified under MIL-I-25017 and is formulated from
dilineolic acid, effectively corresponding to JP-8 aviation turbine fuel.
The addition of corrosion-inhibitor additive greatly improved the pump's durability under the
present operating conditions. The pump operating characteristics measured during the 200-hour
test are plotted in Fig. B-2. Th9 measured transfer pump pressure decreased over the first
100 hours for both pumps. The decrease observed is marginally greater than that seen with dry
Jet A-1, but is appreciably better than neat Jet A-I under similar damp conditions. The fuel
delivery rate decreased by approximately 10 percent for the arctic pump but remained constant
for the standard unit, This decrease was also evident in the post-test engine power curves shown
in Appendix E of this report, and the post-test pump calibration stand measurements in
Appendix C. However, in each instance, the pump operating characteristics measured on the
60
95
-Standard Pump-- Arctic Pump
I. IFV - • ... .,85
75 . I ,0 50 100 150 200
Tat Duration (Hours)
a. JTMnfer Pump Pressure
so58 -- Standard Pump
..-Arctic Pump
54
~52
48
40 .2 .' "'.,., .' ,.. . .,. .
0 so 100 150 200
Test Duration (Hours)
b. Total Pump Delivery
Figure B-2. Pump overatIng characteristics with FelI B UP-8)
with moisture Dresent
61
calibration stand remain within the manufacturer's specifications after 200 hours of operation on
wet JP-8, as detailed in Appendix D. Clearly, the corrosion inhibitors remain effective at high
fuel moisture content.
D. Effect of TemRerature on PumD Wear Under Saturated Moliture Conditions
As previously stated, U.S. Army ground forces have used Jet A-I and Arctic diesel fuel (DF-A)
on compression-ignition equipment in Alaska for many years, with no apparent durability
problems, The decreased wear under arctic conditions may be due to the low ambient
temperatures combined with reduced atmospheric moisture. Temperature is likely to have a
significant effect on pump wear, as hydrodynamic and elastohydrodynamic lift provide partial
or complete separation among many components. Furthermore, the oxidation rate of the metallic
surfaces during corrosive wear is likely to be defined by an Arrhenius equation and the
availability of moisture (4), both of which are highly temperature dependent. In an attempt to
evaluate the importance of this effect, full-scale pump stand wear tests were performed using
Pump Nos. 7 and 8 with unheated fuel, producing an inlet temperature of approximately 320C
(90*F) throughout the test. As in the preceding pump tests, 4 liters of water were placed at the
bottom of the 1,000-liter Jet A-1 reservoir to simulate condensation and to facilitate
oxidative/corrosive wear.
Very severe degradation in performance was observed with the standard injection pump at this
temperature. Pump delivery increased gradually during the first 25 hours of operation, due to
wear between the roller shoes and blade spring, as shown in Fig. B-3. Transfer pump pressure
decreased gradually over the same time period. However, a dramatic decrease in transfer pump
pressure occurred after approximately 26 hours with a corresponding decrease in fuel delivery,
due to very severe wear of the transfer pump blades. In addition, it is likely that the pump
blades stuck in the rotor, as occasional resistance was felt if the pump shaft was manually
rotated. Little or no wear was present on the arctic blades, and the engine test characteristics of
the arctic pump remained unchanged, as shown in Appendix E. No post-test engine evaluation
was performed on the standard pump due to the very severe wear present. A more detailed
62
100
S 95
j80
-7Std. Pum' 75 -. rctic PumnJ
70 A,.I.,1..
aso
-8 ....tP Arctic Pump
70 " -"-•'' ' . . . . = . . ............ .•
A52~50
443
0 5 10 15 20 25 30
Test Duration (Hours)
b. Pump Delivery
Figure B-3. ....perating characteristics at ambient temperature withFuel A (Jet A-1) with moisture present
63
description of the wear rate as well as comparison with the remaining pumps is given in
Appendix D.
The wear rate observed in the present test with no in-line fuel heater was at least as severe as
that observed in the preceding tests at 790C (175 0F) with Jet A-1. However, the quantity of
dissolved moisture in the fuel is likely to be defined by the temperature of the reservoir, as no
additional moisture is availat)le after the fuel enters the pump stand system. The temperature of
the fuel reservoir was approximately 32 0C (900F) in tests performed at both ambient and high
temperatures. This temperature is likely to be well above the fuel storage temperatures present
under arctic conditions, even in an operating vehicle. Thus, the availability of moisture within
the pump is greatly increased. The effects of moisture content on wear are evaluated in more
detail using laboratory wear tests for a range of fuels in Appendix G.
E. Effect of Break-In With Good Lubricity Fuel
The initial period of operation, or break-in, is the most critical period in the life of many
contacts. Mild wear during this period may produce a smooth conforming interface between the
opposing surfaces, reducing the asperity tip contact pressure.. In many instances, surface chemical
films may also have a finite initiation time or temperature before effective boundary lubrication
begins.
Jet A-1 produces severe wear, compared to regular DF-2 diesel fuel over an extended test
duration. However, the effects of occasional operation or an initial break-in penod with good
lubricity fuel are unknown. Full-scale puAnp tests were performed using clay-treated Jet A-I after
an initial break-in period of 50 hours using DF-2. These tests were pcrformed using Pump
Nos. 3 and 4 in ambient humidity conditions of approximately 65 percent. The wear scar
diameter obtEhed using the BOCLE test was 0.55 mm for the diesel fuel and 0.71 mm for the
clay-treated et A-I fuel.
64
Pump delivery remained constant during the initial 50 hours of testing with diesel fuel, as shown
in Fig. B4. However, conversion to Jet A-1 immediately affccted pump delivery, due to its
reduced viscosity compared to diest.l (1.3 versus 3 cSt eA 40°(7), which promotes internal pump
leakage. Reduced delivery with Jot A-1 has already been noted for new pumps (Appendix E)
and is independent of fuel lubricity and wear. After several hours of operation, the total pump
delivery recovered, due to wear of the roller shoes at the leaf spring contact, as shown in
Fig. B-5. The comparatively mild wear on a similar component after 200 hours of operation in
JP-8 is shown in Fig. A-5b for comparison. Wear at this point increases the stroke of the
plungers witb a concomitant increase in pump output. It should be noted that this component
is not available with an improved metallurgy, producing similar, severe wear in both arctic and
standard pumps.
A dramatic decrease in the transfer pump pressure on the standard unit was observed after only
4 hours of operation on neat Jet A-1, due to wear of the standard pump blades. The test was
terminated after 8 hours of operation on neat Jet A-I (a total of 58 hours). No change in transfer
pump pressure was observed for the arctic pump unit that contains the improved metallurgy, and
little or no wear was present on disassembly. Comparison of measurements taken prior to and
after termination of the test indicates that approximately 0,133 mm (0.00525 in.) of wear occurred
on the face of the standard transfer pump vane, compared with only 0.0051 mm (0.0002 in.) for
the arctic metaflurgy. Indeed, the dimensions of the standard pump blades were less than the
manufacturer's recommended minimum after only 8 hours of operation with Jet A-1. A more
detailed discussion of the measured wear rate is provided in Appendix D.
The initial 50 hours of operation with diesel had no quantifiable effect on subsequent operation
with damp, neat Jet A-I fuel. Wear of the standard pump during the subsequent 10-hour test was
greater than that previously seen during 80 hours of operation with the same Jet A-1 fuel in dry
ambient conditions. Disassembly of both pumps indicated that a golden film of iron oxide was
present, causing both the cam ring and metering valve to bind.
65
60 -Std. Pump-...Arctic Pump
58
156
IlIl 54
48
0 10 20 30 40 50 80
Test Duration (Hours)
i. Fuel Delvery
120
,- 115
1G S -- -- - --
[00:
95 -Std.Pump-Arctin Pump
90 I I I
0 10 20 30 40 50 60
Test Duration (Hours)
b. Transfer Pump PressureFigure B-4. Pump operating characteristics during Initial break.in,_th_.diesei fuel
(Fuel F) and subsealent oaeration with Jet ,& (Fuel Al
66
a. Severe Wear on Neat b. Mild Wear After Extended
Jet A-1 Operation on JP-8
Figure B-5. View of wear scar on pump roller shoe
F. List of References for Appendix B
1. Lacey P.I., "The Relationship Between Fuel Lubricity and Diesel Injection System Wear,"Interim Report BFLRF No. 275 (AD A247927), prepared by Belvoir Fuels and LubricantsResearch Facility (SwRI), Southwest Research Institute, San Antonio, TX, January 1992.
2. Lacey, P.I., "Effect of Low-Lubricity Fuels on Diesel Injection Pumps - Part II: LaboratoryEvaluation," SAE Technical Paper No. 920823, February 1992.
3. Handbook of Aviation Fuel Properties, CRC Report No. 530, Coordinating Research Council,219 Perimeter Center Parkway, Atlanta, GA, 1983.
4. Kubaschewski, 0. and Hopkins, B.E., "Oxidation of Metals and Alloys," Butterworths,London, 1962.
67
APPENDIX C
Pump Calibration Stand Results
69
PUMP CALIBRATION STAND RESULTS
As in the previous study,* each of the pumps were precisely calibrated according to manufacturer
specifications, which typically include some tolerance. As a result, the exact values were
recorded for comparison with the post-test measurements with the results shown in TABLES C-I
through C-4.
It should be noted that Pump Nos, I and 2 (Model Nos. DB2829-4524 and DB2829-4523,
standard and arctic units, respectively) conform to slightly different specifications than the
remaining pumps, which have different model numbers (Model Nos. DB2-4979 and DB2-4980,
standard and arctic units, respectively), A number of the pumps were judged to have failed
during testing, i.e., Pump Nos. 1, 2, and 7, and were not recalibrated using the test stand. Neither
of the two rebuilt pumps was calibrated using the test stand because of the relatively short nature
of the tests performed.
The test stand conformed to ISO 4008 with SAE 0968/ISO 7440 calibrating injectors. The
calibration fluid was Viscor conforming to SAE 0967/ISO 4113, The fluid supply temperature
to the pump was maintained between 430 to 46*C (1100 to 1 151F) at a pressure of 5 * 0.5 psi
(34.5 * 3 kPa).
Each pump was operated for 10 minutes prior to calibration to allow the system to stabilize. The
computerized stand provided a digital readout of pump delivery per stroke at the required test
speeds, eliminating errors. Injection advance is measured by a mechanical attachment that
follows the movement of the cam ring (commonly known as a bat wing gauge).
* Lacey, PI., "The Relationship Between Fuel Lubricity and Diesel Injection System Wear," Interim Roport BFLRF
No. 275 (AD A247927), prepared by Belvoir Fuels and Lubricants Research Facility (SwRI), Southwest ResearchInstitute, San Antonio, TX, January 1992.
and rotor retainer are plotted in Fig. D-2a, while the highly loaded drive tang, drive slot, and
roller shoe are plotted in Fig. D-2b. A logarithmic scale is used due to the very large variation
in wear rates observed. In each instance, the results are plotted by fuel category from both this
and preceding reports where applicable. This procedure decreases random variation by allowing
79
10000 77.
1000... ..... . W eights. .. ........ Rotor....... Retainer........
100000Gv egt
1000 ~ ~ ~ ~ ...... .......~ . rieSo........ .. .. ......... ... R o l l er S het i e
100
b. Highly... Lod. Pump.Component.Figure .-2 W ear m......me.. .r~~ i .iid a ....... .. u ne t with .. ................. .
0.80
averaging within similar categories, as detailed in TABLE D-2. The erratic wear measurements
obtained for the thrust washer are. not included.
TABLE D-2. Description of Fuel Categories Used in Figs. 2 (Main Report) and D-2
Fuel Type Description of Test Fuels Considered
Wet Jet A-I Average measurements obtained from Pumps Nos. 2 and 7, with Fuel A.Nonarctic components from Pump No. 8 are also considered. The fuel wassaturated with dissolved moisture.
Damp Jet A Average measurements obtained from nonarctic components in Pump Nos. 3,4, I a, and 2a. Refers to pump stand tests in which the moisture content wasnot controlled and depended solely on atmospheric humidity.
Dry Jet A Pump No. 3. The fuel was blanketed in dry air.
Wet JP-8 Average measurements obtained from Pump No. 5, with Fuel B. Nonarcticcomponents from Pump No. C6 are also considered. The fuel was saturatedwith dissolved moisture.
Damp JP-8 Average measurements obtained for nonarctic components in Purhxp Nos. 3a,4a, 5a, and 6a, with Fuel B. Refers to pump stand tests in which themoisture content was not controlled and depended solely on atmospherichumidity.
Diesel Average measurements obtained for nonarctic components in Pump Nos. 7aand 8a, with Fuel D.
B. Qualitative WAar Measurements
The preceding section described quantitative wear measurements on s,,ven pump components.
Previous reports in this series developed a qu=.Zitative rating that could be applied to the
numerous sliding contacts within each pump.(., 3, 4) in this procedure, each component is
assigned a numerical rating between 0 and 5, with 0 corresponding to no wenr and 5
corresponding to severe wear and failure. The results obtained trom this process are provided
in TABLE D-3.
81
TABLE D-3. Subjective Wear Level* on Critical Pump Components
Pump l: Rebuilt, 80 hours with Jet A-1 in dry air,Pump 2: Rebuilt, W0 hours with wet Jet A-I.Pump 3: New pump, 50 hours with diesel and 8 hours with Jet A-1.raimp 4: New pump, 50 hours with diesel mad 8 hours with Jet A-I.Pump 5: New pump. 200 hours with wet JP-9.Pump 6: New pump, 200 hours with wet JP-8.Pump 7: New Pump, 26 hours with damp Jet A-I at 901F.Pump 8: New Pump, 26 hours with damp Jet A-I at 90F,
However, unlike the previous reports, many of the pump tests discussed in the present study were,
terminated prematurely, as summarized in Appendix B. The different operating times
82
experienced by the pumps could not te accounted for, severely limiting the information available
from simple qualitative analysis. Nonetheless, it is clear that the quantitative wear measurements
on isolated components described in the preceding section are in good qualitative correlation with
the remainder of the pump, i.e., severe wear was produced in a short period of time with
unadditized moist fuel. By comparison, relatively mild wear was observed for Pump Nos. 5 and
6, which operated for a longer time period on moist fuel containing a lubricity additive (i.e.,
JP-8).
The transfer pump blades were among the components most affected by fuel lubricity. A very
deep wear track was present on the standard pump blade after only 26 hours of operation on neat
Jet A-i, as shown in Fig. D-3a, while only mild polishing was present on the arctic component
in Fig. D-3b under the same conditions. By comparison, little or no wear is present on either
the standard or the arctic blades after 200 hours of operation on JP-8, as shown in Figs. D-3c and
D-3d, respectively.
The pump blades are lightly loaded but have a high sliding speed, with a correspondingly large
sliding distance. Such conditions appear to maximize the effects of oxidative/corrosive wear.
It is likely that high sliding speeds rapidly remove the surface oxide layer and provide nascent
material that maximizes the oxidation reaction. Lower sliding speeds would allow formation of
a thicker oxide layer. However, the reaction rate for the oxidation process decreases rapidly with
increasing thickness due to the necd for oxygen to diffase throagh the oxide layer to the metallic
substrate.L., M) The decrease in rewtion rate may follow a logarithmic, asymptotic, or parabolic
law, depending on metallurgy and temperature.
83
a. Pump 7 (Wet Jet A-I/Standard) b. Pump 8 (Wet Jet A-i/Arctic)
c. Pump 5 (Wet JP-8/Standard) d. Pump 6 (Wet JP-8/Arctlc)
Figure D-3. Comparison of wear scars on puflID blades
C. List of References for Apoendix D
1 . Lacey P.I., 'The Relationship Between Fuel Lubricity and Diesel Injection System Wear,Interim Report BFLRF No. 275 (AD A247927), prepared by Belvoir Fuels and LubricantsResearch Facility (SwRI), Southwest Research Institute, San Antonio, TX. January 1992.
2. Archard, I.F., "Contact and Rubbing of Flat Surfaces," Journal of Applied Physics, 24,pp. 981-988, 1953.
84
3. Lacey, P.I. and Lestz, S.I., "Failure Analysis of Fuel Injection Pumps From Generator SetsFueled With Jet A-1,' Interim Report BFLRF No. 268 (AD A234930) prepared by BelvoirFuels and Lubricants Research Facility (SwRI), Southwest Research Institute, San Antonio,TX, January 1991.
4. Lacey, P.I., "Wear Analysis of Diesel Engine Fuel Injection Pumps From Military GroundEquipment Fueled With Jet A-i," Interim Report BFLRF No. 272 (AD A239022), preparedby Belvoir Fuels and Lubricants Research Facility (SwRI), Southwest Research Institute, SanAntonio, TX, May 1991.
5. Kubaschewski, 0. and Hopkins, B.E., "Oxidation of Metals and Alloys," Butterworths,London, 1962.
6. Evans, U.R., "The Corrosion and Oxidation of Metals: Scientific Principals and PracticalApplications," St. Martins Press Inc., New York, 1960.
85
ADDENDUM I
CALCULATION OF ARCHARD'S WEAR COEFFICIENT ONPUMP COMPONENTS
A. Wear Measurements an Transfer PMIP Blades
A reciprocating action is formed between the rotor and the transfer pump blade. This action
forms a wear scar with a sharp step at the limit of the cycle. The depth of the wear scar was
measured at this step using a Talysurf 10 profilometer. Scar depth was assumed to decrease
linearly across the contact area, and the wear volume was calculated accordingly. An improved
metallurgy is available in the arctic pump vanes, and the appropriate indentation hardness was
used in calculating Archard wear coefficient as detailed in TABLE D-4. The cumulative sliding
distance was calculated for an eccentricity of 4 mm.
Note: Hardness of Arctic Pump Vanes, Hv = 750
Hardness of Standard Pump Vanes, Hv = 460
Sliding Distance in 200 Hours, km = 173
Approximate Contact Load, kg = 0.36
TABLE D-4. Wear Measurements on Transfer Pump Blades
Wear Scar DimensionsMax Depth, Final Area, Volume, Wear Coefficient,
Rated Torque, Nm (ft-lb) 325 (240)Engine Structure Cast Iron Head and Block (No Cylinder Liners), Aluminum Pistons
Injection System Stanadyne DB-2 F/I Pump With Bosch Pintle Injectors
* Lacey, P.1., "The Relationship Between Fuel Lubricity and Diesel Injection System Wear," Interini Report BFLRF No. 275 (AD A247927),prepared by Belvoir Fuels and Lubricants Research Facility (SwRI), Southwest Research Institute, San Antonio, TX, January 1992.
"t "Accelerated Fuel-Engines Qualification Procedures Methodology Engine Test 210-Hour Wheeled Vehicle Cycle Using the GM 6.2L DieselEngine Operating on JP-8 Fuel," prepared by U.S. Army Fuels and Lubricants Research Laboratory, Southwest Research Institute, San Antonio,TX, October 19F
.o.. . J t A 1 / P 8 ........................... .......................................
-2 0 ....... 0.... 2 0t 4 0 P -4 .... 0... 100..........................-.....................J e t ~e p e a t r (C)........ .. .................... ... ... ..................
Figure ........ W.......r. .........v .er......a...for ai.r..fu l
Previously,.. nonstandard ... wea..... tests......... wer performed at higher.. tepraue than.... those....of.
the.... present.. rep..... ...... H ow ver erratic...... test. result were.. obtine fo cla.tr ate Jet....... A..... ............ . Other....workers.. have..... also. observe this.... ef.c and. sugs that.t.my.b.dueto.ompeitin.bewee
Figure I--1. Data obtained during BOCLE scMuffinB load wear test verformedaccordin. to Procedure C with fuels detailed in TABIE 2 of main report
121
*Fuel A-+-FuelB.oFuel J
0.6 -,-Fuel C-,.Fuel E*Fuel G-,,-Fuel F
0.5 --Fuel I5 -,-Fuel H-+.Fuel M
0.4 -'-M
'~0.3
0.2
0.1 , , , I . . I , I, ' ' ' , ,
0 1000 2000 3000 4000 5000 6000
Applied Load (g)a. Wear Scar Diameter
0.4 - Fuel A• .-Fuul B-a- Fuel J..-Fuel C-,-Fuel E
0.3 -. Fuel G.. Fuel F.-*Fuel I-Fuel H"+Fuel M
c~0.2 .
0.1
00 1000 2000 3000 4UO0 5000 6000
Applied Load (g)
b. Friction Coefficient
Figure H-2. Data obtained durinE BOCLE scuffing load wear test oerformedaccordlmU to ProcEdure D with fuels detailed In TABLE 2 of main report
122
o Fuel ASFuel B
.. Fuel J
j/•-Fuel E
0.5 N
0.g "4•Ful (0,-Fuel FS0.8 . -,FuellI
-,-Fuel H-,7' -Fuel M
S0.7
0 .5
0.4
0.3 .
0.2 - ---0 s0 100 150 200 250
Applied Load (g)
Figure H-3. Data obtained durin. Cameron-PUnt scuffina load wear tests nerformedaccordina to Procedare P with fuels detale In IALE 2 of main renort
123
APPENDIX I
Caloulation of Hertzlen Contaot Diameter
125
CALCULATION OF HERTZIAN CONTACT DIAMETER
The geometrical contact area formed by two normally loaded counterformal contacts may be
calculated using the Hertzian equations as described in Wear Control Handbook, 1980. The
analysis assumes that the surfaces are perfectly smooth, the effects of tangential loading and
friction are negligible, and that the deformation is elastic (rather than plastic).
The ball-on-cylinder geometry formed in the BOCLE produces an elliptical contact. A simplified
technique to derive the major (a) and minor (b) axis dimensions produced by two contacting
solids with different radii of curvature in a pair of principal planes (x and y), is as follows:
a (6*K2*E*w*R,) ] 0,333
0,333
b (6*F*w*R,),[(7c *E*K)J
Where: K = 1.0399(Rx/Rý)0' 636
Rx = (I/Rxl + 1/Rt2)-YRY = (l/Ry1 + l/Ry2)"1
R, = (l/Rx + l1RY)-
F = 1.0003 + 0.59681(R/Rx)
w = Applied Load (N)E = 2 [(1-,u1
2)/E1 + (1-'U 2 )/E2]
For the contact geometry formed by the BOCLE:
E = 0.227*106 N/mm2
Rxl = Ry, = 6.35 mm
Rx2 = 24.5 mm
Ry2 = aw = 9.81 N.
127
For an initial applied load of I kg, the length of the sernmiajor and semiminor axis formed during
the BOCLE test are 0.16 and 0.135 mm, respectively. The mean contact pressure is predicted
to be 578 N/mm 2.
The radial contact deformation at the center of the contact may be calculated from the following
equation:
G[( *RS*F 3* w ) 003
1 (-i ) ( ic KE
where F 1.5277 + 0.6023in(R/Rx).
For the standard contact conditions in the BOCLE test, the calculated radial contact deflection
is 0.19 Pm.
128
APPENDIX J
Charaoterlstls of Test Surfaces
129
CHARACTERISTICS OF TEST SURFACES
Ring specimens of varying roughness were obtained by successively polishing the surface of
ASTM standard test ring to obtain the required finish. (Note: The original surface finish on
many test rings was marginally greater than that specified in ASTM D 5001.) The test rings
were initially treated using 600-grit abrasive paper, followed by crocus cloth and finished using
successively finer grades of diamond lapping paste. The duration of each step was varied,
depending on the finish required. Particular attention was given to the polished srtcimen to
ensure a repeatable mirror finish, free of waviness and blemishes. The ring must be maintained
perpendicular to the cloth during treatment to prevent formation of bevelled ecdges.
Surface roughness was measured using a Talysurf i0 profilometer with a stylus tip width of
0.0025 mm. The trace was taken over 7 mm of surface and filtered with a cut off of 0.25 mm
to remove long wavelength undulations. This value approximates the wear scar diameter of many
scuffing load tests. A segment of the surface trace and corresponding height density/distribution
(bearing area) is shown in Figs. J-1 through J-5 for each of the ring types used in the present
study. (Note: Traces for the most highly polished specimen are not included as little surface
roughness was apparent.)
The probability distribution (bearing area curve) represents the fraction of solid material [P(z)]
lying above a certain datum (z) and may be defined as:
with P(--o) = 0 and P(-o) = 1.
The probability density function [p(z)] is the first derivative of the probability distribution and
can be defined as p(z) = dP(z)/d(z) and a gaussian or normal distribution is given by:
131
P(Z) ý- exp
with cH Rq.
The Root Mean Square (Rq), skewness (Rsk), and kurtosis (Rk) of the profile height distribution
are also provided, and may be defined as follows:
Rq = .H .x -oz p(z)d(z)
Ri/c . l/aH.'z p(z)d(z)
R Z p(z)d(z)
132
.. . ........ .. ... U
NO (O)1149
Mi I
F.
I
ie4
II .6.11J
(WO 141Hiff)VWC
II133
...k x-
I -
CO .~".
ca cm C
Wi- ) 0 '1 £ *'..P*"',
1* cia ' a ~134i a. *£
4. .. ... ..... ..,
113
APPENDIX K
Suggested Test Procedure for Measurement of SouffingLoad Capacity Using the Ball-on-Cylinder Lubricity Evaluator (BOCLE)
137
THE U.S. ARMY SCUFFING LOAD WEAR TEST
Suggested Test Procedure for Measurement of Scuffing Load CapacityUsing the Ball-on-Cylinder Lubricity Evaluator (BOCLE)*
01 January 1994
* hI : The following Is a draft test procedure. This test procedure Is based onASTM D 5001 and contains changes made solely by the Beivoir Fuels andLubricants Research Facility (BFLRF). Comments, additions, and changesshould be addressed to Dr. P.I. Lacey, Belvoir Fuels and Lubricants ResearchFaoilIty (SwRI), Southwest Research ilstitute, P.O. Drawer 28510, San Antonio,Texas 78228-0510.
1. Scope1.1. This test method assesses the severe wear aspects of the boundary lubrication properties of
fuels intended for use in compression ignition equipment on rubbing steel surfaces,
1.2. The values stated in SI units are to be regarded as the standard.
2. Referenced Documents2.1. ASTM Standards:
D 329 Specification for Acetone1
D 770 Specification for Isopropyl Alcohol1
D 1016 Test Method for Purity of Hydrocarbons From Freezing Points2
D 4306 Practice for Sampling Aviation Fuel for Tests Affected by Trace Contamination3
2.2. Military SpecOfcation:MIL-I-25017, Inhibitor, Corrosion/Lubricity Improver, Fuel Soluble 4
2.3. American Iron and Steel Institute Standard:
AISI E-52100 Chromium Alloy Steel5
2.4. American National Standards Institute Standard:
ANSI B3.12, Metal Balls6
2.5. Society of Automotive Engineers Standard:
SAE 8720 Steel7
3. Terminology3.1. Descriptions of Terms Spec(flc to This Procedure:
3.1.1. Cylinder--the polished test ring and mandrel assembly.
3.1.2. Lubricity-a property of the fluid, measured by the minimum applied load, in
grams, that will produce a transition from mild boundary lubricated wear to adhesive scuffing between
a stationary ball and a fluid-wetted rotating ring operating under closely controlled conditions.
4. Summary of Test Method4.1. The fluid under test is placed in a test reservoir in which atmospheric air is maintained at
50% relative humidity. A nonrotating steel ball is held in a vertically mounted chuck and forced against
an axially mounted polished steel ring. The applied load is increased until a disproportionate change infriction and wear is observed. Any sequence of increasing loads may be selected to most efficiently define
I AnnoW Book of ASTM Standrds, Vol 06,03.2 AnnuWo Book of ASTM Standards, Voli 05.01 and 06.03.3 Annual Book of ASTM Standards, Vol 05.03.4 Available from Naval Publications and Form Center, 5501 Tabor Ave., Philadelphta, PA 19120,5 Available from American Iron and Steel Inatitute, 1000 16th Street. NW. Wuhlngton. DC 20036.6 Available from American National Standards Instltute, 1430 Broadway, New York, NY 10018.7 Available from Society of Automotive Engineen, Inc., 400 Commonwealth Ave., Warren, PA 15096,
141
the point at which either friction or wear exceeds defined limits. The fuel is not renewed between loadincrements during a normal test sequence, The test cylinder is rotated at a fixed speed while beingpartially immersed in the fluid reservoir. This partial immersion maintains the cylinder in a wet conditionand continuously transports the test fluid to the ball/cylinder interface. The minimum applied loadrequired to produce a transition to severe friction and wear is a measure of the fluid-lubricating properties.
5. Signlflcance and Use5.1. Severe wear resulting in shortened life of components on compression-ignition engines such
as fuel pumps has sometimes been ascribed to lack of lubticity in highly refined fuel.5.2. The relationship of test results to rotary fuel injection pump distress due to wear has been
demonstrated for some fuel/hardware combinations in which boundary lubrication is a factor in theoperation of the component.
5.3. The scuffing load capacity in the Ball-on-Cylinder Lubricity Evaluator (BOCLE) test issensitive to contamination of the fluids and test materials, the presence of oxygen and water in theatmosphere, and the temperature of the test. Lubricity measurements are also sensitive to trace materialsacquired during sampling and storage. Containers specified in Practice D 4306 shall be used.
5.4. Initial tests with many different procedures indicate that correlation achieved with full-scaleequipment may be affected by viscosity, particularly if viscosity is below approximately 1.8 cSt at 40*C.
5.5 Simpliflcation of Procedure5.5.1. If desired, the incremental.load procedure described in Section 10 may be modified
to a single-load test at a test load to be defined,5,5,2. The single-load test has been found to approximate full-scale equipment needs and
to provide a simple pass/fail result.5.5.3. The single-load test does not provide a quantitative ranking of fuels in either the
6.1.1. The test requirements are listed in TABLE K-1,86.1.2, If possible, the apparatus should facilitate accurate measurement of tangential
friction. However, accurate determination of scuffing load capacity is possible without frictionmeasurement,
6,1.3. The inclusion of a small splash guard within the fluid reservoir is necessary toprevent loss of fluid from the joint between the reservoir cover and reservoir.
6.2. Constant Temperature Bath-Circulator, capable of maintaining the fluid sample at 250 t I Cwhen circulating coolant through the base of the sample reservoir.
B BOCLE units, BOC 100, made by InterAv, Inc., P.O. Box 792228, San Antonio, TX 78279 have been found to be satisfactory.
Fluid pretreatment 0.50 L/min air flowing through and 3.3 L/mainover the fluid for 15 min.
8.1 ft3/hr = 3.8 L/min.Fluid test conditions 3.8 L/min flowing over the fluid.
Applied LoadBreak-In Period 500 gIncremental-Load Test 500 to 8,000 gSingle-Load Test To be defined
Cylinder Rotational Speed 525 t I r/minTest Duration
Break-In Period 30 secScuff Tests 60 sec
*Note: 50% humidity should be achieved using " volumes of dryand saturated air.
6.3. Microscope, capable of 100x magnification in graduations of 0.1 mm and
incremented in divisions of 0.01 mm.
6.3.1. Glass Slide Micrometer, with a scale ruled in 0.01 mm divisions.9
6.4. Cleaning Bath-Ultrasonic seamless stainless steel tank with a capacity of 1.9 L
(0.5 gal) and a cleaning power of 40 W.
7. Reagents and Materials7.1. Test Ring, of SAE 8720 steel, having a Rockwell hardness "C" scale (HRC) number of 58 to
62 and a surface finish of 0.015 pmn root mean square. The remaining dimensions are similar to that
described in ASTM D 5001.107.2. Mandrel, a 10' tapered short cylindrical section used for holding test ring.11
9 Catalog No. 31-16-99 from Banach and Lomb, Inc. has been found satisfactory, A certificate of traceability from the National Institute ofStandards and Technology is available,
10 Test RiMngs, Part No. P25061 from Falex Corp,, 2055 Comprehensive Drive, Aurora, IL 60505, have been found satisfactory If polished to
the required surface finish using only the procedure defined by the U.S. Army Belvoir Fuels and Lubricants Research Facility, P,O. Drawer 28510,San Antonio, TX 78228, Correct surface finish is central to teot accuracy.
I1 Mandrel, Pat No. M-O from Palex Corp., or P/N BOC-2101 from InterAv. Inc,, P.O, Box 792228, San Antonio, TX 78279, his been foundsatisfactory.
143
7.3. Test Ball, chrome alloy steel, made from AISI standard steel No. E-52100, with a diameter
of 12.7 mm (0.5 in.) grade 5 to 10 EP finish. The balls are described in ANSI Specification B3.12. The
extra-polish finish is not described in that specification. The HRC shall be 64 to 66, a closer limit than
found in the ANSI requirement. 12
7A4. Compressed Air, containing less than 0.1 ppm hydrocarbons and 50 ppm water.
7.5. Desiccator, containing a nonindicating drying agent, capable of storing test rings, balls, and
7.8. Isooctane, conforming to Test Method D 1016,95% purity minimum, 2,2,4-trimethylpentane.
7.9. Isopropyl Alcohol, conforming to Specification D 770,
7.10, Acetone, conforming to Specification D 329.
7,11. Reference Fluids.7.11.1. Fluid A-Shall be Reference No, 2 (Cat 1-H) diesel fuel. 13 Store in borosilicate
glass with an aluminum foil lined insert cap. Store in dark area,
7.11.2. Fluid B-Shall be a narrow-cut isoparaffinic solvent.14
8. Preparation of Apparatus8.1. Cleaning of Apparatus and Test Components:
8.1.1. Test Rings:
8.1.1.1. The test rings shall be partially stripped of any wax-like protective coatings
by manually rubbing them with rags or paper towels saturated with isooctane.
8,1.1.2. Place partially cleaned rings in a clean 500-mL beaker. Transfer a
sufficient volume of a 1 to 1 mixture of isooctane and isopropyl alcohol to the beaker such that the test
rings are completely covered.
8.1.1.3. Place caker in ultrasonic cleaner and turn on for 15 mmn.
8.1.1,4. Remove test rings and repeat ultrasonic cleaning cycle of 8.1.1.2 and
8.1,1.3 with a clean beaker and fresh solvents.
8.1.1,5. Handle all clean test rings with clean forceps or disposable gloves.
Remove test rings from beaker and rinse with isooctane. Dry. Rinse with acetone.NOTE 1: Drying operations can be accomplished using a compressed air (7.4) Jet at 140 to 210 kPa (20 to 30 psi)
pressure.81.1.6. Dry and store in a desiccator,
12 Test BIls, SKP Swedish. Part No, 310995A, RB 12,7, grsde S to 10 EP Finish, AISI 52100 Alloy from SKF Industries, Component Systems,1690 Beast Ruce Street, Allentown, PA 90653, have been found satisfactory.
13 Available from Howell Hydrocarbons. P.O. Box 429, Channelvlew, TX 77530.14 Solvent Is ISOPAR M, tanuf' aund by the Exxon Company, USA, P.O. Box 2180, Houston, TX 77001.
144
8.1.2. Test Bolls 7s Received.
8.1.2.. -,R ils in 300-mL beaker. 'iisfer a sufficient volume of a 1 to 1mixture of isooctane and isopropyl alotiA1 to the beaker such that the test balls are completely covered
by the cleaning solvent.NOTE 2: Approximately a 5-day supply can be processed at one time,
8.1.2,2, Place beaker in ultrasonic cleaner and turn on for 15 min.
8.1.2,3. Repeat the cleaning cycle, of 8.1,2.1 and 8.1.2.2 with a clean beaker and
fresh solvent,
8,1.2.4, Remove and rinse with isooctane, dry, rinse with acetone.8.1.2.5. Dry and store in a desiccator.
8.1.3. Reservoir, Reservoir Cover, Ball Chuck, Ball Lock Ring, and Ring MandrelAssembly Components:
8.1.3,1, Rinse with isooctane.
8.1.3.2, Clean for 5 min. in an ultrasonic cleaner with a I to 1 mixture of isooctaneand isopropyl alcohol.
8.1.3,3, Remove and rinse with isooctane, dry, rinse with acetone.8.1.3,4, Dry and store in a desiccator.
8,1.4. Hardware:
8.1,4,1, The hardware and utensils, that is, shaft, wrenches, and tweezers, that comein contact with the test fluid shall be cleaned by washing thoroughly with isooctane and wiping with a
lint-free cloth,
8.1.4.2. Store parts in desiccator when not in use,8,1,5, After Test:
8.1.5.1, Remove reservoir and cylinder.8.1.5.2. Disassemble components and clean for 5 min, in an ultrasonic cleaner
using a I to 1 mixture of isooctane and isopropyl alcohol. Rinse with isooctane, dry, rinse with acetone.
Reassemble components.
8.1.5.3, Dry and store in a desiccator.
8.1.5A4. Care shall be taken to ensure that the fuel aeration tube is rinsed and driedduring the cleaning procedure, Store parts in desiccator when not in use.
9. Calibration and Standardization9.1. Visually inspect test balls and rings before each test. Discard specimens that exhibit pits,
corrosion, or surface abnormalities,
9.2. Reference Fluids:
9.2.1. Test each new batch of the reference fluids and verify machine accuracy inaccordance with Section 10.
9.2.2. The machine calibration should be verified once every twelve tests.
145
9.2.3. If desired, thc test, need only be 14;rformed at the two loads defined in Section 9.2.6to verify test performance and accuracy.
9.2.4. Additional tests are necessary if the scuffing load capacities on Reference Fluids A
and B lie outside the acceptable range.9.2.5. Calculate the scuffing load capacity (SLC) in accordance with Section 13,0.9.2.6. The following reference fluid values are preliminary: No scuffing shoaid be
produced at 4,500 and 900 g with Reference Fluids A and B, respectively. Scuffing should be produced
at 5,100 and 1,400 g with Reference Fluids A and B, respectively.9.3. Leveling of Load Arm:
9.3.1. The level of the load arm shall be inspected prior to each test. Level the motorplatform by use of the circular bubble level and adjustable stainless steel legs,
9.3.2. Install a test ball in the retaining nut as described in Section 10.4,9.3,3, Lower load arm, Attach required weight to end of load beam. Lower ball onto
ring manually or by use of arm actuator switch.9.3A4. Check level on top of load arm. The indicator bubble shall be centered in the
middle of the two lines, If required, adjust the retaining nut screw to achieve a level load arm,9.4. Assembly of Cylinder:
9.4.1, Place a clean test ring on the mandrel and bolt the back plate to the mandrel,
10. Procedure10,1, The summary of test conditions is included in TABLE K-1,
10.1.2. The test procedure described in Sections 10.2 through 10,29 is repeated with a finiteload change until scuffing is observed, as described in Section 13.
10.1,3. Any desired sequence of load increments may be selected to most rapidly converge
on the scuffing transition. The loading sequence provided in the Addendum to this appendix is stronglyrecommended.
10.1.4. The test fluid should be replaced/aerated and the apparatus thoroughly cleaned afterevery eighth load increment.
10,2, Installation of Cieaned Test Cylinder:NOTE 3: The BOCLE is very sensitive to contamination problems,
10.2.1. The greatest care shall be taken to adhere strictly to cleanliness requirements and tothe specified cleaning procedures. During handling and installation procedures, protect cleaned test parts(cylinder, balls, reservoir, and reservoir cover) from contamination by wearing clean cotton gloves,
10.2,2, Rinse shaft with isooctane and wipe with disposable wiper,10.2.3. Push the shaft through the left bearing and support bracket,10.2.4. Hold the cylinder with the set screw hub facing left, Push the shaft through the
cylinder bore, through the right bearing support bracket, and into the coupling as far as the shaft will go.10.2.5. Align the coupling set screw with the flat keyway side of the cylinder shaft.
Tighten set screw.
LM
146
10.2.6. Set micrometer at 2.50 mm and slide cylinder to the left until it is firmly against
micrometer probe, Ensure that cylinder set screw is directed toward the keyway (flat surface of shaft) and
tighten set screw.10.2.7. Back micrometer probe away from the cylinder before drive motor is engaged.
10.3. Record on the data sheet the ring number, if assigned, and the position of the test cylinder
as indicated by the micrometer, The first and last wear tracks on a ring shall be approximately 1 mm in
from either side.
10.3.1. For subsequent tests, reset cylinder to a new test position with the micrometer.
10.3.2. If the fuel is n& to be changed, the cylinder should be adjusted by loosening the
coupling set screw rather than at the mandrel, to minimize atmospheric contamination between tests.
Unnecessary removal of the reservoir cover should be avoided after the initial aeration is completed,
10.3.3. If the fuel sample is to be changed/aerated, then the adjustment may be made at
the mandrel. (Fuel is changed only after eight consecutive tests,)
10.3.4. The new position is to be 0.75 mm from the last wear track on the ring and noted
on the data sheet.
10.3.5. After tightening the coupling set screw to lock the cylinder/shaft In a new test
position, the micrometer probe should be backed off, then advanced to the cylinder again. Check
micrometer reading to ensure correct track spacing, Readjust position, if required, When the correct ring
position is ensured, back the micrometer probe away from the cylinder,
10.4. Install a clean test ball prior to 1Aii test by first placing the ball in the retaining nut,
followed by the blue retaining ring. Screw retaining nut onto the threaded chuck located on the load arm
and hand tighten.
10.5. Secure the load beam in the Up pusition by insertion of the blue pin.
10.6, If necessary, install the clean reservoir, Install the blue spacing platform by raising the
reservoir. Slide blue spacer platform into position under the reservoir, Place thermocouple in the hole
provided at the rear left side of the reservoir. Insert splash guards,
10.7. Check load bcam level. Adjust, if necessary.
10,8, If necessary, supply test fluid in accordance with Practice D 4306. Transfer 50 L 1 mL of
the test fluid to the reservoir, Place cleaned reservoir cover in position and attach the 1/4 to 1/8 in. air
lines to reservoir cover,
10.9. Move power switch to On position.
10.10. Turn on compressed air cylinder, Adjust the delivery pressure to 210 to 350 kPa (30 to
50 psi) and the console air pressure to approximately 100 kPa (14.5 psi),
10.11. Lower load beam by pulling blue pull pin, Do not allow the ball specimen to contact the
ring,
10.12. Start rotation of cylinder by switching motor drive to On. Set rotation to 525 * 1 r/min.
10.13, Using the flowmeters that control the wet and dry airflows, adjust conditioned airflow to read
3.8 Ll/min. Maintain 50 ± 0.2% relative humidity.NOTE 4: 50% relative humidity should require approximately equal vo!umes of wet and dry air,
147
10.14. Adjust reservoir temperature as required until temperature stabilizes at 250 :L 1*C. Adjust
thermostat of the heat exchanger circulating bath to obtain the required temperature.
10.15. If necessary, set fuel aeration timer for 15 min and adjust fuel aeration flowmeter to
0.5 L/min. (First test in load sequence only.)
10.16. At completion of aeration (if performed), the whistle will sound and aeration will cease.
Continue 3.8 L/min flow through the reservoir.
10.17. Break-in
10.17.1. Place 500-g load on load arm.10.17.2. Gently lower load arm. The pneumatic lift arm actuator must not be used.
10.17.3. Switch timer on for 30 seconds.
10.17.4. At the end of 30 seconds, the whistle will sound, and the test load must be
immediately removed,
10,18. Switch on chart recorder to measure friction trace (if available).
10.19. Check all test condition readouts and adjust as necessary, Record all necessary information
on data sheet.10.20. Place required load on load arm. Do not replace test ball or adjust test cylinder. (See the
Addendum at the end of this appendix for suggested loading sequence.)
10.21. Gently lower load arm, The pneumatic lift arm actuator must no be used,10,22. Switch timer on for 60 seconds,
10.23. At the end of 60 seconds, the whistle will sound, and the test load must be immediately
removed,
10.24. Manually remove test weight, Lift test load arm up and secure with blue pull pin.10.25. Do U1 remove reservoir cover unless fuel is to be replaced, If fuel is not to be replaced,
wipe revolving ring with an Wun disposable lint free cloth to remove residue from the test ring. Turnmotor drive and power switch to Off.
10.26. Remove test ball from locking nut. Do not remove ball from blue retaining ring. Wipe ballclean with disposable wipe prior to microscopic examination. Replace with new ball.
10,27, Measure the MAIMUM friction coefficient (if available) and wear scar diameter as
described in Section 11.10.28. Determine if scuffing has occurred at the last applied load, as defined in Section 13.
10,29. If scuffing has not occurred, repeat from Section 10.2 with appropriate load increment as
defined in the Addendum to this appendix,
11. Muesurement of Wear Scar and Friction11.1. Wear Scar Measurement
11.1.1, Turn on microscope light and position test ball under microscope at 100x
magnification,
11.1.2. Focus microscope and adjust stage such that wear scar is centered within the field
of view,
148
11.1.3. Align the wear scar to a divisional point of reference on the numerical scale with
the mechanical stage controls. Measure the major axis to the nearest 0.01 mm. Record the readings on
the data sheet.11.1.4. Align the wear scar to a divisional point of reference on the numerical scale with
the mechanical stage controls. Measure the minor axis to the nearest 0.01 nun. Record the readings on
the data sheet.
11.1.5. Record condition of wear area if different from the reference standard test, that is,
debris color, unusual particles or wear pattern, visible galling, etc., and presence of particles in the
reservoir,
11.2. Friction Measurement
11.2.1. Measure maximu tangential friction force in grams from output on stripchart
recorder.
11.2.2. Calculate friction coefficient as described in Section 12.
11.2.3. Record applied load and friction coefficient.
12. Calculation12.1.' Calculate the wear scar diameter as follows:
WSD - (M + N) (Eq. 1)2
where: WSD = Wear scar diameter, mm
M = Major axis, mm
N a Minor axis, mm.
12.2 Calculate the maximum friction coefficient as follows:
S= Ft (Eq. 2)Fn
where: p = Coefficient of Friction
Ft a Maximum tangential friction force, g
Fn = Contact load, g (a 2x applied Load).
13. Adhesive Scuffing
13.1. Scuffing may be defined as the transition from mild boundary lubricated wear or oxidative
corrosion wear to more severe adhesive wear.
149
13.2. The onset of scuffing is accompanied by a marked increase in both friction and wear.
Typical friction traces are provided in Fig. K-1.
13.2.1. Scuffing is considered to occur if the friction coefficient exceeds 0.175 at any time
during the test.
13.2.2. Scuffing is considered to occur if the plotted friction coefficient or wear scar
diameter increases disproportionately with increasing load. (Requires additional tests.)
13.3. A subjective measure of the wear mechanisms present is often possible from a visual
examination of the wear scar, with a distinct change in the surface topography after scuffing has been
initiated. Scuffing is typically accompanied by a change in the sound of the test apparatus.
13.4. The scuffing load capacity is considered to be the minimum applied load at which scuffing
is observed.
13.5. Scuffing onset is most easily defin. I through observation of the friction traces.
14. Report14.1.- Report the following information:
14.1.1. The a load (not contact load) required to produce scuffing to the nearest
100 g.
14.1.2. Deviations from the standard conditions of the test load, relative humidity, and fuel
temperature, etc.
Fc dour., ng Wear
0.20
0150
ADDENDUM
Suggested Test Load Soquence
START RESULT
9001
1500I01400 j 13 001100
1600is
1800
20DO 1900
220... 2100
2400 2200
26002300
28W 2700
3000 2900
2600 31200
3400 3300
3600 `,ý3200
- 3300
3100~
3500
3600CS0
4730
1. Move left to H~lht when selcotng load, st.ar t &2.800 g.S2. If •'uffing is observed, sole dt die next lower load to the right (i.e., follow the upward ar'row).
3. If no scuffmin is ol•wv4d soledt the next highe load to do right (1,e., follow the downward arrow).
4 . Tits result is the value okained in die rightrmot colum n to the neatest 200 S.
i. If secogary, add~idota WU mojy be p,.uformed to ames results outsde the nmal 1,300 to 4,300 S. However, few fuels exceed the liven
'-- 151
DISTRIBUTION LIST
Department of Defense
DEFENSE TECH INFO CTR 12 US CINCPACCAMERON STATION ATTN: J422 BOX 64020 1ALEXANDRIA VA 22314 CAW K M SMITH
HI 96861-4020ODUSDATMN: (L) MRM 1 DIR DLAPETROLEUM STAFF ANALYST ATTN: DLA MMDI 1PENTAGON DLA MMSB 1WASHINGTON DC 20301-8000 CAMERON STA
ALEXANDRIA VA 22304-6100OLUSDAMFN: (ES) CI 1 CDR400 ARMY NAVY DR DEFENSE FUEL SUPPLY CTRSTE 206 ATTN: DFSC Q BLDG 81ARIJNGTON VA 22202 DFSC S BLDGS 1
DALO SM 1 AMSTA CMU IPENTAGON AMSTA CME 1WASHINGTON DC 20310-0103 AMSTA HBM I
AMSTA N ISARDA AMSTA R 1AT•N: SARD TL AMSTA RG 1PENTAGON AMCPM ATP 1WASHINGTON DC 20310-0103 AMSTA Q 1
AMSTA UE 1CDR AMC AMSTA UG 1ATTN: AMCIUD S 1 CDR TACOM
AMCRD T 1 WARKEN3 MI 48397-5000AMCPD IT 1AMCIN A 1i.MCLG MS 1iM'.-L3 NIT IA• MCIcP ISI 1
5001 EISINTVWER AVEALF•DMR.k V A 22333-0001
BFLRF No. 286Page 1 of 6
CDR ARMY TACOM PROG EXEC OFFICERATTN: AMSTA FP I ARMAMENTS
AMSTA KL I ATTN: SFAE AR HIPAMSTA MM I SFAE AR TMAAMSTA MT 1 PICATINNY ARSENALAMSTA MC 1 NJ 07806-5000AMSTA OT IAMSTA FNG I PROJ MORAMSTA FR 1 UNMANNED GROUND VEHUSMC LNO 1 ATTN: AMCPM UGAMCPM LAV I REDSTONE ARSENALAMCPM M 113/M60 1 AL 35898-8060AMCPM CCEJSMHE 1
WARREN MI 48397-5000 DIRARMY RSCH LAB
DEPARTMENT OF THE ARMY ATTN: AMSRL CP PWMOBILITY TECH CTR BELVOIR 2800 POWDER MILL RDATTN: AMSTA RBF 10 ADELPHIA MD 20783-1145
AMSTA RBXA 110115 GRIDLEY RD STE 128 VEHICLE PROPULSION DIR
Fr BELVOIR VA 22060-5843 ATTN: AMSRL VP (MS 77 12)NASA LEWIS RSCH CTR
SFAE ASM AF IPICATINNY ARSENAL CDR AECNJ 07806-5000 ATTN: SPIM AEC ECC (T ECCLdS)
APG MD 21010-5401PROG EXEC OFFICERCOMBAT SUPPORT CDR ARMY ATCOMATTN: SPAE CS TVL I ATTN: AMSAT I ME (L HEPLER)
SFAE CS TVM 1 AMSAT I LA (V SALISBURY)SPAE CS TVH 1 AMSAT R EP (V EDWARD)
CDR TACOM 4300 GOODFELLOW BLVDWARREN MI 48397-5000 ST LOUIS MO 63120-1798
CDR ARMY NRDECAMTN: SATNC US (J j1EGEL)
SATNC UENATICK MA 01760-5018
BFLRF No. 286Page 2 of 6
CDR ARMY CRDBC CDRATIN: SMCCR RS ARMY BIOMED RSCH DEV LABAPO MD 21010-5423 AITN: SORD UBZ A 1
FT DETRICK MD 21702-5010CDR ARMY DESCOMATTN: AMSDS MN I CDR FORSCOM
AMSDS EN 1 ATTN: AFL3 TRS ICHAMBERSBURG PA 17201-4170 FT MCPHERSON GA 30330-6000
CDR ARMY WATERVLIET ARSN CDR TRADOCATTN: SARWY RDD 1 ATTN: ATCD SL 5 1WATERVLIET NY 12189 INGALLS RD BLDG 163
FT MONROE VA 23651-5194CDR APCAMTN: SATPC Q 1 CDR ARMY ARMOR CTR
SATPC QB (BLDG 85 3) 1 ATTN: ATSB CD ML 1NEW CUMBERLAND PA 17070-5005 ATSB TSM T I
FT KNOX KY 40121-5000PETROL TEST FAC WESTBLDG 247 TRACEY LOC CDR ARMY QM SCHOOLDDRW ATTN: ATSM CD IP 0 BOX 96001 ATSM PWD ISTOCKTON CA 95296-0960 FT LEE VA 23001-5000
CDR ARMY LEA CDRAMTN: LOEA PL 1 ARMY COMBINED ARMS SPT CMDNEW CUMBERLAND PA 17070-5007 ATTN: ATCL CD 1
ATCL MS 1CDR ARMY TECOM FT LEE VA 23801-6000ATTN: AMSTE TAR 1
AMSTE TC D I CDR ARMY FIELD ARTY SCHAMSTE EQ I ATTM: ATSF CD 1
APG MD 21005-5006 FT SILL OK 73503
PROJ MOR PETROL WATER LOG CDR ARMY TRANS SCHOOLATTN: AMCPM PWL 1 ATTN: ATSP CD MS 14300 GOODFELLOW BLVD FT EUSTIS VA 23604-5000ST LOUIS MO 63120-1798
CDR ARMY INF SCHOOLPRGJ MGM MOBILE ELEC PWR ATTN: ATSH CD IATM: AMCPM MEP 1 ATSH AT 17798 CISSNA RD STE 200 FT BENNING GA 31905-5000SPRINGFIELD "'A 22150-3199
CDR ARMY AVIA CTRCDR ATrN: ATZQ DOL M 1ARMY COLD REGION TEST CTR ATZQ DI IATTN: STECR TM 1 FT RUCKER AL 36362-5115
STECR LO 1APO AP 96508-7850 CDR ARMY CACDA
ATTN: ATZL CD 1FT LEAVENWORTH KA 66027-5300
BFLRF No. 286Page 3 of 6
CDR ARMY ENOR SCHOOL DIRATN: ATSE CD 1 AMC FAST PROGRAMFT LEONARD WOOD MO 65473-5000 10101 GRIDLEY RD STE 104
FT BELVOIR VA 22060-5818CDR ARMY ORDN CTRATTN: ATSL CD CS I CDR I CORPS AND FT LEWISAPG MD 21005 ATTN: AFZH CSS
FT LEWIS WA 98433-5000
CDR ARMY SAFETY CTRATTN: CSSC PMG 1 CDR
CSSC SPS I RED RIVER ARMY DEPOTFT RUCKER AL 36362-5363 ATTN: SDSRR M
SDSRR QCDR ARMY CSTA TEXARKANA TX 75501-5000ATTN: STECS EN 1
STECS LI 1 PS MAOGAZINE DIVSTECS AE 1 ATTN: AMX.LS PSSTECS AA 1 DIR LOOSA
APG MD 21005-5059 REDSTONE ARSENAL AL 35898-7466
CDR AkMY YPO CDR 6TH ID (L)ATrN. STEYP MT TL M 1 ATTN: APUR LO MYUMA AZ 85365-9130 1060 GAFFNEY RD
FT WAINWRIGHT AK 99703CDR ARMY CERLATTN: CECER EN1P 0 BOX 9005CHAMPAIGN IL 61826-9005
Department of the Navy
OFC OF NAVAL RSCH CDRATTN: ONR 464 NAVAL RSCH LABORATORY800 N QUINCY ST ATr`N: CODE 6181ARLINGTON VA 22217-5660 WASHINGTON DC 20375-5342
CDR CDRNAVAL SEA SYSTEMS CMD NAVAL AIR WARFARE CTRATTN: SEA 03M3 ATTN: CODE PE33 AJD2531 JEFFERSON DAVIS HVh P 0 BOX 7176ARLINGTON VA 22242-5160 TRENTON NJ 08628-0176
CDR CDRNAVAL SURFACE WARFARE CTR NAVAL PETROLEUM OFFICEATrN: CODE 630 1 CAMERON STA T 40
CODE 632 1 5010 DUKE STREETCODE 859 1 ALEXANDRIA VA 22304-6180
3A LEGGETr CIRCLEANNAPOLIS MD 21401-5067
BFLRF No. 286Page 4 of 6
OFC ASST SEC NAVY (I & E) 1 CDRCRYSTAL PLAZA 5 NAVAL AIR SYSTEMS CMD2211 JEFFERSON DAVIS HWY ATTNN: AIR 53623CARLINGTON VA 22244-5110 1421 J3EFFERSON DAVIS HWY
ARLINGTON VA 22243-5360
Department of the Navy/U.S. Marine Corps
HQ USMC CDRATIN: LPP I BLOUNT ISLAND CMDWASHINGTON DC 20380-0001 ATTN: CODE 922/1
5880 CHANNEL VIEW BLVDPROG MOR COMBAT SER SPT I JACKSONVILLE FL 32226-3404MARINE CORPS SYS CMD2033 BARNETT AVE STE 315 CDRQUANTICO VA 22134-5080 MARINE CORPS LOGISTICS BA
ATTN: CODE 837FROG MOR GROUND WEAPONS 1 814 RADFORD BLVDMARINE CORPS SYS CMD ALBANY GA 31704-11282033 BARNETT AVEQUANTICO VA 22134-5080 CDR
1 ST MARINE DIVCDR CAMP PENDLETON CA 92055-5702MARINE CORPS SYS CMDAMTN: SSE 1 CDR2033 BARNETT AVE STE 315 FMFPAC 04QUANTICO VA 22134-5010 BOX 64118
CAMP H M SMITH HI 96861-4118
Department of the Air Force
HQ USAF/LGSSF AIR FORCE WRIGHT LABAT•rN: FUELS POLICY 1 AM: WLJPOS 11030 AIR FORCE PENTAGON WI.POSF IWASHINGTON DC 20330-1030 1790 LOOP RD N
WRIGHT PATTERSON AFBHQ USAF/LGTV OH 45433-7103ATTN: VEH EQUIP/FACILITY1030 AIR FORCE PENTAGON AIR FORCE MEEP MGMT OFCWASHINGTON DC 20330-1030 615 SMSQ/LGTV MEEP
201 BISCAYNE DR STE 2ENGLIN AFB FL 32542-5303
BFLRF No. 286Page 5 of 6
SA ALC/SFr 1 WR ALC/LVRS1014 ANDREWS RD STE 1 225 OCMULOEE CTKELLY APM TX 78241-5603 ROBINS AM GA 31098-1647
Other Federal Agencies
NASA DOELEWIS RESEARCH CENTER CE 151 (MR RUSSEL)CLEVELAND OH 44135 1000 INDEPENDENCE AVE SW
WASHINGTON DC 20585
NIPERPO BOX 2128 1 EPABARTLESVI.LE OK 74005 AIR POLLUTION CONTROL
2565 PLYMOUTH RD
DOT ANN ARBOR MI 48105FAAAWS 110 1800 INDEPENDENCE AVE SWWASHINGTON DC 20590


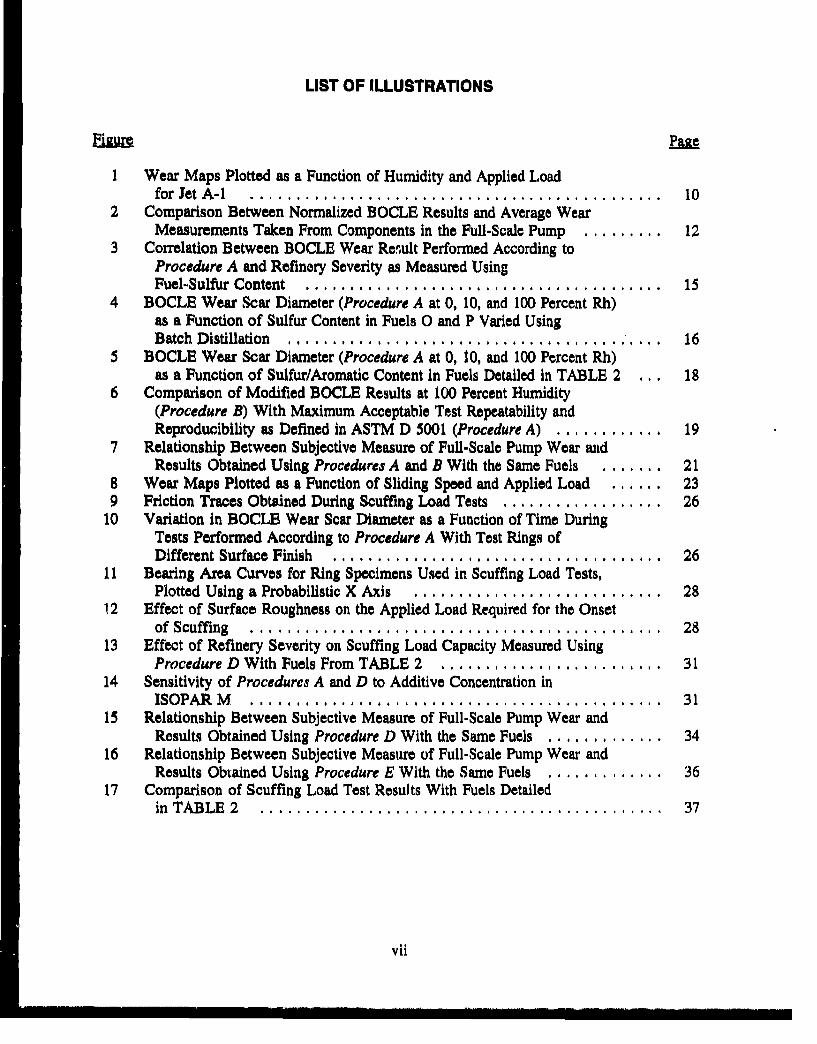


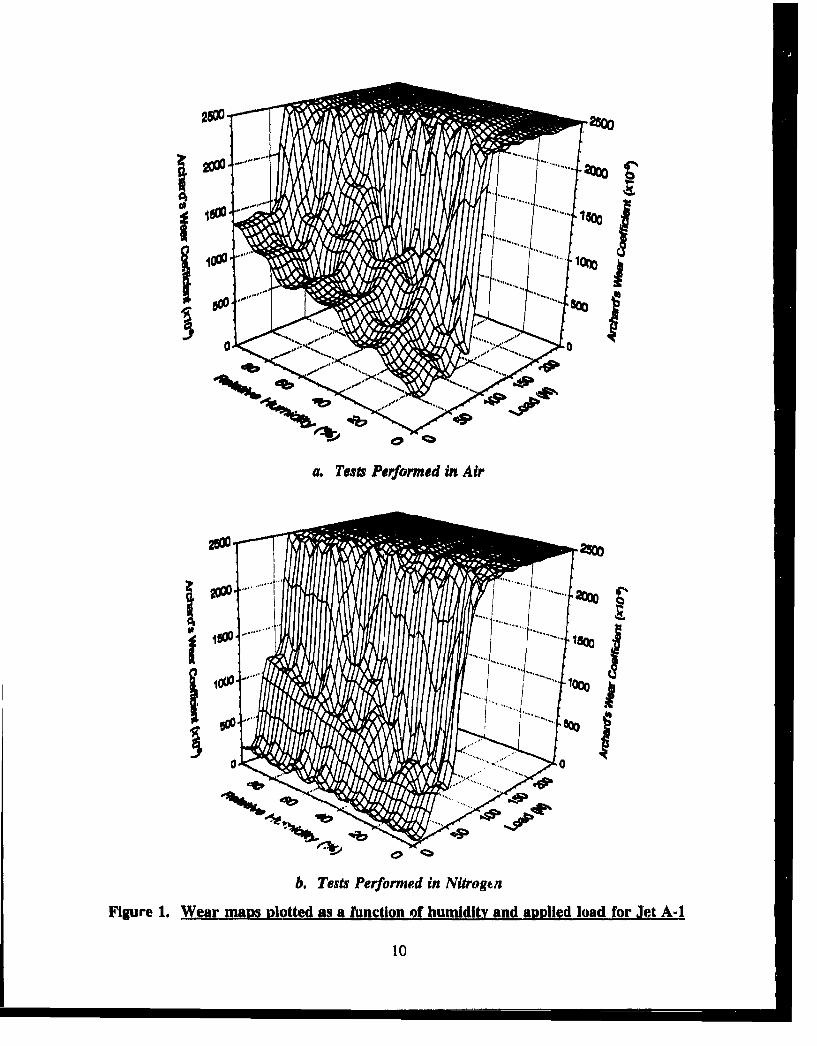


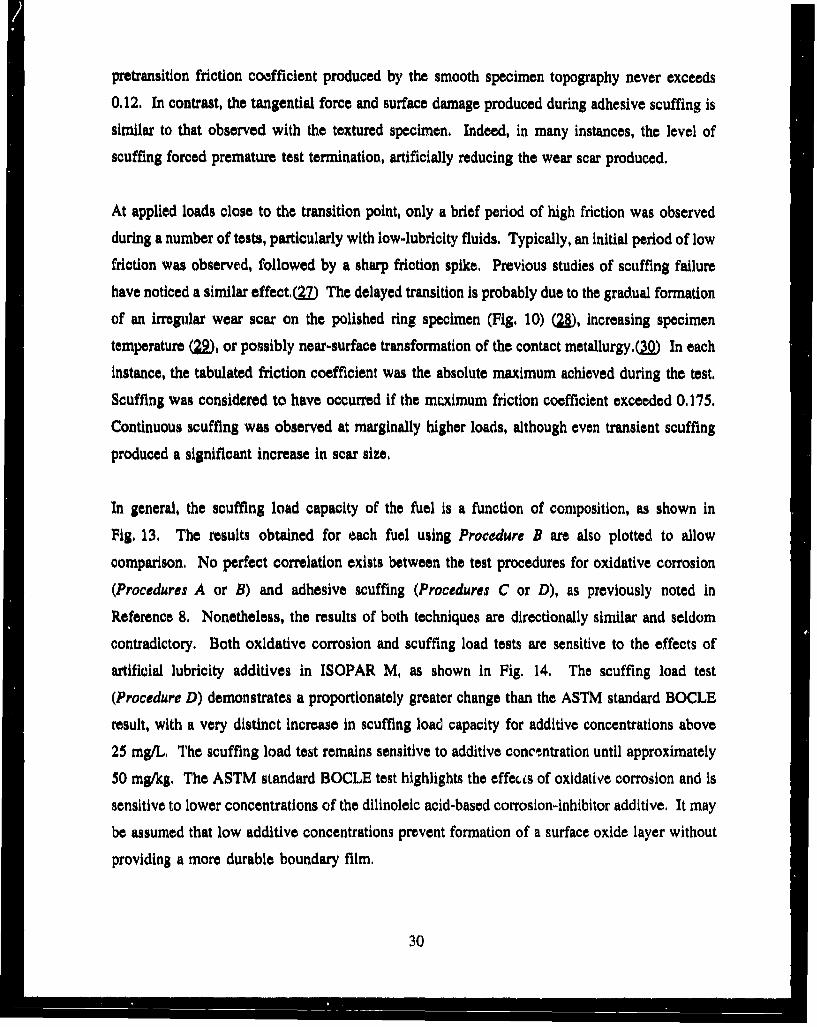
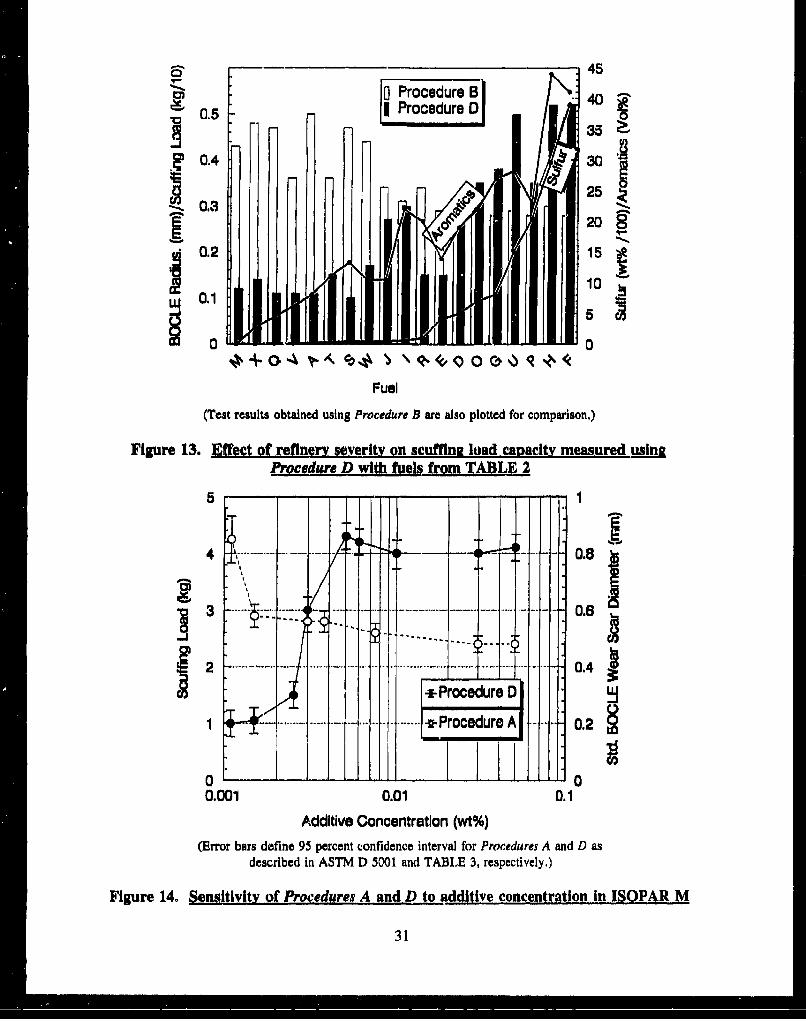


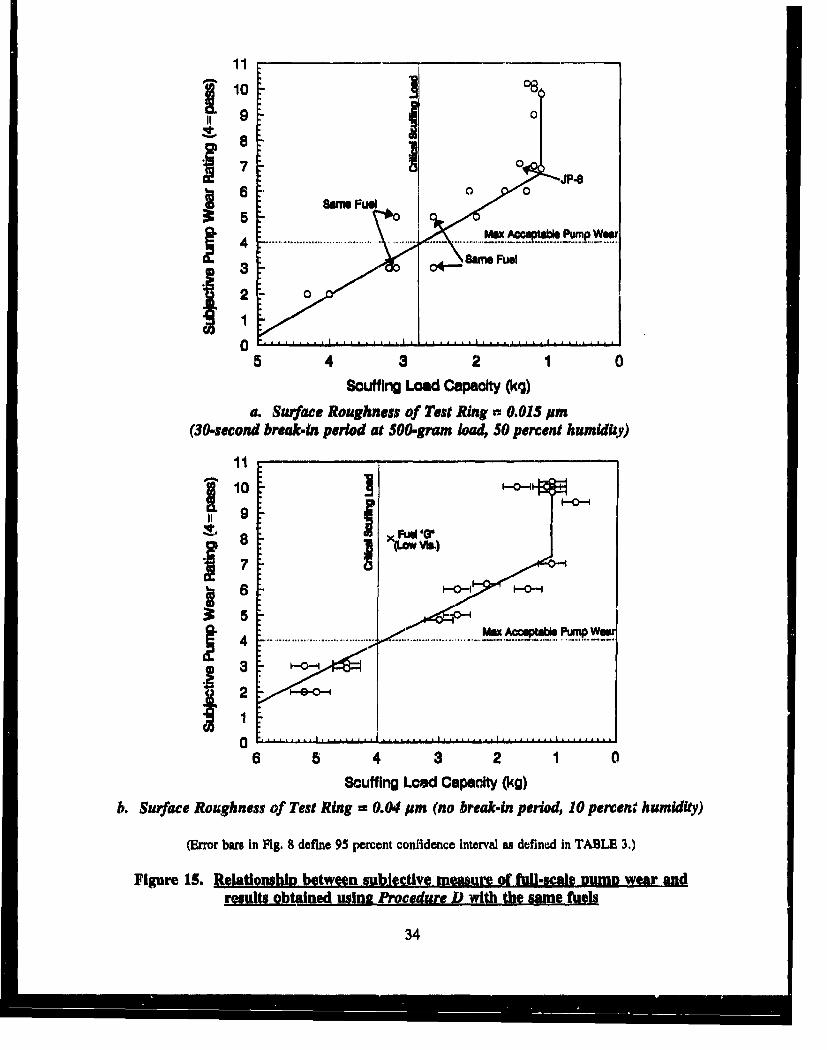

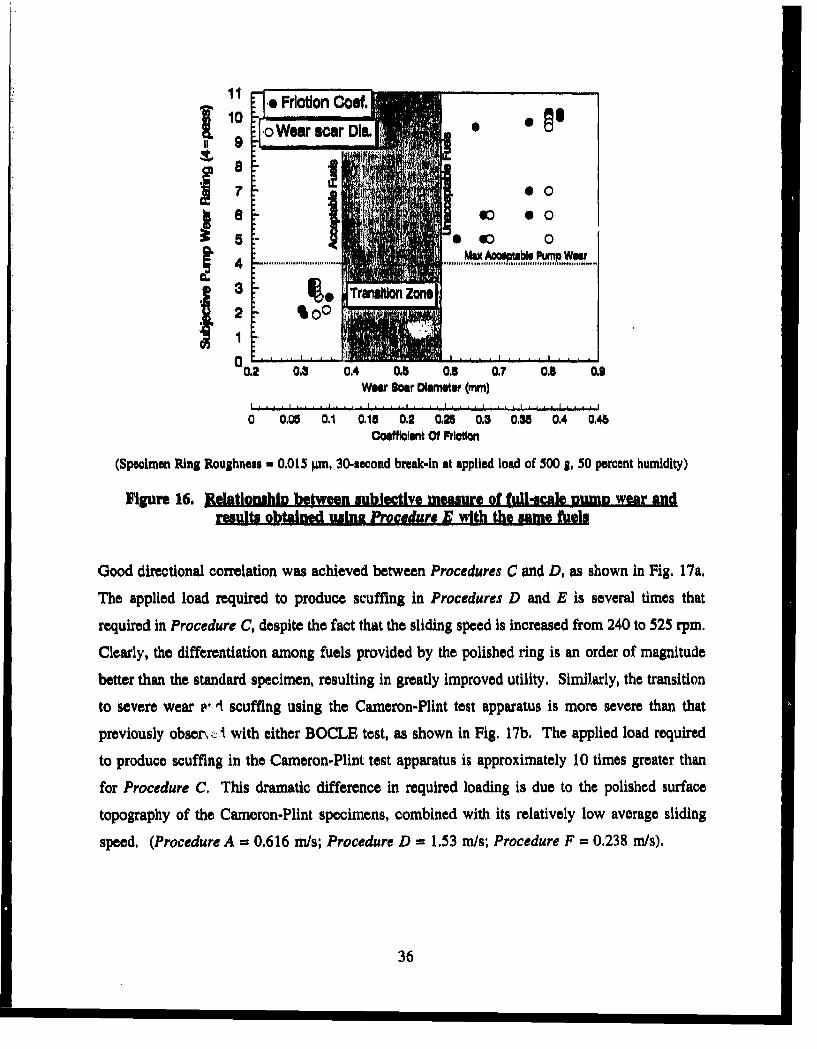
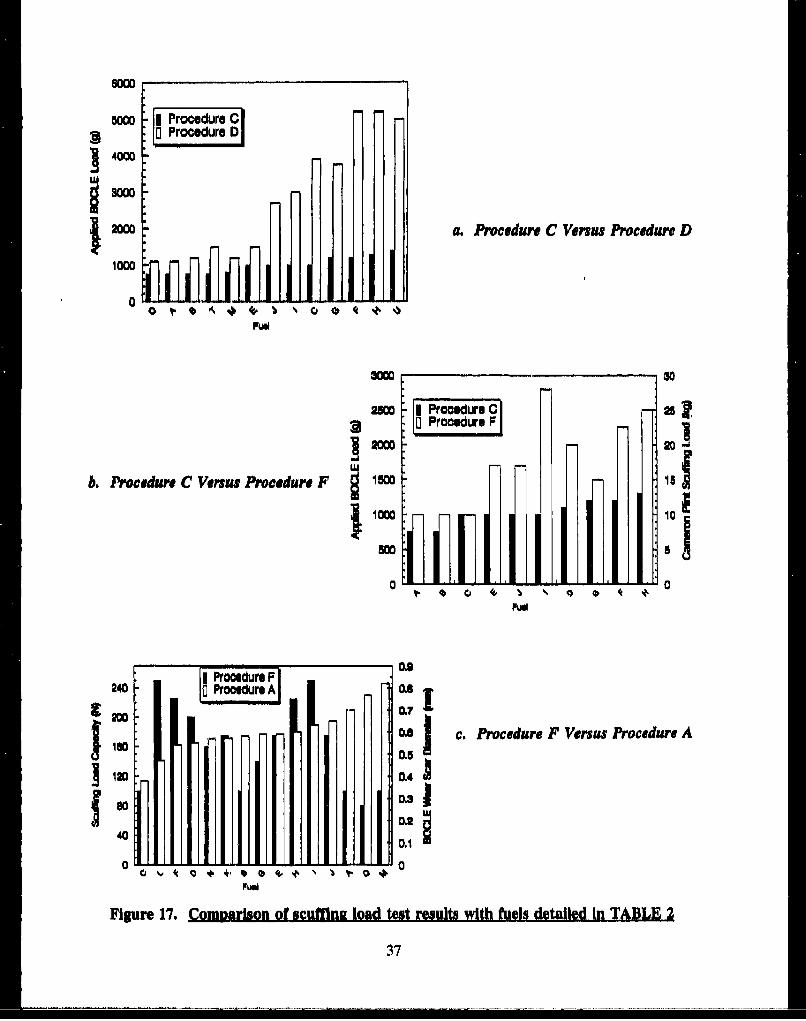


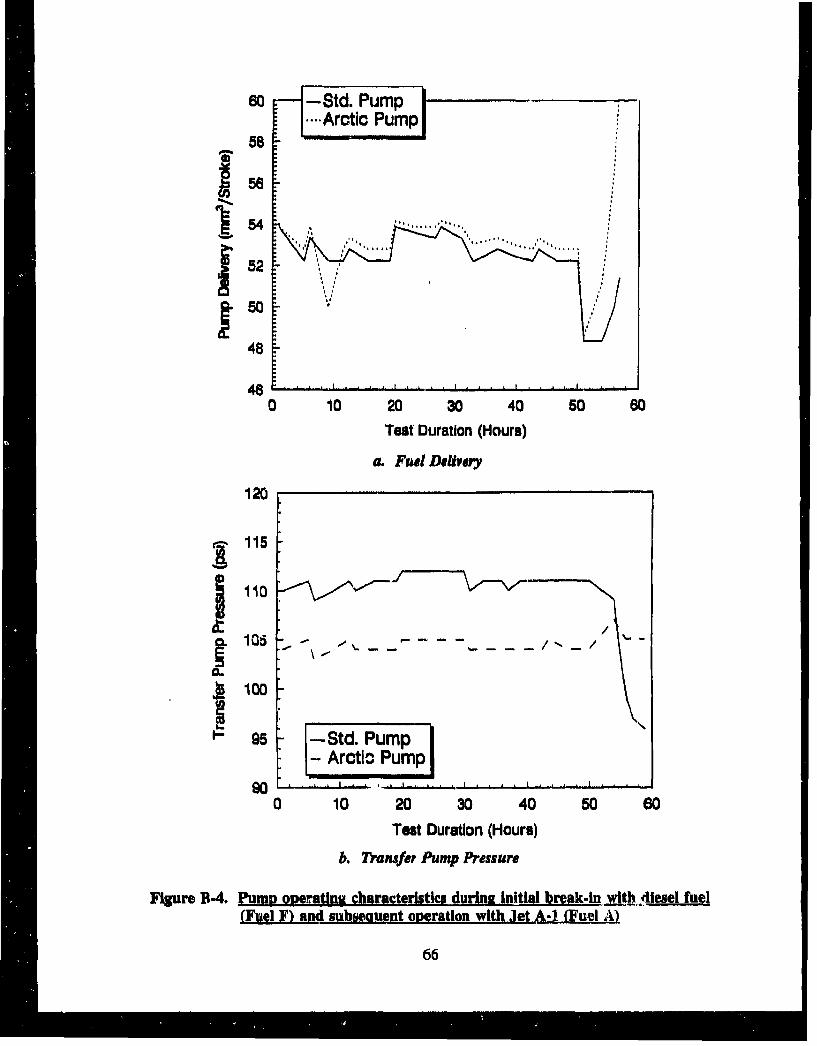


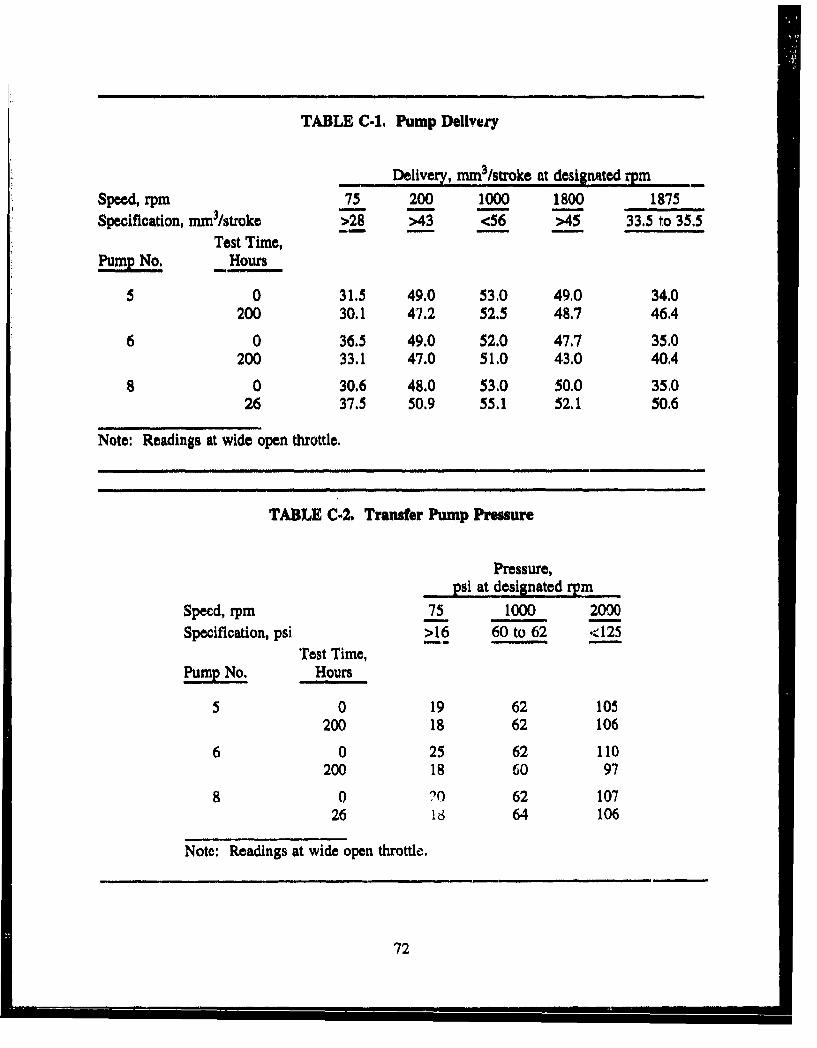


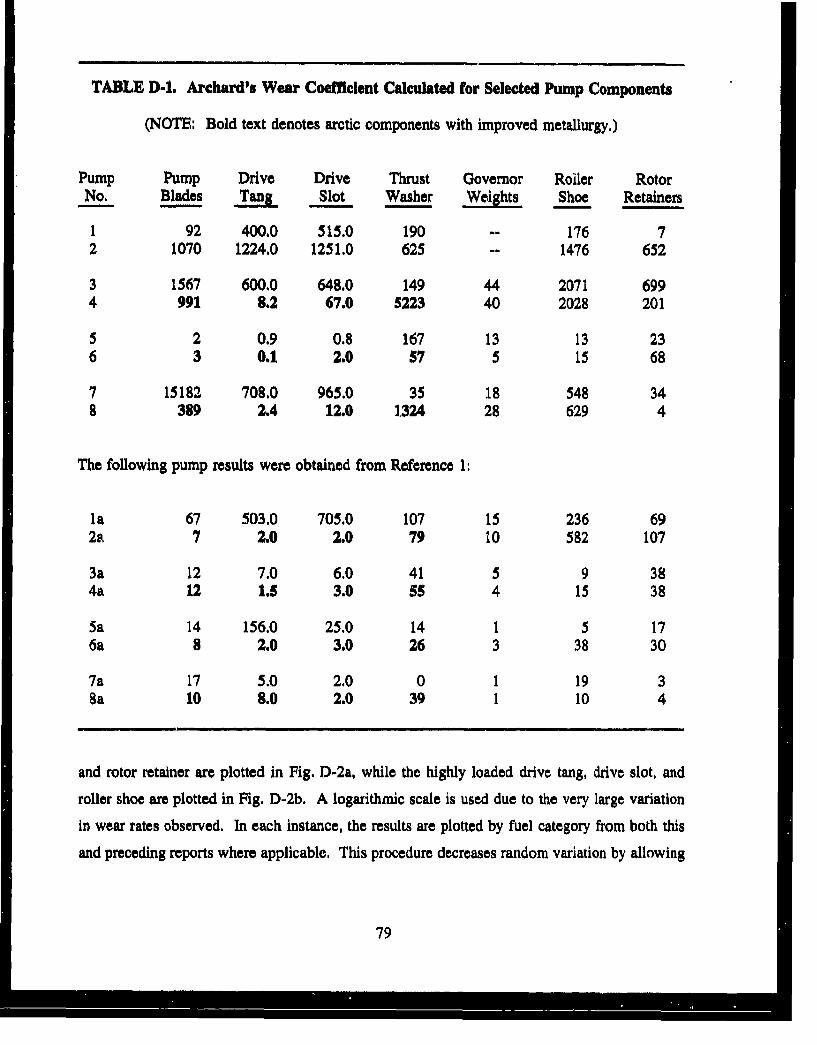

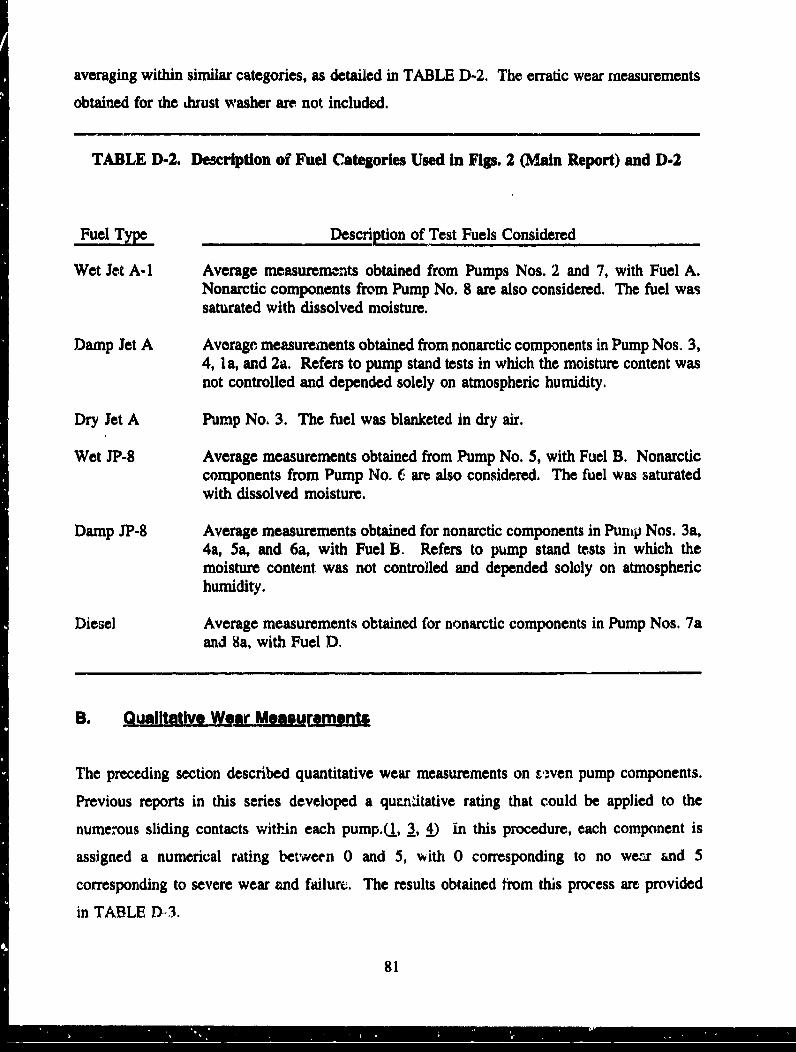
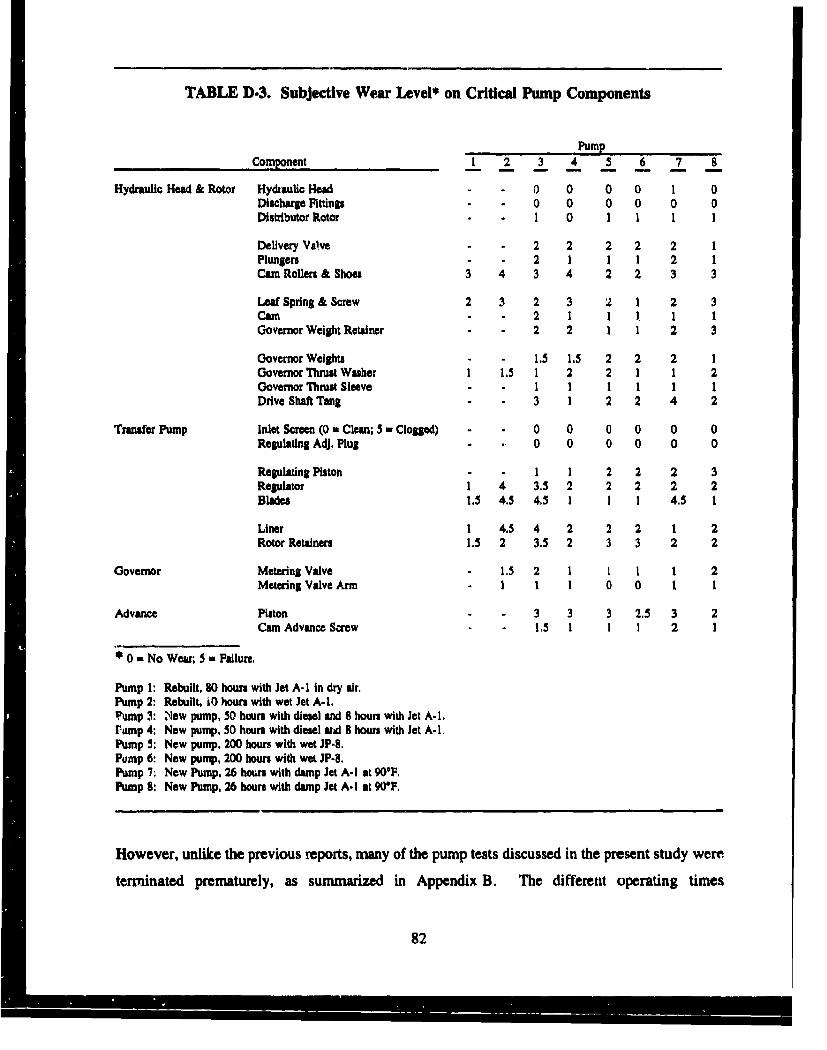

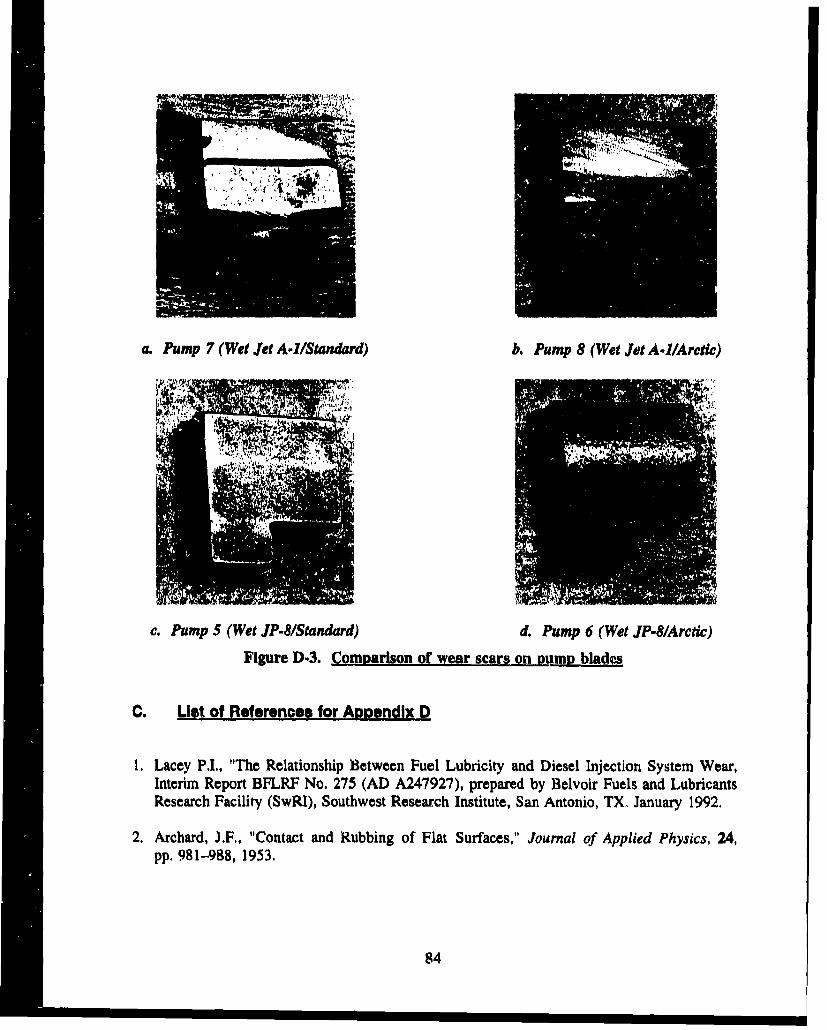

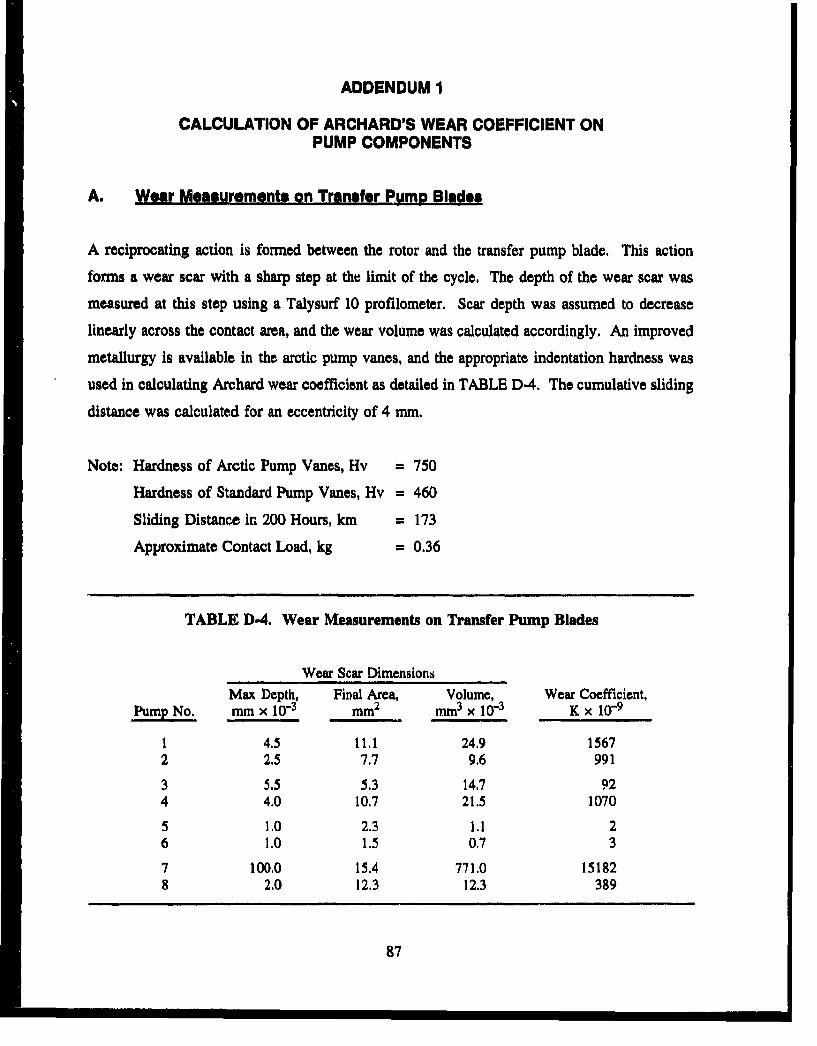
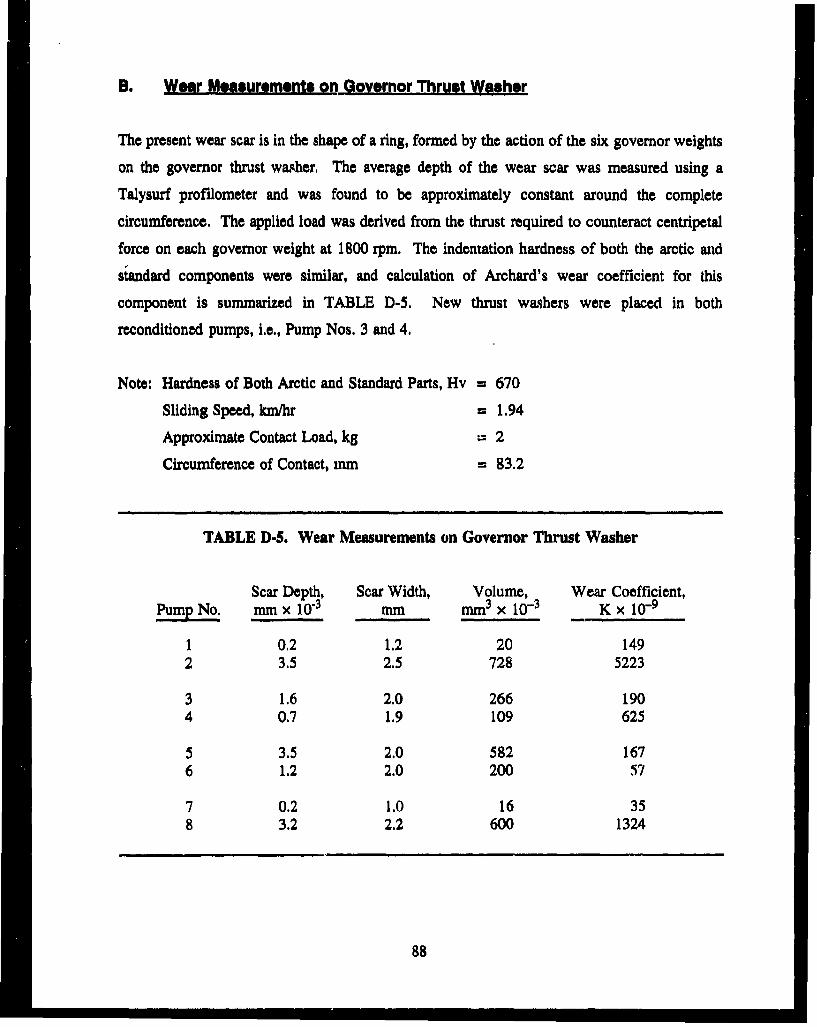


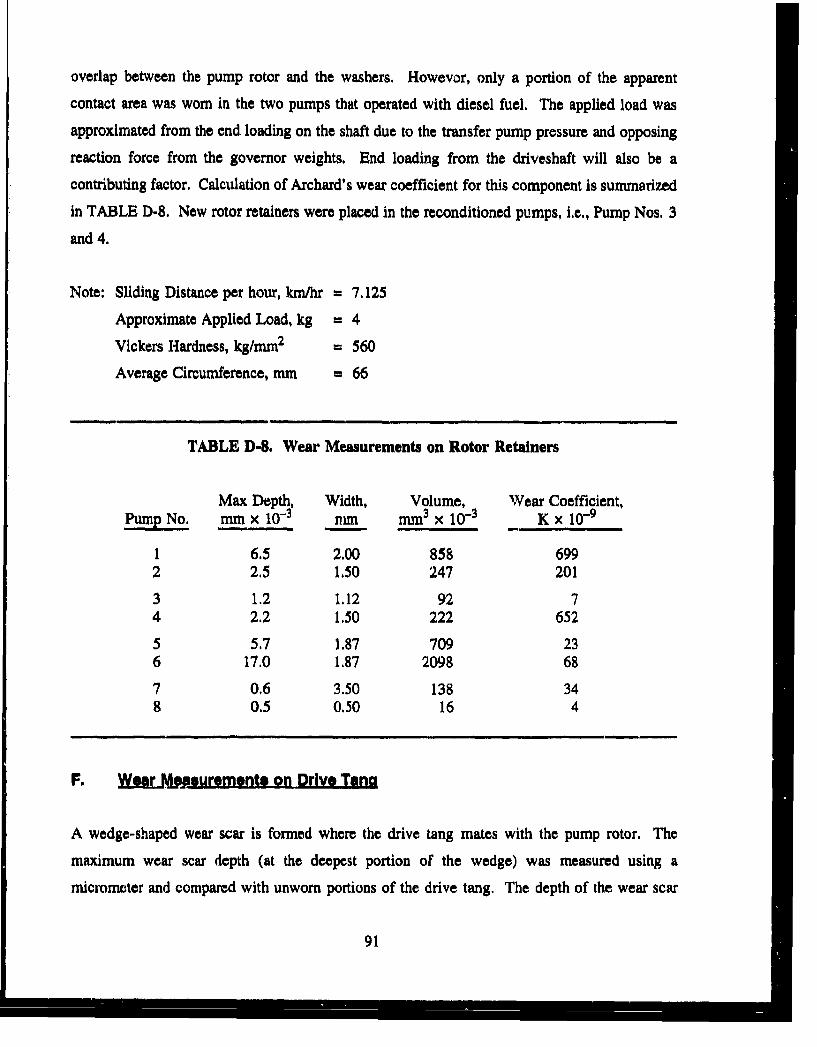


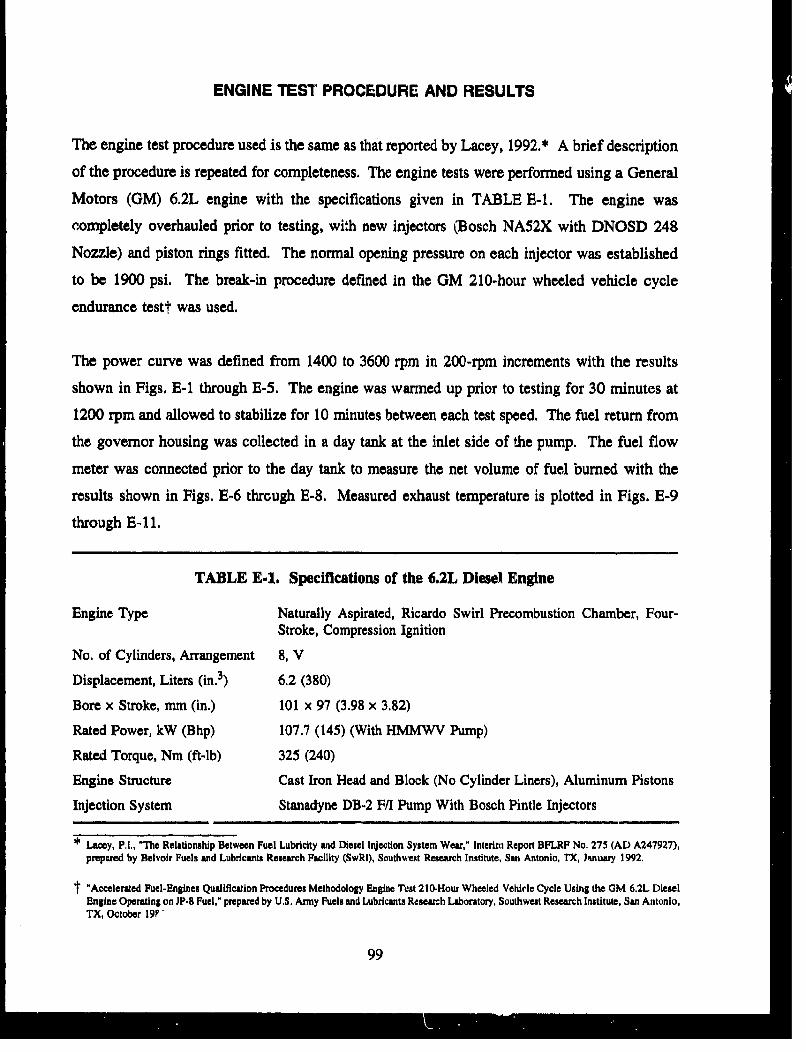


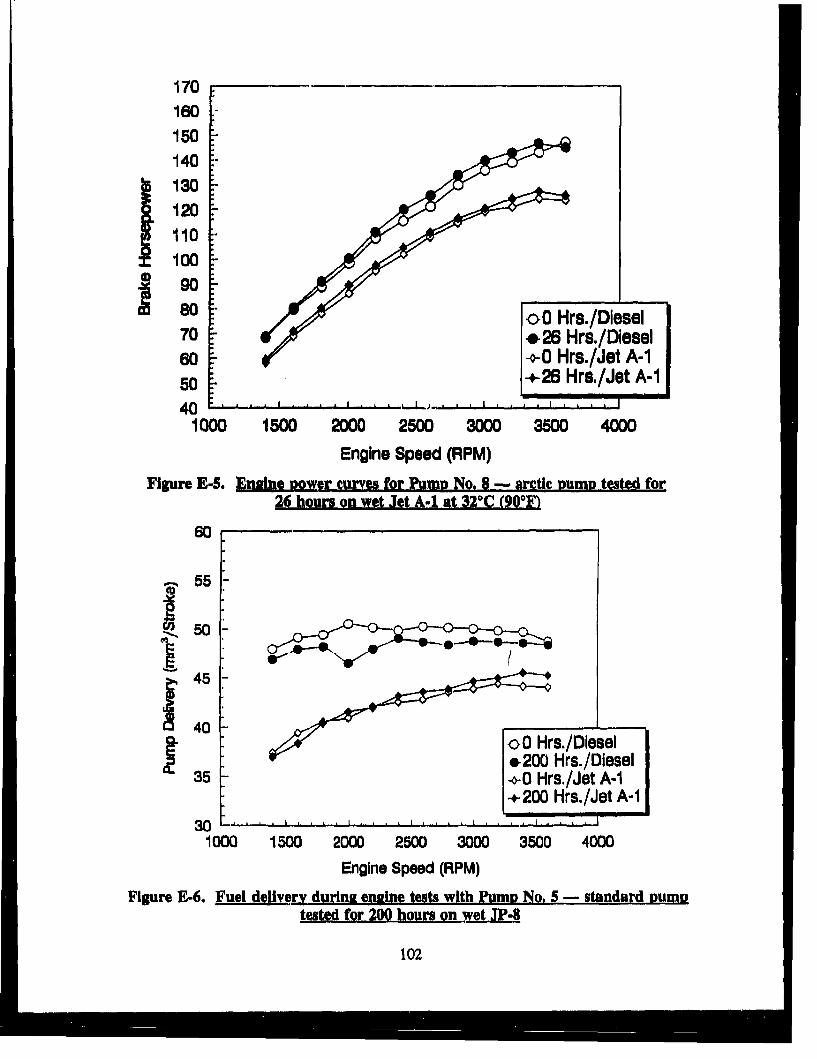

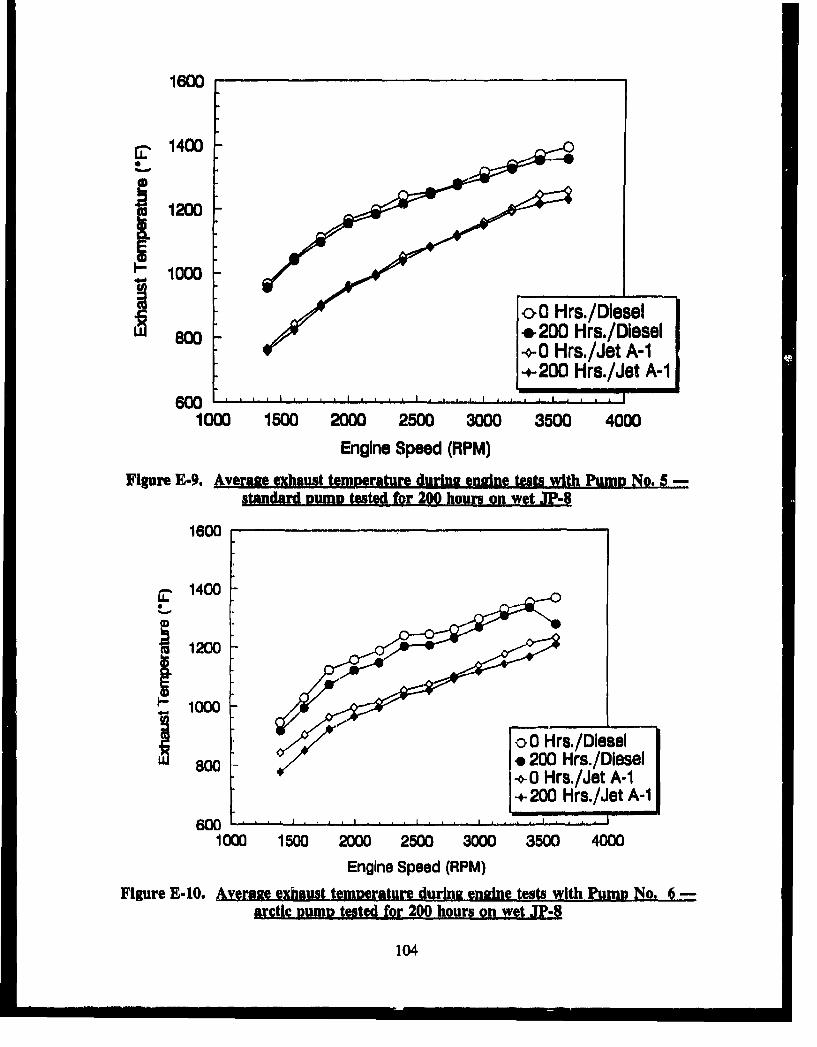


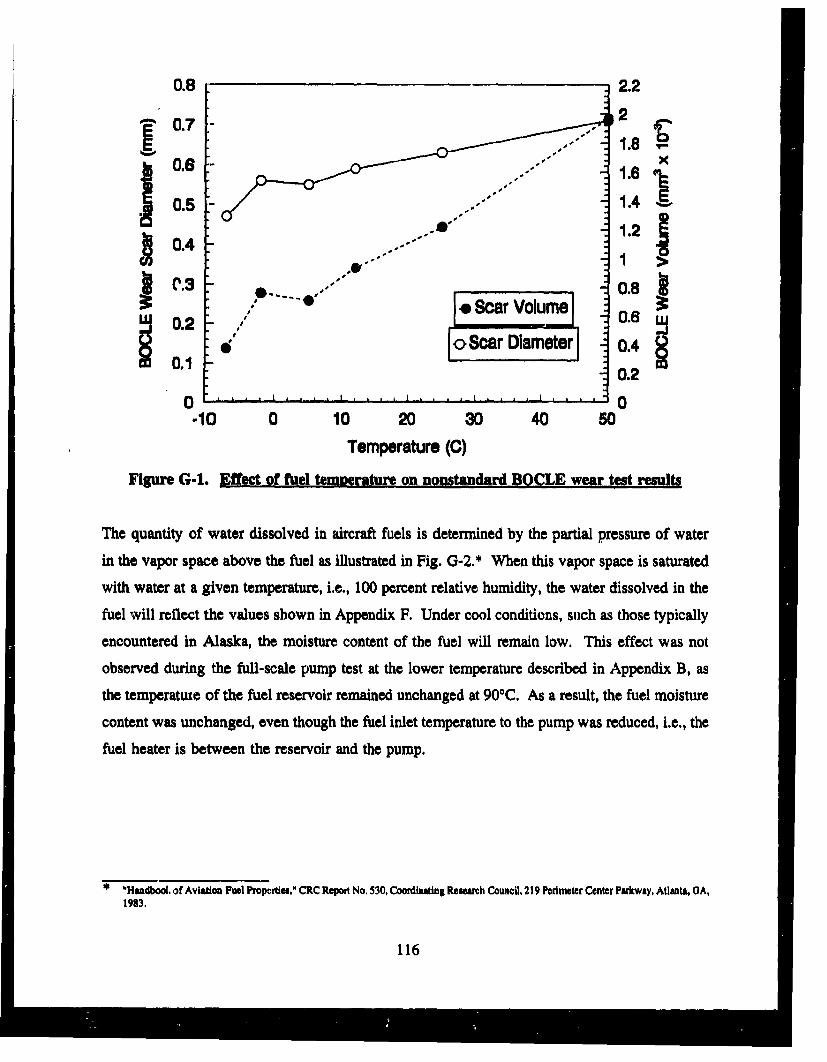


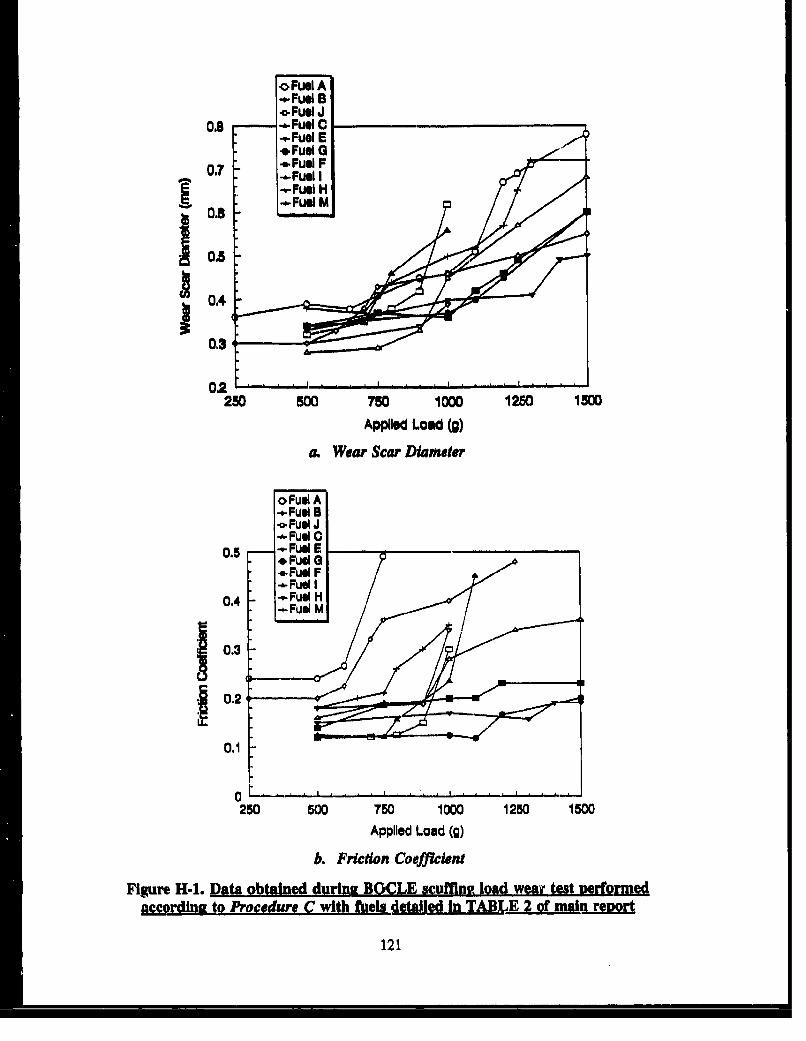
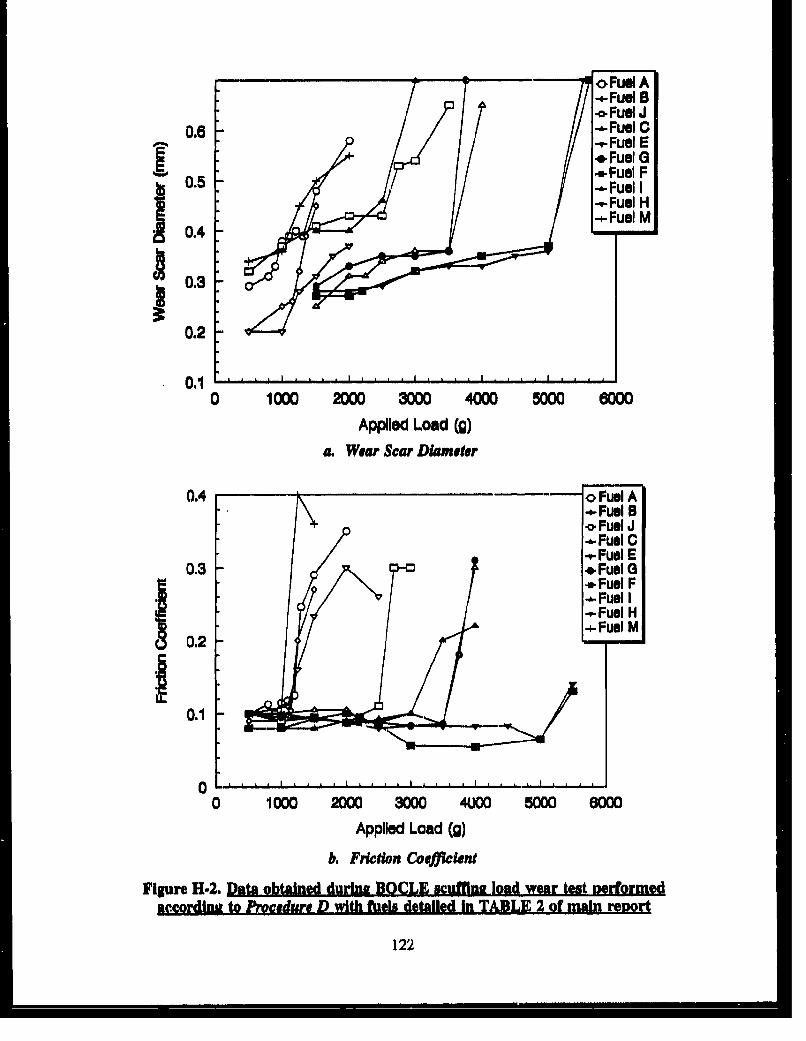


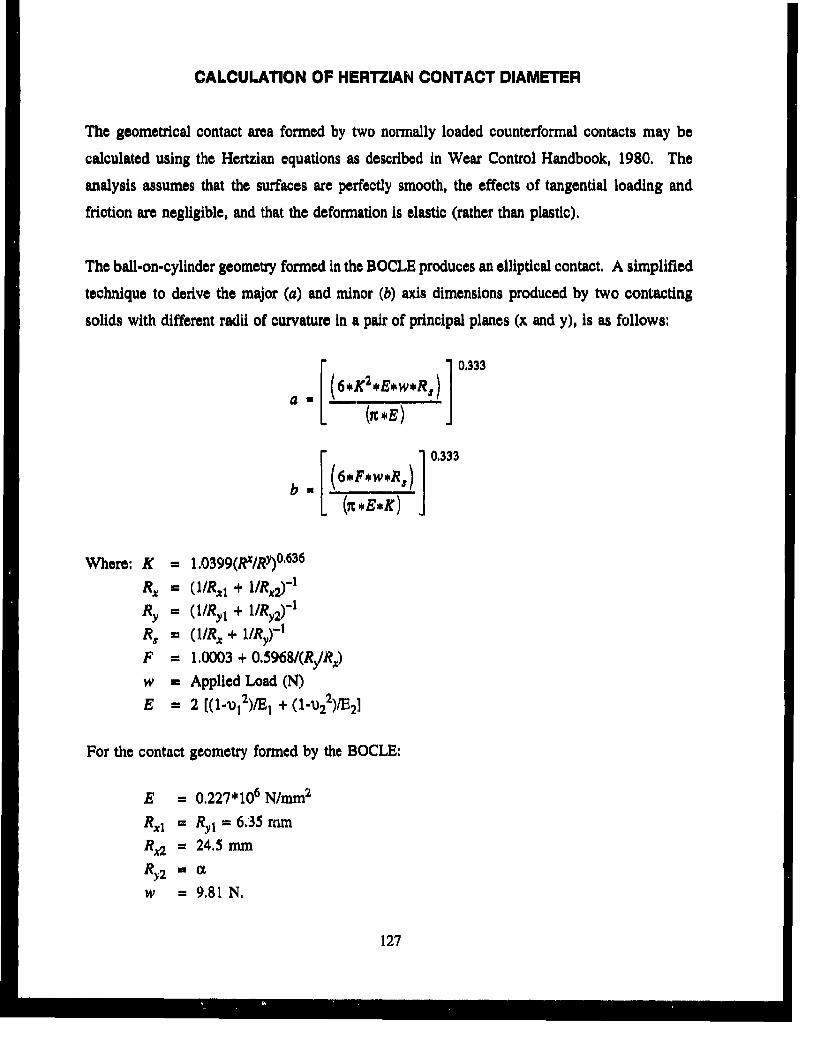


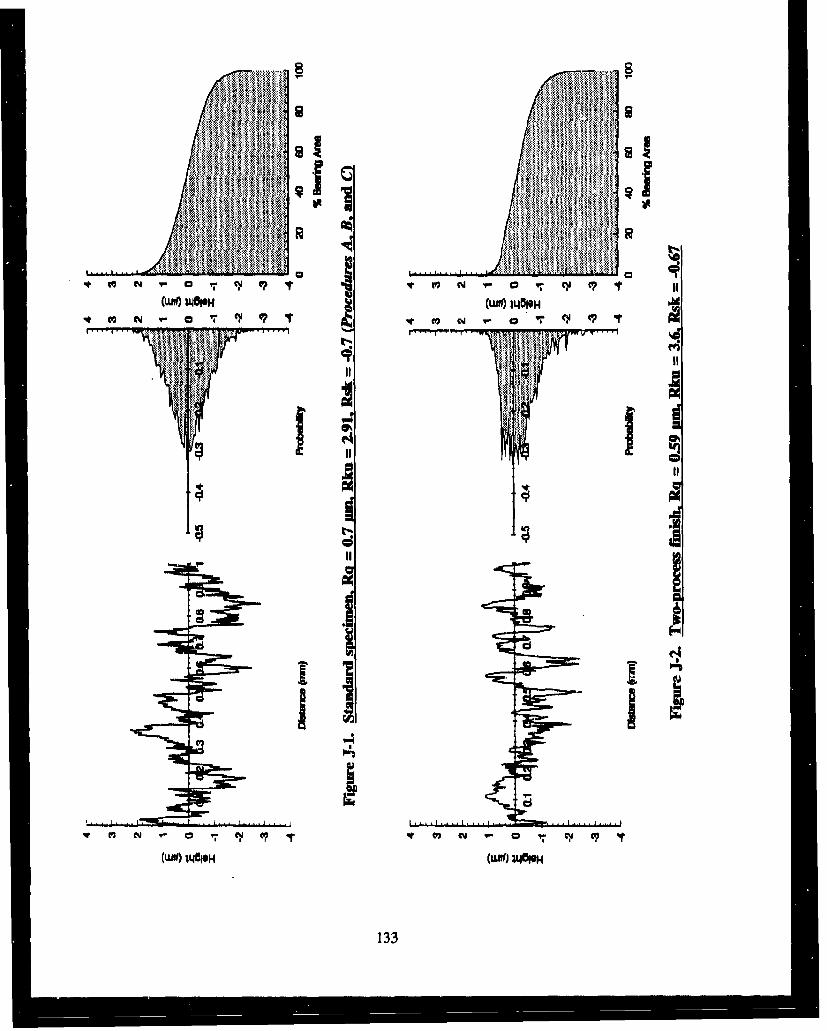

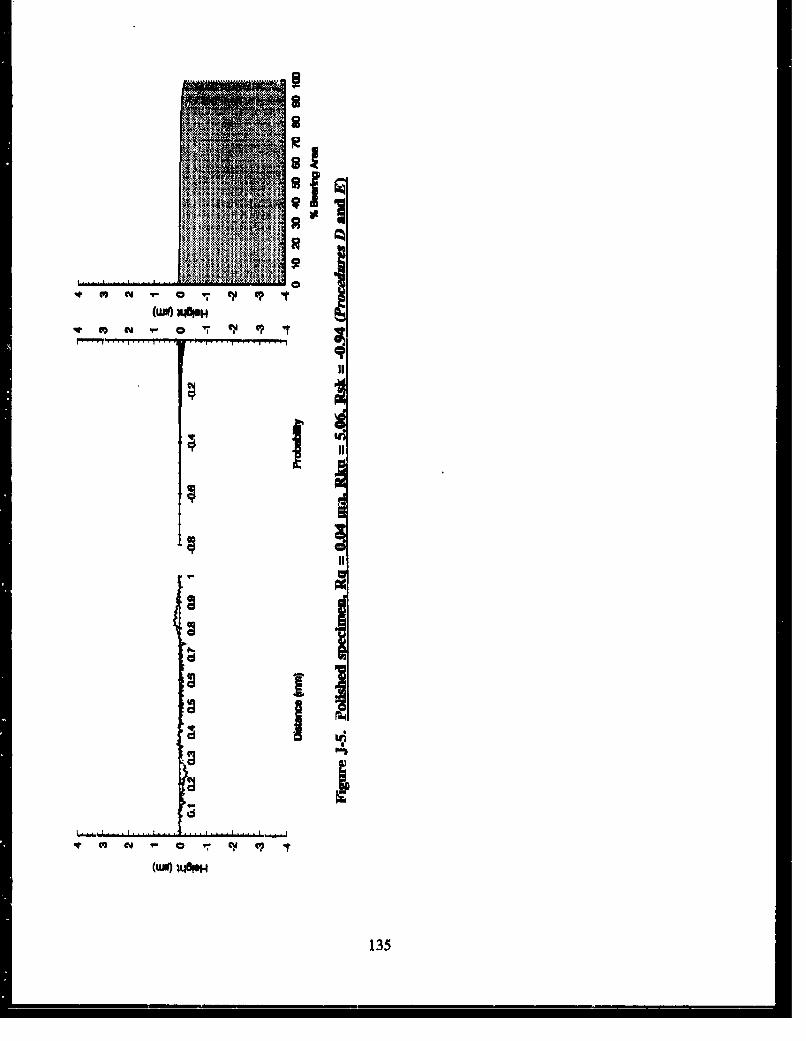


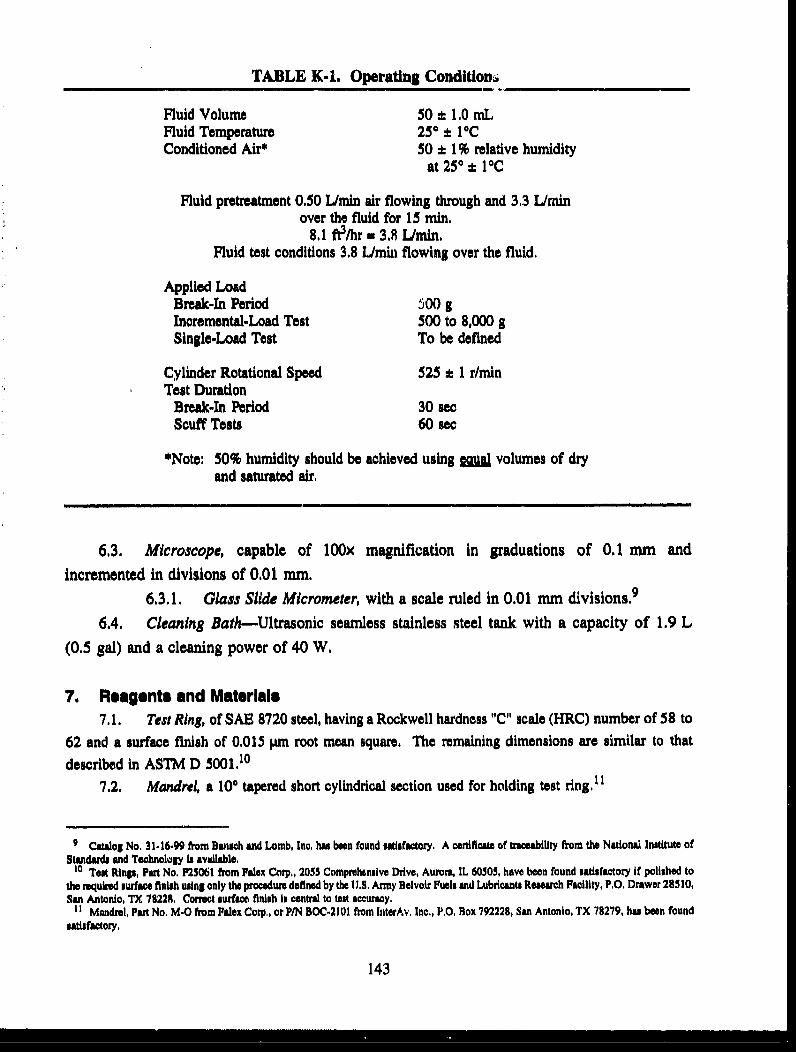


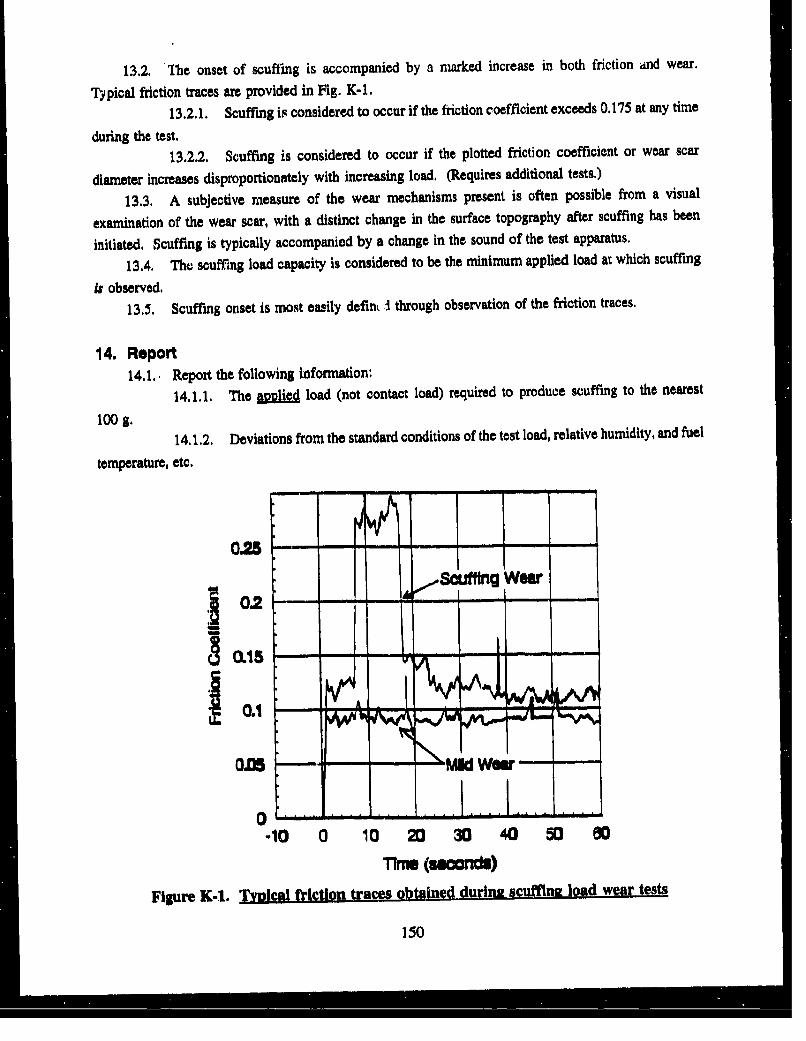


![Analysis of Wear Particles Formed in Boundary-Lubricated ... · tionally, it is believed that the wear debris also reflects the wear mechanism [14–16], and therefore, significant](https://static.documents.pub/doc/80x56/5ed0021901eb6c0e46324747/analysis-of-wear-particles-formed-in-boundary-lubricated-tionally-it-is-believed.jpg)


