Page 1
1
WEAR STUDIES OF Al-Si ALLOYS
A THESIS IN PARTIAL FULFILMENTS OF REQUIREMENTS
FOR THE AWARD OF THE DEGREE OF
Bachelor of Technology
Submitted to
NATIONAL INSTITUTE OF TECHNOLOGY, ROURKELA
BY
Souvik Sen & Deepak Kumar Behera
(110mm0477) (110mm0608)
DEPARTMENT OF METALLURGICAL & MATERIALS ENGINEERING
NATIONAL INSTITUTE OF TECHNOLOGY
ROURKELA – 769008
INDIA
2014
Page 2
2
WEAR STUDIES OF Al-Si ALLOYS
A THESIS IN PARTIAL FULFILMENTS OF REQUIREMENTS
FOR THE AWARD OF THE DEGREE OF
Bachelor of Technology
Submitted to
NATIONAL INSTITUTE OF TECHNOLOGY, ROURKELA
BY
Souvik Sen & Deepak Kumar Behera
(110mm0477) (110mm0608)
Under the Supervision of
Prof. S. C. Mishra
DEPARTMENT OF METALLURGICAL & MATERIALS ENGINEERING
NATIONAL INSTITUTE OF TECHNOLOGY
ROURKELA – 769008
INDIA
2014
Page 3
3
DEPARTMENT OF METALLURGICAL & MATERIALS ENGINEERING
NATIONAL INSTITUTE OF TECHNOLOGY
ROURKELA – 769008
INDIA
CERTIFICATE
This is to certify that the Thesis entitled “Wear Studies of Al-Si Alloys”
submitted by Souvik Sen (Roll No.110MM0477) & Deepak Kumar Behera (Roll
No.110MM0608), Department of Metallurgical and Materials Engineering,
National Institute of Technology, Rourkela, as a partial fulfillment of
requirements for the award of the Degree of Bachelor Of Technology has been
carried out under my supervision and has not been submitted elsewhere fancy
award of any degree.
Prof. S.C. Mishra
Department of Metallurgical
And Materials Engineering
Page 4
4
ACKNOWLEDGEMENT
It gives us immense pleasure to express our deep sense of gratitude to
Prof. S. C. Mishra, our guide and supervisor for his invaluable
guidance,motivation and constant inspiration. He always bestowed parental care
upon us and evinced keen interest in solving our problems. An erudite teacher, a
magnificent person and a strict disciplinarian, we consider ourselves fortunate
to have worked under his supervision.
We are extremely thankful to Prof B. C. Ray, Head, Department of
Metallurgical and Materials Engineering and Prof. A. Basu(Department of
Metallurgical and Materials Engineering) for his help and advice during the
course of this work.
We are also grateful to Mr. Rajesh PatnaikandMr. HarekrushnaSutar,
Metallurgical & Materials Engineering Department, for his help in carrying out
this work.
We are greatly thankful to all the staff members of the department and all our
well-wishers, classmates and friends for their inspiration and help.
Date: 7th
May, 2014
Place: Rourkela
Souvik Sen (110mm0477)
Deepak Kumar Behara (110mm0608)
Page 5
5
CONTENTS
CHAPTER TITLE PAGE
Certificate 3
Acknowledgement 4
Contents 5
List of tables 7
List of figures 8
Abstract 9
1 INTRODUCTION 10-14
1.1 Alloy 11
1.2 Aluminium alloys 11
1.3 Designation of aluminium alloys 12
1.4 Properties of aluminium alloys 13
1.5 Aluminium-silicon alloy 13
2 LITERATURE REVIEW 15-25
2.1 Introduction 16
2.2 Al-Si Alloys 16
2.2.1 Introduction 16
2.2.2 Phase diagram 17
2.2.3 Uses of Al-Si alloy 17
2.2.4 Microstructure 19
2.2.4 Wear Behaviour 21
2.2.6 Wear Mechanism 23
3 EXPERIMENTAL 26-32
3.1 Introduction 27
3.2 Dimensioning 27
3.3 Polishing 27
3.4 Stereo microscopy 28
3.6 Wear test 29
3.7 Profilometer 31
Page 6
6
4 RESULTS AND DISCUSSION 33-44
4.1 Introduction 34
4.2 Microstructure 34
4.3 Wear Test 35
4.4 Profilometer 44
5 CONCLUSIONS 45-46
REFERENCES 47-48
Page 7
7
LIST OF TABLES
TABLE TITLE
PAGE
NO. NO.
1.1
12
Table 1.1: Designation of aluminium alloys and their applications
4.1
Table 4.1: Weight, weight loss and Time data for 30N and 80N for 2000m
sliding distance. 40
4.2
Table 4.2: Weight, weight loss and Time data for 30N and 80N for 5000m
sliding distance. 41
4.3
Table 4.3: Weight, weight loss and Time data for 30N and 80N for 6000m
sliding distance. 42
4.4 Table 4.4: Distance vs Weight loss for different loads
43
Page 8
8
LIST OF FIGURES
FIGURE TITLE PAGE
NO. NO.
2.1 Al-Si phase diagram 17
2.2 Microstructure of Al-7% Si 20
2.3 Microstructure of Al-12% Si 20
2.4 Microstructure of Al-16% Si 20
2.5 Microstructure of Al-18% Si 20
2.6 Microstructure of Al-21% Si 20
2.7 Microstructure of Al-22% Si 20
2.8 Wear rate of Al alloy as a function of sliding distance (applied load: 1N) 22
2.9 Wear rate of Al alloy as a function of sliding distance (applied load: 7N) 23
2.10 Schematic images of four represented wear modes [ref wear m] 23
2.11 Mechanism of Abrasive wear : micro cutting, fracture, fatigue, grain pull out 24
2.12 Modes of Abrasive wear 25
3.1 Stereomicroscope of physical metallurgy lab, NIT Rourkela 28
3.2 DUCOM friction and wear monitor, pin-on-disc wear test machine 29
3.3 Full view of DUCOM friction and wear monitor 30
3.4 Pin-on-disc type friction and wear apparatus 30
3.5 Stylus profilometer VEECO DEKTAK, electrometallurgy lab, NIT RKL 31
3.6 Schematic representation of Profilometer 31
3.7 Path of stylus running over a surface 32
4.1 Microstructure of Al-10% Si sample at 50x magnification 34
4.2 A typical wear surface 35
4.3 Figure showing wear rate of alloys 36
4.4-4.15 Crack morphology and friction force of different worn samples 37-39
4.16-4.21 Plot of Weight and weight loss vs time for 2, 5 and 6 km 40-42
4.22 Plot of distance vs weight loss for different loads 43
4.23 Profilometer curves 44
Page 9
9
ABSTRACT
There are many properties of Aluminium-Silicon alloys such as high wear resistance,
light weight, low coefficient of thermal expansion and high strength to weight ratio, that
makes it suitable for many industries. In recent years, it has gained huge acceptance in
automotive industries, as its use results in fuel saving, hence cost saving. These advancements
make the study of properties of Al-Si alloys important. In the present study, wear behaviour
of Al-Si alloys were studied. Aluminium containing 10 weight % of Silicon was synthesized
using casting method. The microstructure showed the presence of Proeutectic silicon. Wear
behaviour was studied by using computerized pin on disc wear testing machine. The abrasion
of the alloy increased as sliding distance and time increased. The crack morphology of the
worn surfaces were analysed using stereo microscope.
Keywords: Al-Si alloys, casting, wear, microstructure
Page 10
10
CHAPTER – 1
INTRODUCTION
Page 11
11
1.1 Alloy
An alloy is a solution which has metal-like characteristics. It is formed by blend of two
or more elements with least one of them is metal (which is the major contributor).
The metallic bond must dominate in its crystal structure. The metallic atoms must
dominate in its chemical composition. The properties may vary slightly to a large extent from
the contributing elements. Alloys are mostly used for the purpose where pure components are
not a viable option. For example, small amount of carbon present in steel increases the
hardness of the wrought form of iron. Some physical properties, such as conductivity, density
and appearance may not vary greatly, but mechanical properties such as strength, toughness
and hardness may change rapidly with change in alloy content. In many a case, the alloying
particles act as moon dust, in the sense that a small addition can bring in magical properties.
The benefits of alloy addition also depends upon the treatment used for manufacturing the
alloy.
1.2 Aluminium alloys
Aluminium alloys have gained wide area of usage in automotive industries, in recent
years. As Aluminium alloys have high specific modulus and high specific toughness, therefore
these alloys are used in automotive components for fuel saving, and thus improving cost and
economy. The alloying elements of Al are generally Cu, Mg, Si, and Zn etc. Surfaces of
Aluminium alloys forms a shielding layer of Aluminium oxide, thus preventing the
Aluminium present in the core from corrosion. Aluminium alloys are given nomenclature such
as 4xxx, 5xxx and 6xxx series where the numbers such as 4 represents the major alloying
element, Si. Due to these reasons, these alloys were tested and studied in scientific circles.
Page 12
12
1.3 Designation of Aluminium alloys
Major alloying element is the basis for classifying the Aluminium allioys. The
classification of the Aluminium alloys are done according to the Aluminium Association
Wrought Alloy Designation System which basically consists of four numerical digits[3]
.
Table 1.1: Designation of aluminium alloys and their applications
Alloy Main alloying element Applications
1xxx It has mostly pure Aluminium with no
major alloying addition. Chemical and Electrical Industry
2xxx Cu(Copper) Components of Aircraft
3xxx Mn(Manganese) Application in architecture
4xxx Si(Silicon) Automobile Parts and Welding Rods
5xxx Mg(Magnesium) Marine industry such as Boat Hulls
6xxx Mg and Si
Architectural Industry such as
extrusions
7xxx Zn(Zinc) Components of Aircraft
8xxx Other elements such as Iron
9xxx Those which are mentioned above
Page 13
13
1.4 Properties of Aluminium alloys
A broad variety of mechanical and physical properties can be procured from wrought
Aluminium. The different properties are:
1) Aluminium is a light metal having a density of 2.7g/ml which is almost a third of
density of steel.
2) Aluminium prevents advancing oxidation and corrosion by formation of a shielding
oxide layer on its surface which prevents the core from coming to direct contact with
the environment.
3) Aluminium alloys exhibit excellent thermal and electrical properties. It has wide use
in electrical industry as the thermal conductivity is twice that of the Cu.
1.5 Aluminium-Silicon alloy
Al-Si alloys are of great importance to many industries as they impart high wear
resistance, high strength to weight ratio, low coefficient of thermal expansion low density etc.
Silicon exhibits low shrinkage and high fluidity, that gives these alloys good weldability and
castability. Al-Si alloys are given a nomenclature of 4xxx alloys according to the Aluminium
Association Wrought Alloy Designation System. The major features of the Al-Si alloys are:
a. They are moderately heat treatable.
b. They show good flow characterestics.
c. They are easily weldable.
Page 14
14
The two most important uses of the 4xxx series Al-Si alloys are for forging and weld
filler alloy. These applications are feasible due to the good flow characteristics given by
relatively high silicon amount.
Effects of Si in the Al-Si alloys can be summed as[4]
:
i. Silicon reduces thermal expansion.
ii. Silicon has a very low effect on magnetic susceptibility and reduces it by a very low
amount.
iii. Lattice Parameter decreases on adding Si.
iv. Silicon is hard and therefore the machinabilty of these alloys deteriorates.
Although many investigations exist in literature and based on the above discussion, it is
evident that there is enough scope for further research of Al-Si alloys especially their
mechanical properties. Therefore the objectives of this study are;
i. To study of their microstructure.
ii. To study of their mechanical properties like hardness
iii. To study the wear behaviour.
iv. To study surface roughness.
v. To study crack morphology.
vi. To study effect of age hardening on wear.
Page 15
15
CHAPTER – 2
LITERATURE REVIEW
Page 16
16
2.1 Introduction
Aluminium alloys, are gaining vast industrial significance because of their undischarged
combination of physical, mechanical, and wear resistance properties over its base alloys. They
have high specific strength, high wear and abrasion resistance, better high temperature
strength, high stiffness, improved damping capacity and low thermal expansion coefficient.
Aluminium alloy with 10 wt% SiC particle reinforced composite offers same mechanical
properties but higher thermal conductivity and specific heat than cast iron. As a result,
frictional heating is found to be substantially less in these alloys than that of cast irons. This
contributes to their use in engineering and automobile sectors excessively, where wear and tear
are the very major problems. Some of the components are pistons, connecting rods and
cylinder heads for automobile and impellers, turbine blade, agitators, vortex finder, pump inlet,
in mining and marine sectors[5]
.
2.2 Aluminium-Silicon Alloys
2.2.1 Introduction
Alluminium alloys are distinguished according to their major alloying element. Silicon is
the main alloying element for the 4xxx group. It give good casting properties to the alloy by
decreasing its viscosity. It reduces melting temperature of the alloy, decreases shrinkage
during solidification. Also it is very inexpensive for a raw material.
Silicon has low density (2.34 g/cm3), which can be a advantage by reducing component’s
total weight. Si has very low solubility in Al; therefore it precipitates as pure silicon, hard and
hence helps in improving abrasion resistance. Al-Si alloys form an eutectic at 12.6 wt%
silicon, and at a temperature of 577°C.
Page 17
17
2.2.2 Phase Diagram
Aluminium-Silicon is a basic binary eutectic system with limited solubility of
aluminium in silicon. There is only one invariant reaction in this diagram, namely
L → α + β (eutectic)
In above equation, L is liquid phase, while α is predominant aluminium, and β
predominant silicon. The eutectic reaction occurs at a silicon level of 12.6 wt% at 577°C
temperature.
Depending on Silicon weight percentage, the Aluminium-Silicon alloy systems can be divided
into 3 major categories:
i. Hypo eutectic ( <12 weight % Silicon )
ii. Eutectic ( 12-13 weight % Silicon )
iii. Hyper eutectic ( 14-25 weight % Silicon )
2.2.3 Uses of Al-Si alloys
Al-Si alloys are used in the manufacture of vehicles cover, chassis, power trains and air
conditioning. Aluminium castings are used in various automobile parts. Engine block, one of
Page 18
18
the heavy parts made of cast iron is being switched to aluminum that results in weight
reduction. In automotive power trains, aluminium castings are used almost for 100% of the
pistons, 75% of the cylinder heads, 85% of the intake manifolds and transmission. For chassis
applications, Al-Si castings have been used for 40% of the wheels and for brake components,
brackets, suspension, steering components and instrument panels.
Forged wheels are used where loading conditions are very extreme and where better
mechanical properties is needed. Aluminium alloys have also found extensive application in
heat exchangers.
Aluminium - Silicon alloys are important for many commercial-grade automotive
applications due to their unique properties. Al-Si casting alloy are the most versatile among
all general foundry cast alloys for the production of pistons used in automotive engines.
Commercial uses for hypereutectic alloys are comparatively limited because these are
the most difficult Al alloys to cast and machine due to the high Si contents. Once high Si
content is alloyed into Al, it adds a large amount of heat capacity that must be removed from
the alloy to solidify it during the casting operation. Major variation in the sizes of the primary
Si particles can be found between different areas of the cast structure, causing significant
deviation in the mechanical properties for the specimen. The primary crystals of Si must be
refined so as to accomplish better hardness and wear resistance. Due to these reasons,
hypereutectic alloys are not very cost-effective to fabricate because they have a broad range
of solidification that results in poor castability and requires extra foundry processes to control
the microstructure and the high heat of fusion.
On the other hand, the use of hypo-eutectic and eutectic alloys is widespread in many
industries, because they are:
a. more efficient to produce by casting
b. simpler to control the cast parameters
c. easier to machine than hyper eutectic.
Page 19
19
But, many of them aren’t suitable for high temperature applications, like automotive
field. Because the tensile strength is not as high as expected in the temperature range of
250°C - 400°C [9]
.
2.2.4 Microstructure
Binary Al-Si alloys, in the unmodified state, near to the eutectic composition exhibit
lamellar or acicular eutectic Si, in the form of large plates with sharp edges and sides. Al-Si
alloys that contain more than 12% Silicon show a hyper-eutectic microstructure normally
containing PSP (primary silicon phase) in a eutectic matrix. Cast eutectic alloys having
coarse acicular silicon show low ductility and low strength because of the course plate-like
structure of the Silicon phase leading to untimely crack initiation and fracture during tension.
Similarly, the PSPs in normal hypereutectic alloys are usually very coarse and impart poor
physical and mechanical properties to these Al-Si alloys. Therefore, alloys with a
predominantly eutectic structure should be altered to ensure adequate mechanical strength
and suitable ductility. It is widely accepted that Group IA & IIA elements are effective Al -
Si eutectic modifiers; only Na and Sr, however, have been used extensively in commercial-
grade production of these Al-Si alloys. Refinement of PSPs (primary silicon particles) is
usually achieved by addition of phosphorous to the melt. The rare earth metals are also
capable in modifying eutectic structure of cast aluminium-silicon alloys[10]
. Fig. 2.2 to Fig.
2.7 show microstructures of different Al-Si alloys.
Page 21
21
2.2.5 Wear Behavior
Study of wear behavior has very much importance in various engineering and
automobile industries because wear and tear of components is the major problem of such
industries. Sliding wear behavior and abrasive wear behavior of Aluminium-alloys have been
studied by many investigators. According to their reports, wear and abrasion resistance of Al-
alloy is significantly higher than their base alloys. The hard disperroids protect the surface
from the abrasives by decreasing the penetration depth of the abrasives and the contact
between the abrasive and the matrix. On the other hand, some investigators have reported
changeover of wear behavior of alloys which was reliant on applied load and abrasive size.
Also, it is apparent from the literature about wear that the wear surface and subsurface
experience plastic deformation. This deformation becomes very severe when the abrasives
size is coarser and higher applied load. The wear behavior of an alloy depends upon material
characteristics like shape, size, distribution and volume fraction of the disperrsoids and
experimental parameters like abrasive size and applied load. It has been observed that wear
and abrasion resistance of an alloy increases with rise in volume fraction, size of disperrsoids.
One of the important factors of improvement in wear and abrasion resistance is increase in
the hardness of Al-alloy, due to addition of the hard dispersoids and better protection of
matrix from destructive action of abrasive as the mfp (mean free path ) between the Silicon
Carbide particles is decrease with increase in volume fraction of the SiC particles. Several
investigators have proposed that wear and abrasion resistance of a material also depends on
the ductility and toughness. Reinforcement of Al2O3 particles in aluminium alloy improves
the abrasive wear of the matrix. Reinforcement of coarse particle shows better wear
resistance[5]
.
Page 22
22
Alpas et al.[15]
investigated wear mechanism in eutectic Al Si alloys, tested against
hard steel counter face and observed that advancement of damage event usually comprised of
following steps:
a) Wear of top surfaces of the Si particles by counter face.
b) Embedding of Si particles into aluminium matrix.
c) Plastic deformation of aluminium causing formation of aluminium pile-ups
adjacent to sunken-in Si particles.
d) Wear of elevated portions of aluminium plateaus by the counter face.
The following graphs obtained from the tests by Das et al.[5]
show the variation of wear
rate of Al alloy, as a function of d (sliding distance) under different applied loads.
Fig. 2.8 Wear rate Vs sliding distance of an Al alloy (applied load: 1N)
Page 23
23
Fig. 2.9 Wear rate of Al alloy as a function of sliding distance (applied load: 7N)
2.2.6 Wear Mechanism
Wear processes may be assorted into different types based on the type of load and materials
involved, for e.g., fretting wear, abrasive wear, sliding wear and cavitation. Wear can be
caused by number of mechanisms. But the following four are especially important:
• Adhesion
• Abrasion
• Fatigue wear
• Corrosive wear
Fig 2.10 Schematic images of four represented wear modes [ref wear m]
Page 24
24
Abrasive Wear
It occurs when a solid object is loaded against the particles of material which have
hardness equal or greater than that of the object. Even if the bulk of a material is very soft,
it may still cause abrasive wear due to presence of hard particles
.
Mechanisms of Abrasive Wear
The first mechanism shown in Figure 2.11a, cutting, represents classic model, where a hard
asperity or sharp grit cuts the soft surface. The material that is cut is removed as wear
debris. When the material is brittle, for e.g. ceramic material, fracture of the worn surface
may occur (fig 2.11b). wear debris is formed as a result of the crack convergence.
Figure 2.11 Mechanisms of abrasive wear: microcutting, fracture, fatigue and grain pull-out
When a ductile material is subjected to abrasion by blunt grit, cutting is unlikely and worn
surface is subjected to repeated deformation (Figure 2.11c). Here, wear debris is formed as
a result of surface fatigue. Figure 2.11d shows grain pull-out. This mechanism is mainly
applicable to ceramics; where grain boundary is comparatively weak. Wear debris is due to
loss of entire grain.
Modes of Abrasive Wear
The way the grits pass over the worn surface determines the nature of abrasive wear.
Nature of the abrasive wear is determined by the way the grits pass on the worn surface.
The literature talks of two modes of abrasivewear:
· two-body wear and
· three-body wear.
Page 25
25
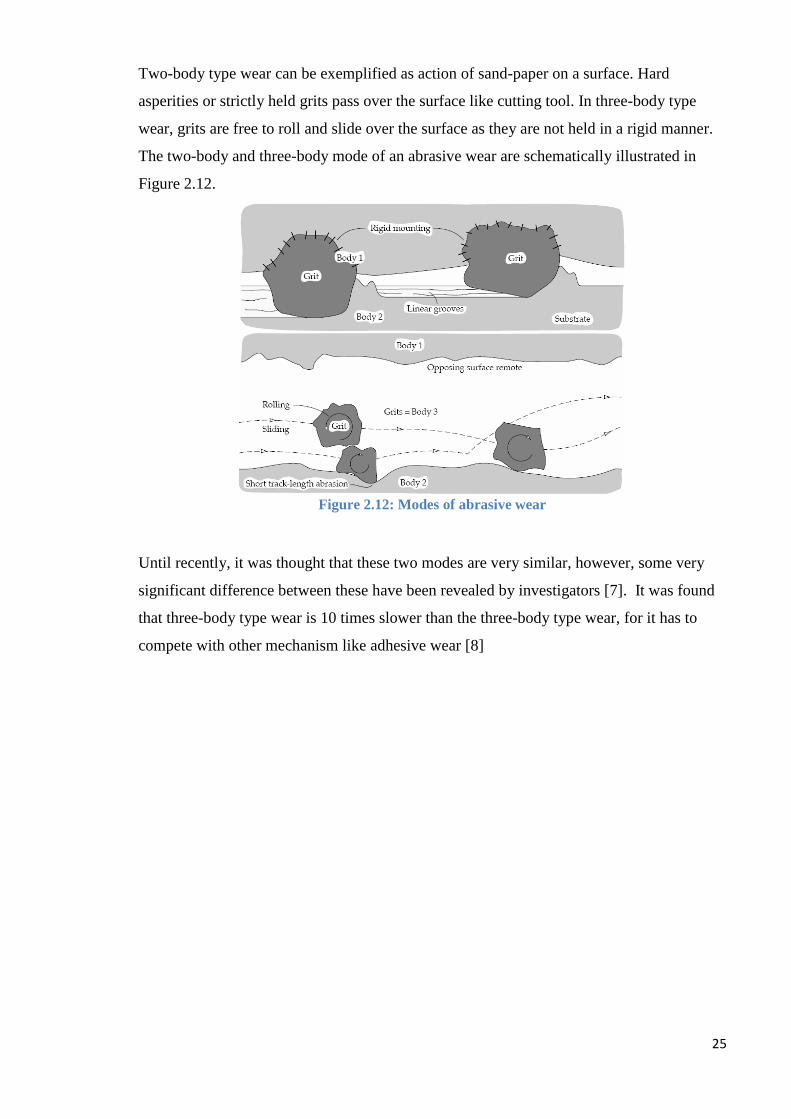
Two-body type wear can be exemplified as action of sand-paper on a surface. Hard
asperities or strictly held grits pass over the surface like cutting tool. In three-body type
wear, grits are free to roll and slide over the surface as they are not held in a rigid manner.
The two-body and three-body mode of an abrasive wear are schematically illustrated in
Figure 2.12.
Figure 2.12: Modes of abrasive wear
Until recently, it was thought that these two modes are very similar, however, some very
significant difference between these have been revealed by investigators [7]. It was found
that three-body type wear is 10 times slower than the three-body type wear, for it has to
compete with other mechanism like adhesive wear [8]
Page 26
26
CHAPTER – 3
EXPERIMENTAL
Page 27
27
3.1 Introduction
An Aluminium-10% silicon alloyblock of dimension 100mm x 100mm x 30mm were
preparedby stir casting route in an induction heating furnace. Three cylindrical samples of
diameter 10mm and height of 30 mm were cut from the block using a highly calibrated lathe
machine. One of the sample was then polished to reveal the microstructure of the alloy. For
this, stereo microscope was used. Wear behaviour of these samples were studied by
conducting several wear tests on computerized Ducom friction and wear monitor pin on-disc
wear test machine. The microstructures of the damaged/weared samples and of the crack
morphology of the surfaces were observed under stereoscope.Profilometric studies were done
to study the surface roughness.Age hardening of the samples was done at 200 C for time
intervals of 4, 6 and 9 hours. The hardness was measured with the Vickers hardness testing
machine. The following gives a detailed overview of the steps taken for different tests.
3.2 Dimensioning 3 cylindrical samples were cut from the block using the lathe machine. The dimensions of
the cut samples were 10mm in diameter and 30mm in height.
3.3 Polishing One of the sample was polished on one side to reveal the microstructure. Mechanical polishing
was done using emery papers in the sequence of 1/0, 2/0, 3/0, and 4/0. After mechanically
polishing the sample, cloth polishing using a 6 micrometer diamond slurry was done. After
obtaining a mirror finish polishing of the sample, the sample was etched and was sent for the
stereo microscopy.
Page 28
28
3.4 Stereo Microscopy
The stereo microscope is a type of optical microscope and does not uses transmitted
light instead uses light reflected from the surface of an object. The instrument uses two
different optical paths with different objective and eyepieces to give different angles to the
right and left eyes. This arrangement gives a 3-D visualization of the sample being tested.
The difference between the light microscope and stereo microscope is that stereo microscope
uses reflected light where as light microscope uses transmitted. The reflected light allows
experimentation on specimens that would otherwise be too opaque or too thick for
microscopy.
Microstructures of the alloy samples were observed under computerized stereo
microscope.The Al-Si samples were mechanically polished upto mirror finishing and etched
before the examination. Characterization is done in etched conditions. Etching was done
using the Keller’s reagent. The micrographs of the samples were obtained.
The same stereo microscope was used for crack morphology of the damaged samples as well.
Figure 3.1: Stereo microscope of Physical Metallugy Lab, NIT Rourkela
Page 29
29
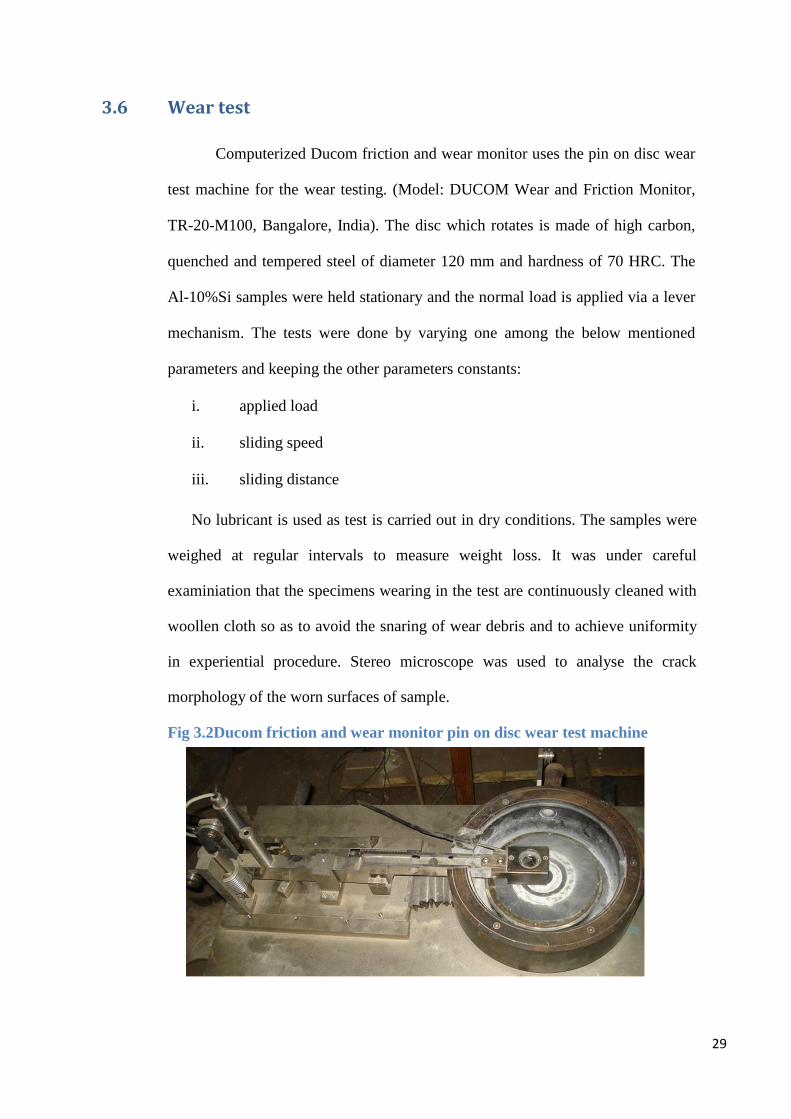
3.6 Wear test
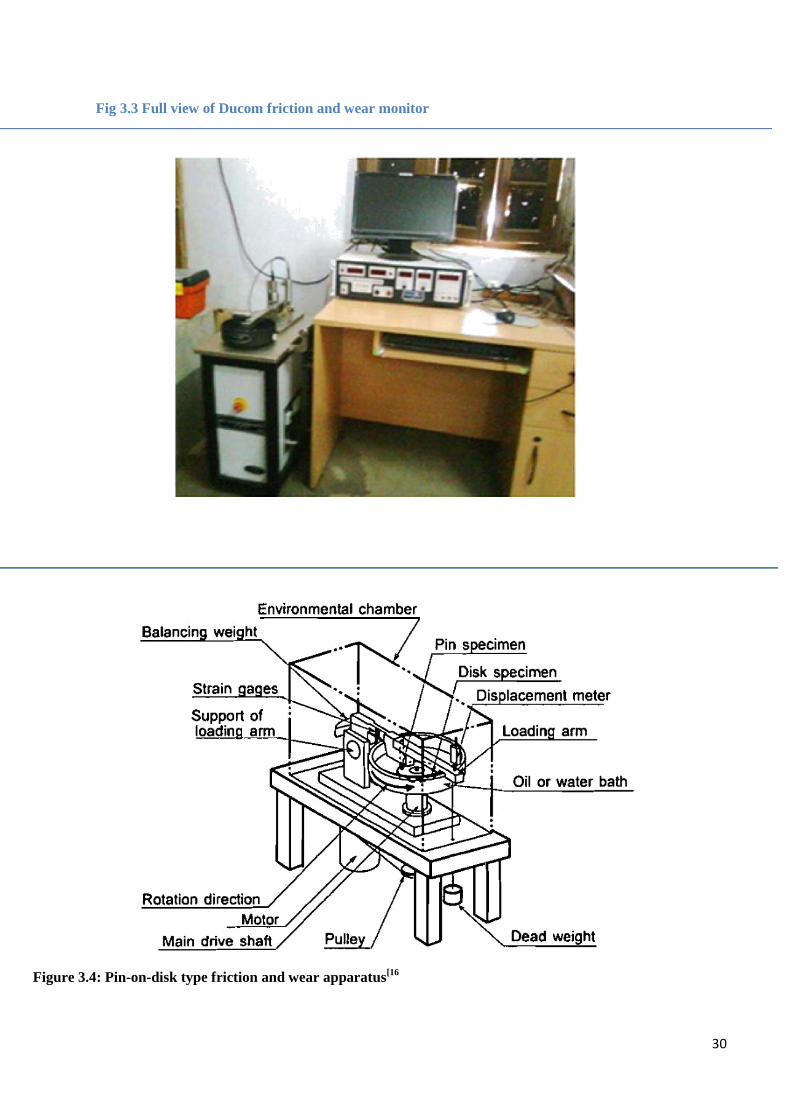
Computerized Ducom friction and wear monitor uses the pin on disc wear
test machine for the wear testing. (Model: DUCOM Wear and Friction Monitor,
TR-20-M100, Bangalore, India). The disc which rotates is made of high carbon,
quenched and tempered steel of diameter 120 mm and hardness of 70 HRC. The
Al-10%Si samples were held stationary and the normal load is applied via a lever
mechanism. The tests were done by varying one among the below mentioned
parameters and keeping the other parameters constants:
i. applied load
ii. sliding speed
iii. sliding distance
No lubricant is used as test is carried out in dry conditions. The samples were
weighed at regular intervals to measure weight loss. It was under careful
examiniation that the specimens wearing in the test are continuously cleaned with
woollen cloth so as to avoid the snaring of wear debris and to achieve uniformity
in experiential procedure. Stereo microscope was used to analyse the crack
morphology of the worn surfaces of sample.
Fig 3.2Ducom friction and wear monitor pin on disc wear test machine
Page 30
30
Fig 3.3 Full view of Ducom friction and wear monitor
Figure 3.4: Pin-on-disk type friction and wear apparatus[16
Page 31
31
3.7 Profilometer: Profilometer was used to study surface roughness.
Introduction Stylus profilometers are basically used in industries and research work to measure surface finish.
The Profilometer have been in use in research and industries for a very long time. Originally an
amplified plot of the surface profile was generated with some average parameters such as Ra. These
parameters were obtained by means of a suitable meter and a simple electronic circuit. By the end of
1970 digital computers were added, and the data acquisition system revolutionized. A large varieties
of data were obtained upon digitization.
Key elements and Schematic diagram of the data acquisition system.
The basic component of data acquisition system is schematically shown in fig 3.7.
Figure 3.5: Stylus ProfilometerVeecoDektat, Electrometallugy Lab, NIT Rourkela
Figure 3.6: Schematic Representation of Profilometer
Page 32
32
Stylus One of the most basic component in stylus Profilometer is the stylus, a tip which actually grazes the
surface and act as a sensor. It acts in the same as skin, eyes etc as interface between the outer
environment and the brain. Stylus tip material, form, size and force are the important parameters in
this case.
Gauge The interface between the stylus and the inner electronics is known as gauge in technical terms.
Gauge contains some crucial electronics that controls the tracking force and sends a feedback as a
result of any changes in roughness, that helps the stylus tip to move over the surface without
damaging itself.
Electronics The gauge gives an output that amplifies and demodulates the electronics signals. It then converts
the digital signal to user comprehensible language and stores the result for analysis.
Figure 3.7: Path of stylus running over a surface
Page 33
33
CHAPTER – 4
RESULTS AND DISCUSSION
Page 34
34
4.1 Introduction
Different tests like macrohardness test, wear test, stereo micrographs and profilometric
studies on Al-Si alloys were carried out. The results obtained from these tests are reported
analysed and discussed further in this chapter.
4.2 Microstructure
Microstructure obtained from computerised stereomicroscope are shown in fig 4.1 for
Al-10% Si under the magnification of 50x.
Figure 4.1 Microstructure at 50x magnification
4.2.1 Discussion
Figure 4.1 shows an optical micrograph of Al-10% Si alloy. Here, light areas are Al – Si
eutectic, the dark dots are pro-eutectic aluminium and the dark patches are PSPs (primary
Silicon particles).
Page 35
35
4.3 Wear Test
The wear tests of Al-Si alloys were carried out with varying applied load of 30N and
80N and varying sliding distance of 2000m, 5000m and 6000m for each value of applied
load. The Revolution per minute was kept constant at 480 RPM and Track diameter was held
constant at 90mm. Following curves were plotted.
i. Time vs. weight
ii. Time Vs. weight loss
iii. Time Vs Friction
The results from the above tests are noted and corresponding curves are drawn as shown in
the next pages.
Figure 4.2: A typical weared surface
Page 36
36
4.3.1Microstructure of worn surface, Frictional Force and Wear Rate
The alloy samples from the wear test with load 30 N and 80 N, sliding speed 480 rpm
and sliding distance 2000 m, 5000m and 6000m are taken and their worn surfaces are
observed with stereo microscope.Following images show the wear rate, micrographs of orn
surfaces taken at low and high magnifications respectively and the friction vs time plot
generated by computer.
Figure 4.3: The figure shows the wear rate of the alloys.
The first figure shows the wear rate when applied load was 30N at sliding distance of 5000m
where as the second figure the wear rate when the applied load was 80N at sliding distance of
5000m. The third figure compares the average slope of the of the plots. As evident from the
third figure, the average slope for 80N wear rate is greater than the average slope for 30N wear
rate. Therefore it is safe to assume that the wear rate increases as the applied load increases.
Page 37
37
Parameters:
Load: 30 N
Track Diamtere: 90mm
Sliding Distance: 2000m
Magnification: 10x Figure: 4.4 and 4.5
Parameters:
Load: 30 N
Track Diamtere: 90mm
Sliding Distance: 5000m
Magnification: 10x Figure: 4.6 and 4.7
Page 38
38
Parameters:
Load: 30 N
Track Diamtere: 90mm
Sliding Distance: 5000m
Magnification: 10x Figure: 4.8 and 4.9
Parameters:
Load: 80 N
Track Diamtere: 90mm
Sliding Distance: 2000m
Magnification: 20x Figure: 4.10 and 4.11
Page 39
39
Parameters:
Load: 80 N
Track Diamtere: 90mm
Sliding Distance: 5000m
Magnification: 20x Figure: 4.12 and 4.13
Parameters:
Load: 80 N
Track Diamtere: 90mm
Sliding Distance: 5000m
Magnification: 20x Figure: 4.14 and 4.15
Page 40
40
The following table and plots show the wear characteristics of the alloys.
Table 4.1: Weight, weight loss and Time data for 30N and 80N for 2000m sliding distance.
Time Distance Weight (in gms)
(30N)
Weight loss(g) (30N)
Time Distance Weight (in gms)
(80N)
Weight loss(g) (80N)
0 0 4.84 0 0 0 4.7712 0
2 271.296 4.8344 0.0056 2 271.296 4.7509 0.0203
4 542.592 4.8301 0.0099 4 542.592 4.7399 0.0313
6 813.888 4.8254 0.0146 6 813.888 4.7342 0.037
8 1085.184 4.8234 0.0166 8 1085.184 4.7289 0.0423
10 1356.48 4.8227 0.0173 10 1356.48 4.728 0.0432
12 1627.776 4.8198 0.0202 12 1627.776 4.7237 0.0475
14.7 1994.026 4.8161 0.0239 14.7 1994.026 4.7199 0.0513
Figure 4.16: Plot of Weight Vs Time for 2000m
Figure 4.17: Plot of weight loss Vs Time for 2000m
4.7
4.72
4.74
4.76
4.78
4.8
4.82
4.84
4.86
0 5 10 15 20
30N
80N
Time (min)
We
igh
t (g
)
0
0.01
0.02
0.03
0.04
0.05
0.06
0 5 10 15 20
30N
80N
Time (min)
Wei
ght
loss
(g)
Weight loss Vs Time for 2km sliding distance
Page 41
41
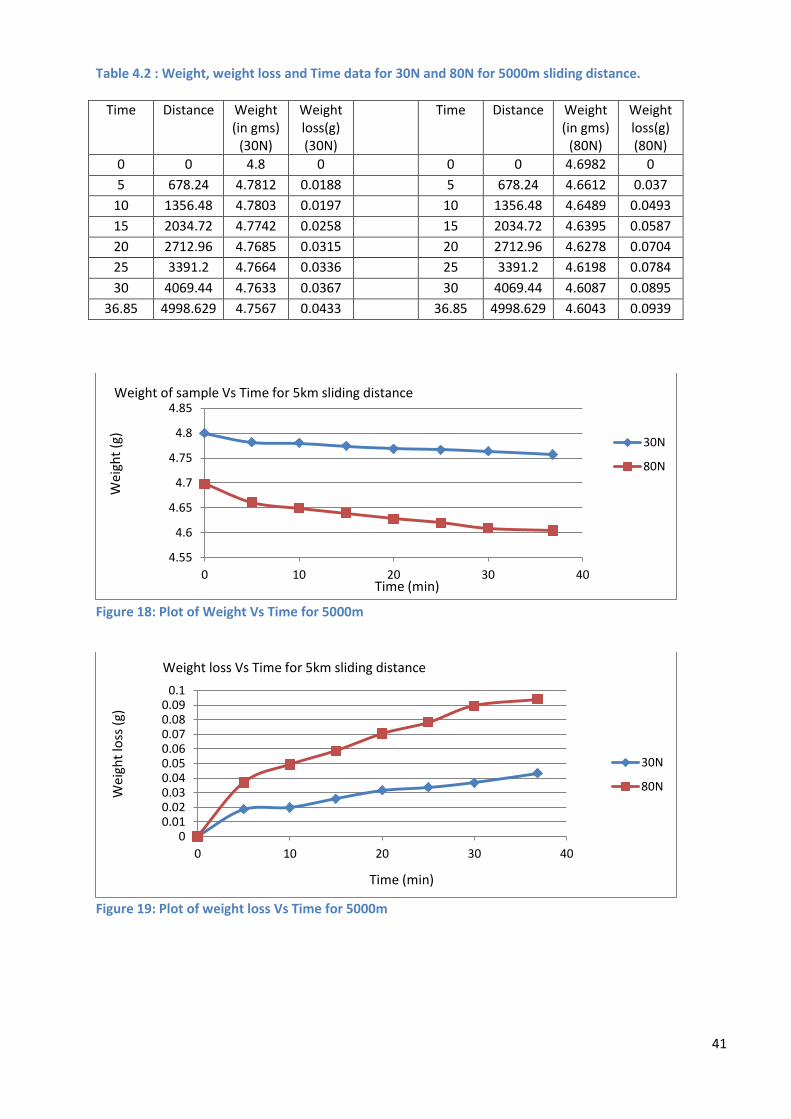
Table 4.2 : Weight, weight loss and Time data for 30N and 80N for 5000m sliding distance.
Figure 18: Plot of Weight Vs Time for 5000m
Figure 19: Plot of weight loss Vs Time for 5000m
4.55
4.6
4.65
4.7
4.75
4.8
4.85
0 10 20 30 40
30N
80N
We
igh
t (g
)
Time (min)
Weight of sample Vs Time for 5km sliding distance
00.010.020.030.040.050.060.070.080.09
0.1
0 10 20 30 40
30N
80N
Wei
ght
loss
(g)
Time (min)
Weight loss Vs Time for 5km sliding distance
Time Distance Weight (in gms)
(30N)
Weight loss(g) (30N)
Time Distance Weight (in gms)
(80N)
Weight loss(g) (80N)
0 0 4.8 0 0 0 4.6982 0
5 678.24 4.7812 0.0188 5 678.24 4.6612 0.037
10 1356.48 4.7803 0.0197 10 1356.48 4.6489 0.0493
15 2034.72 4.7742 0.0258 15 2034.72 4.6395 0.0587
20 2712.96 4.7685 0.0315 20 2712.96 4.6278 0.0704
25 3391.2 4.7664 0.0336 25 3391.2 4.6198 0.0784
30 4069.44 4.7633 0.0367 30 4069.44 4.6087 0.0895
36.85 4998.629 4.7567 0.0433 36.85 4998.629 4.6043 0.0939
Page 42
42
Table 4.3: Weight, weight loss and Time data for 30N and 80N for 8000m sliding distance.
Figure 20: Plot of Weight Vs Time for 6000m
Figure 21: Plot of weight loss Vs Time for 5000m
0
1
2
3
4
5
0 10 20 30 40 50
30N
80NWe
igh
t (g
)
Time (min)
Weight of sample Vs Time for 6km sliding distance
00.10.20.30.40.50.60.70.80.9
0 10 20 30 40 50
30N
80NWei
ght
loss
(g)
Time (min)
Weight loss Vs Time for 6km sliding distance
Time Distance Weight (in gms)
(30N)
Weight loss(g) (30N)
time distance Weight (in gms)
(80N)
Weight loss(g) (80N)
0 0 4.7043 0 0 0 4.0283 0
8.5 1153.008 4.6735 0.0308 8.5 1153.008 3.8247 0.2036
17 2306.016 4.535 0.1693 17 2306.016 3.6231 0.4052
25.5 3459.024 4.4131 0.2912 25.5 3459.024 3.4986 0.5297
34 4612.032 4.2507 0.4536 34 4612.032 3.2921 0.7362
44.2 5995.642 4.192 0.5123 44.2 5995.642 3.2654 0.7629
Page 43
43
Weight loss Vs. Distance for different loads
Figure 22: Plot of distance Vs Weight loss for different loads.
4.3.2 Discussion
The increase in slope of “Wear Vs Time” plot from the 30N load test to 80N load test,
signifies the fact that wear rate increases with increase in applied load.
The microstructure for 30 N load and 2000m sliding distance showed uniformity of
orientation of cracks where as the uniformity gradually loses when the applied load or
sliding distance increased. Also, as the load/sliding distance increased, the
focused/defocused area increased. Therefore, it safe to say that increase in load or sliding
distance increases the wear.
The weight loss rate is initially high, but this rate gradually decreases as time increases.
This is due to the change in mechanism of wear.
Also, it is evident from the “Weight loss Vs Time” plots that rate of weight loss is greater
for greater load. Thus, we may conclude that wear rate increase with increase in load.
The weight loss vs distance curve showed a sudden increase in slope of the curve. This
may be due to the extreme vibration that was observed in the ducom machine, excessive
loss of fractured sample flanges while unloading the sample from the sample holder or
other random experimental faults.
00.10.20.30.40.50.60.70.80.9
0 2000 4000 6000 8000
30 N load
80N load
Weight loss Vs.Distance for different load
distance (m) w
eig
ht
loss
(gm
)
Dist 30N 80N
2000 0.0239 0.0513
5000 0.0433 0.0939
6000 0.5123 0.7629
Table 4.4: Distance vs Weight loss for different loads
Page 44
44
4.4 Profilometer
Figure 23: Profilometer curves from left to right and top to bottom are as follows:
1. Sliding distance: 2000m and Load: 30N
2. Sliding distance: 5000m and Load: 30N
3. Sliding distance: 6000m and Load: 30N
4. Sliding distance: 2000m and Load: 80N
5. Sliding distance: 5000m and Load: 80N
6. Sliding distance: 6000m and Load: 80N
4.4.1 Discussion By a careful observation of the Profilometer curves, it was evident that the surface
roughness increased as the load and distance increased.
Page 45
45
CHAPTER – 5
CONCLUSION
Page 46
46
The conclusions drawn from the conducted investigations are as follows:
1. The prepared aluminium-silicon alloys have homogenous distribution of silicon
throughout the cast. The presence of proeutectic silicon can be seen through the
microstructure.
2. The increase in slope of “Wear Vs Time” plot from the 30N load test to 80N load test,
signifies the fact that wear rate increases with increase in applied load.
3. The microstructure for 30 N load and 2000m sliding distance showed uniformity of
orientation of cracks where as the uniformity gradually loses when the applied load or
sliding distance increased. Also, as the load/sliding distance increased, the
focused/defocused area increased. Therefore, it safe to say that increase in load or sliding
distance increases the wear.
4. The weight loss rate is initially high, but this rate gradually decreases as time increases.
This is due to the change in mechanism of wear.
5. Also, it is evident from the “Weight loss Vs Time” plots that rate of weight loss is greater
for greater load. Thus, we may conclude that wear rate increase with increase in load.
6. The weight loss vs distance curve showed a sudden increase in slope of the curve. This
may be due to the extreme vibration that was observed in the ducom machine, excessive
loss of fractured sample flanges while unloading the sample from the sample holder or
other random experimental faults.
7. By a careful observation of the Profilometer curves, it was evident that the surface
roughness increased as the load and distance increased.
8. Hardness increases as Aging Time increases due to Precipitation of GP Zones or
metastable phases.
9. When aging temperature is high, there could be dissolution of GP zones or metastable
phases and thus reduction in hardness. In such a case hardness peak would be
obtained.
10. Aging temperature improves wear properties empirically verifying that wear improves
concurrently with improve in hardness. So, given an aging temperature of around 200
C and time of approximately 8 hrs, best wear properties would be obtained at 200 C
aged for 6 hours.
Page 48
48
1. Precipitation of Al– 1.12 %Mg 2% Si–0.35% Si and Al–1.07 %Mg 2%Si–0.33%
Cu alloys and their kinetics, Gabber A., Gafar M.A., Mustafa M.S., Abo Zid E.F. ;
J. Alloys Compound., Vol. 429 (2007), pp. 167-175.
2. Aluminum alloys and their properties, David J. R., J. R. David & Associates,
ASM International. Handbook Committee, pp 3-8.
3. Effect of heat treatment and reinforcement on two body abrasive wear; Dash S.,
Mondul D.P., Shawla S., Ramakrishna N.;Vol. 264 (2008): pp. 47–59.
4. Casting of Aluminium Silico Alloys, Cornell R., Badheshia H.K.D.H;
5. Phase Diagrams of Aluminium Alloys; Muray J.L., McAllister A.J.; ASM
Handbook Volume 3: Alloy Phase Diagrams, pp. 312.
6. Automotive Industry and Aluminium Alloys; Miler W.S., Zhang L; M/L Science
and Engineering: A, Volume 280, Issue 1, Pages 37-49.
7. Improved Properties of Al-Si alloys at elevated Temperature and the cast forms;
Lei, J.A., Chend, P.S.; US Patent No. 6399020.
8. Cast Microstructure of Al-Si alloy and their refinement by addition of rare earth
elements. Changi J., Mun I., Chuoi C.; J M/L Scie, Vol.33 (1998): pp. 5015-5023.
9. Study of efficient grain refiner; Khori S., Murthy B., Chakraborthy M.; Mater. Sci.
Eng.: A, Volume 280, Issue 1 (2000): pp. 58-61.
10. Characterization of Piston Alloy of Al-Si; Microscopy - advanced tools for
tomorrow's materials - Autumn School on Materials Science and Electron
Microscopy 2007.
11. Wear Characteristics of Al-Si alloys; Torobian H., Patak J.P. and Tiwari S.N.
Wear, Vol. 172 (1994), pp. 49-58.
12. Sliding wear Behavior of Al-Si alloys in their cast form; Basvakumar K.G.,
Mukund P.G., Chakraborthy ; Mater. Des., Vol. 30 (2009), pp. 1258– 1267