WEATHER INDEX WITH QUEUING COMPONENT FOR NATIONAL AIRSPACE SYSTEM PERFORMANCE ASSESSMENT Dr. Alexander Klein Air Traffic Analysis, Inc, Fairfax, VA [email protected]Richard Jehlen Diana Liang The U.S. Federal Aviation Administration, Washington, DC [email protected][email protected]Abstract The impact of inclement weather – especially convective weather – on the National Airspace System (NAS) is a significant factor affecting NAS operational outcomes such as delays and user costs. It is important to develop objective measures of the combined impact of traffic demand and weather on the air traffic system. Previous efforts have led to the development of Weather Impacted Traffic Index (WITI) metric, a weighted sum of the en-route and terminal weather impact, which we have enhanced further by adding a queuing delay component. The three components are computed for OEP-35 airports on an hourly basis, allowing for a more in-depth analysis of operational impacts. This includes apportioning the impact of en-route convective weather to the affected airports (just as delays manifest themselves at airports). The new metric, the NAS Weather Index (NWX), has higher correlation with the ASPM Delay metric than earlier WITI versions. We have applied this methodology to the analysis of 2004-2006 NAS performance vis-à-vis operational impacts. The NWX metric can be produced on an hourly, daily or monthly basis, NAS- wide or regionalized. It is planned to be used for the FAA’s morning briefings, long-term post-season reviews, and future-NAS analyses. Future work includes developing methods for NAS outcome prediction based on weather forecast. Introduction The impact of inclement weather – especially convective weather – on the National Airspace System (NAS) is significant. Weather has been identified as a contributing or causal factor in over 21% of all accidents from 1994-2003 [1] and over 70% of delays > 15 minutes over the last 5 years [2]. Efforts have been underway to establish a consistent, quantified air transportation weather index that reflects the differing impacts relative to occurrence across the air transportation network. Researcher is in the final stages of quantifying weather’s impact on the NAS. This work has resulted in a number of Weather Impacted Traffic Index (WITI) variants, all of which are NAS-level where a day in the NAS is represented by a single WITI value. It is, however, desirable to expand the level of detail to include both spatial (NAS regions, airports) and temporal (time- of-day) components while retaining the NAS perspective. This would allow for higher-fidelity analysis of weather impacts on the NAS and of the system’s operational outcomes such as the strategies to mitigate the impacts, thus reducing delays, cancellations, operating costs etc. Weather Traffic Demand A T M NAS NAS Operational Outcomes: Delays, Cancellations, Costs Front - end impact: Weather Index Figure 1: NAS operational impact and outcome 7 th USA-Europe ATM R&D Seminar, Barcelona, Spain, July 2007 1
Transcript
WEATHER INDEX WITH QUEUING COMPONENT FOR NATIONAL AIRSPACE SYSTEM PERFORMANCE ASSESSMENT
Abstract The impact of inclement weather – especially
convective weather – on the National Airspace System (NAS) is a significant factor affecting NAS operational outcomes such as delays and user costs. It is important to develop objective measures of the combined impact of traffic demand and weather on the air traffic system. Previous efforts have led to the development of Weather Impacted Traffic Index (WITI) metric, a weighted sum of the en-route and terminal weather impact, which we have enhanced further by adding a queuing delay component. The three components are computed for OEP-35 airports on an hourly basis, allowing for a more in-depth analysis of operational impacts. This includes apportioning the impact of en-route convective weather to the affected airports (just as delays manifest themselves at airports). The new metric, the NAS Weather Index (NWX), has higher correlation with the ASPM Delay metric than earlier WITI versions. We have applied this methodology to the analysis of 2004-2006 NAS performance vis-à-vis operational impacts. The NWX metric can be produced on an hourly, daily or monthly basis, NAS-wide or regionalized. It is planned to be used for the FAA’s morning briefings, long-term post-season reviews, and future-NAS analyses. Future work includes developing methods for NAS outcome prediction based on weather forecast.
Introduction The impact of inclement weather – especially
convective weather – on the National Airspace
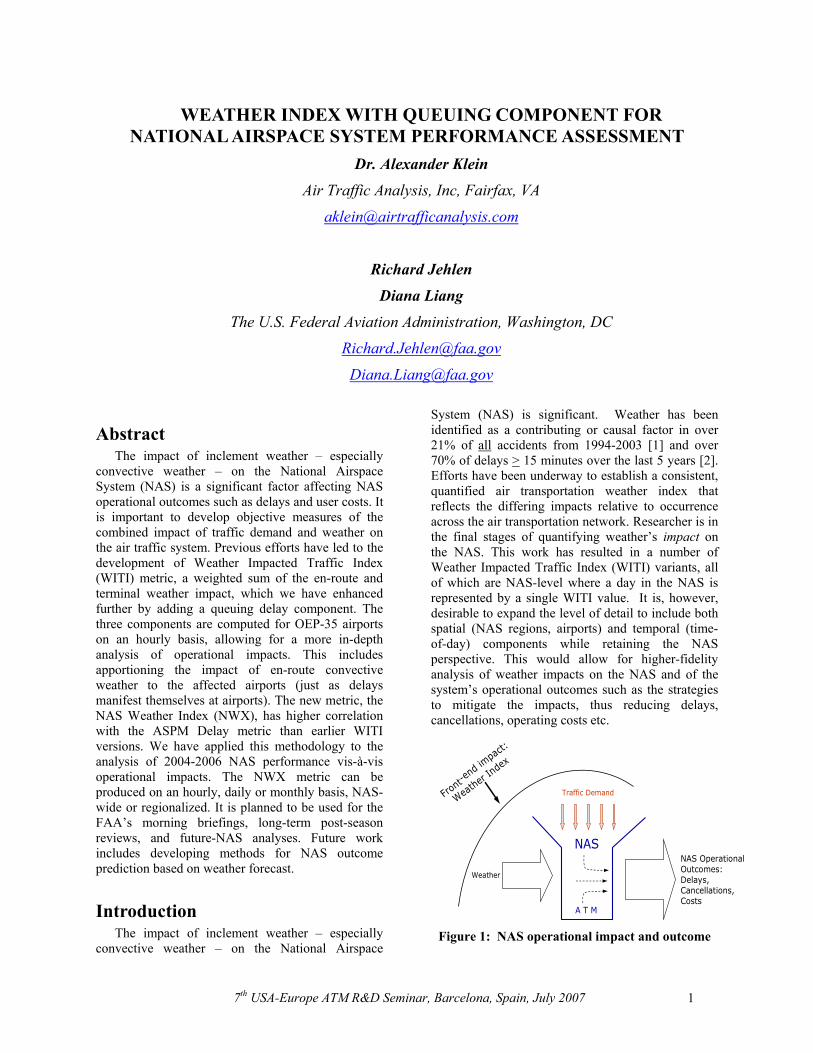
System (NAS) is significant. Weather has been identified as a contributing or causal factor in over 21% of all accidents from 1994-2003 [1] and over 70% of delays > 15 minutes over the last 5 years [2]. Efforts have been underway to establish a consistent, quantified air transportation weather index that reflects the differing impacts relative to occurrence across the air transportation network. Researcher is in the final stages of quantifying weather’s impact on the NAS. This work has resulted in a number of Weather Impacted Traffic Index (WITI) variants, all of which are NAS-level where a day in the NAS is represented by a single WITI value. It is, however, desirable to expand the level of detail to include both spatial (NAS regions, airports) and temporal (time-of-day) components while retaining the NAS perspective. This would allow for higher-fidelity analysis of weather impacts on the NAS and of the system’s operational outcomes such as the strategies to mitigate the impacts, thus reducing delays, cancellations, operating costs etc.
In other words, we would be able to better understand and quantify how “front-end” weather impact results in specific “back-end” outcomes. Relying on a consistent impact index over time will support analysis to identify the “best” strategies to mitigate the impacts and improve the service outcomes such as; delay reduction and increased predictability and efficiency.
Background
Initial Evolution of Weather Index Metric In order to engage the air transportation community
in service level discussions identify system performance improvement opportunities and accurately assess the quality of service delivery, a common performance framework is necessary. In light of the significant impact of weather noted earlier, it was necessary to create a reliable, consistent measure of the impact over differing time intervals with differing weather. The objective is to engage the community with a consensus on “good” vs “bad” weather days, weeks or seasons.
The WITI concept was first proposed by the FAA and developed in [4]. A typical good-weather day with seasonal jet stream pattern was used and, on a rectangular grid covering the NAS, traffic mass (total number of aircraft position reports over a day) in each grid cell was computed. Then, for weather-impacted days, the traffic mass was multiplied by the number of convective weather reports for each grid cell. The result, summed up for the entire NAS, was the En-Route WITI. Also, surface weather reports for major airports were processed into a Terminal WITI and combined with the En-Route WITI as a weighted sum. The WITI is reasonably well correlated with delays and can indicate the unrecoverable portion of the delay.
A similar approach was proposed by Chatterji and Sridhar [5, 6]. While the en-route portion of the WITI was computed using the same method as in [4], more attention was devoted to selecting the significant terminal weather events worth including into the Terminal WITI, of which wind was one of the strongest factors. An interesting observation is that, while considerable effort went into selecting representative good-weather days (for the en-route portion of WITI), it turned out that the resulting WITIs didn’t differ very much. The location and nature of convective weather was a much stronger factor affecting en-route WITI [6].
The paper by Post et al [7] draws on the experience of the MITRE WITI research but approaches
it from a different angle. FZ (flight planned) tracks for actual Severe weather days are used rather than TZ (actual) tracks for good-weather days. EWI (En-Route Weather Index) is calculated and shows good correlation with delays. The focus is on the efficiency of rerouting around weather rather than the overall NAS performance. An important point is made about the methodology for populating the NAS grid:
“While both our approach and the MITRE WITI place a grid over the CONUS airspace and multiply convective activity by some measure of traffic intensity in each cell of the grid, there are two major differences between the two approaches. (…) The WITI uses actual flight tracks from a “good weather day” as the data source for traffic. Our approach, on the other hand, uses flight plan traffic for the particular day being analyzed. Our approach has the advantage of being more dynamic, in that day-to-day (and consequently weekly, monthly, and seasonal) changes in traffic are accounted for.”
The Combined NAS Weather Index (NWX) We have expanded and refined these WITI
computation methods [9]. For en-route convective impact calculation, we chose an approach similar to that proposed in [7] but simpler and more computationally-efficient without much detriment to fidelity, as, for instance, is shown in [9]. Namely, we use “flows” – Great Circle tracks between major airports – as “ideal”, shortest-path unimpeded flight trajectories; we also use actual flight frequencies on these flows scheduled for the day in question.
We then used the 5-minute National Convective Weather Detection (NCWD) reports and calculated how convective weather impacts individual flows between major airports (see Fig. 2 and Fig. 3 below). The impact depends on the severity of the weather and the frequency of traffic on each flow. We also used hourly surface (terminal) weather observations and estimate how a particular type of weather degrades airport capacity.
The NAS Weather Index (NWX) was then constructed as a weighted sum of the en-route and terminal components, and was used for weather impact assessment in the entire NAS. It showed good correlation with NAS-wide delay metrics.
Importantly, this index allows for the regionalization of NAS weather impact analysis: we can now drill down from the NAS level to individual airport / single hour level, or regions e.g. North-East.
7th USA-Europe ATM R&D Seminar, Barcelona, Spain, July 2007 2
Standard airport groupings, e.g. OEP-35 or ASPM-75, can be used.
The Need for a Queuing Component One shortcoming of all previously described
methods was their linear nature in relation to weather and traffic demand. We know, however, that the NAS operational outcome to these impact factors is nonlinear. This calls for introducing a queuing delay model into the computation. We have therefore implemented simple queuing delay calculators for individual airports. This improved the correlation between NAS operational impact and outcome characteristics by 15-20%. It has also made it possible to conduct Future-NAS analyses that reflect non-linear, exponential delay growth trends as traffic demand approaches system capacity.
Weather Index Composition NWX is a weighted sum of three separate
components: En-Route WITI, Terminal [Weather] WITI, and Queuing Delay, computed for each major airport every hour. It can be aggregated into a NAS-wide number and also normalized.
En-Route WITI, Apportioned to Airports Rather than using good-weather-day’s actual
flight tracks, we use Great Circle tracks (“flows”) between major city pairs based on the traffic scheduled/filed for that individual day. We also use the newer National Convective Weather Data (NCWD) product and overlay its 5-min convective reports on a hexagonal grid covering the NAS (see Figure 2).
Figure 2: NCWD and Flows
We calculate intersections of the flows with hexagonal grid cells where convective weather was
reported, hour by hour. We then multiply each flow’s hourly flight frequency by the number of convective reports in all hexagonal cells the flow crosses to get the en-route WITI.
Even though aircraft are affected by weather both at the airport and en route, and while en-route delays are a frequent occurrence, the delays “originate” and “eventuate” at airports. An airplane may depart late (delay at origin airport) and arrive late (delay eventuates at destination airport).
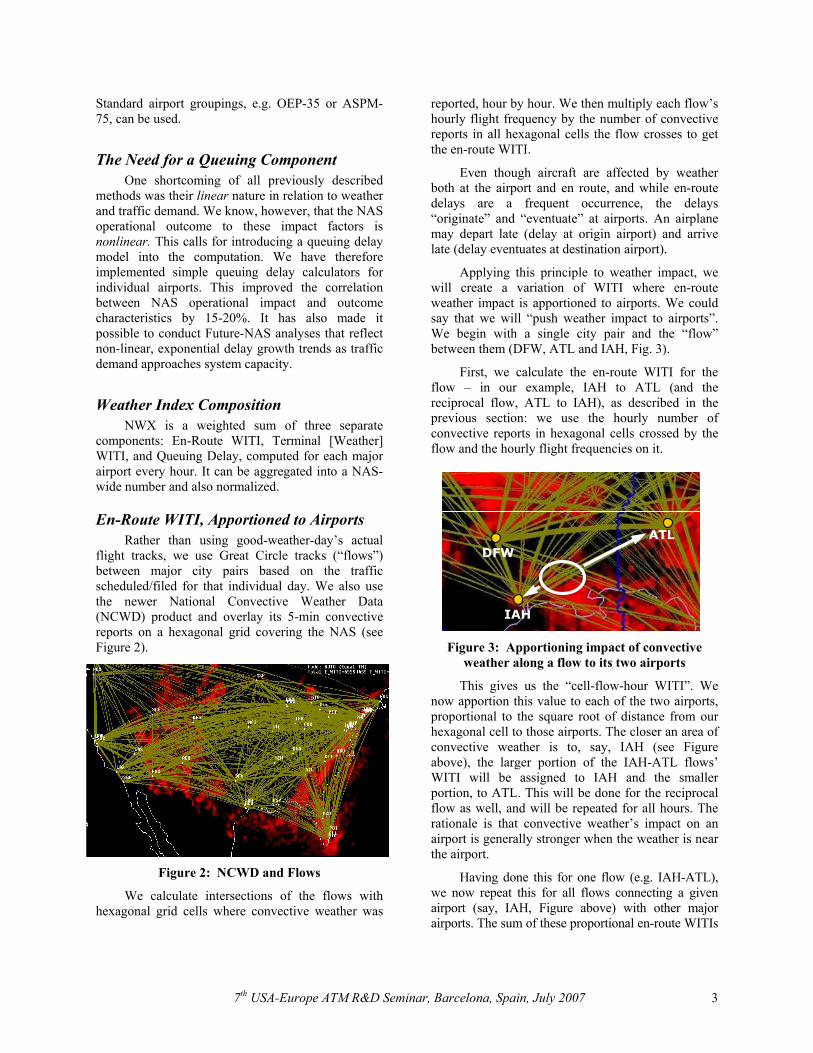
Applying this principle to weather impact, we will create a variation of WITI where en-route weather impact is apportioned to airports. We could say that we will “push weather impact to airports”. We begin with a single city pair and the “flow” between them (DFW, ATL and IAH, Fig. 3).
First, we calculate the en-route WITI for the flow – in our example, IAH to ATL (and the reciprocal flow, ATL to IAH), as described in the previous section: we use the hourly number of convective reports in hexagonal cells crossed by the flow and the hourly flight frequencies on it.
IAH
ATLDFW
IAH
ATLDFW
Figure 3: Apportioning impact of convective weather along a flow to its two airports
This gives us the “cell-flow-hour WITI”. We now apportion this value to each of the two airports, proportional to the square root of distance from our hexagonal cell to those airports. The closer an area of convective weather is to, say, IAH (see Figure above), the larger portion of the IAH-ATL flows’ WITI will be assigned to IAH and the smaller portion, to ATL. This will be done for the reciprocal flow as well, and will be repeated for all hours. The rationale is that convective weather’s impact on an airport is generally stronger when the weather is near the airport.
Having done this for one flow (e.g. IAH-ATL), we now repeat this for all flows connecting a given airport (say, IAH, Figure above) with other major airports. The sum of these proportional en-route WITIs
7th USA-Europe ATM R&D Seminar, Barcelona, Spain, July 2007 3
(which reflect both severity/duration of weather and the amount of traffic impacted) represents this airport’s en-route WITI. This is performed for all N major airports in the NAS, hour by hour.
The NAS-wide En-Route WITI is simply the sum of all En-route WITIs affecting all major airports. It can be recorded by airport / by hour or aggregated as an hourly or daily NAS total.
Terminal WITI The WITI Toolset reads the surface weather
observations for each of the N major airports.
For each hourly weather observation, the software maintains a hierarchy of weather factors, from most severe to less severe, so that if, for instance, a thunderstorm was reported and also some rain, then rain is not a factor for the given hour.
For each of these weather factors, the WITI Toolset stores the airport capacity degradation percentage: a user-definable parameter whose default value is obtained from FAA capacity benchmarks.
The Terminal WITI is calculated by taking the capacity degradation percentage for each airport, every hour, and multiplying it by the number of scheduled hourly operations at this airport. This can again be aggregated for the NAS by adding it up for our N major airports.
Queuing Delay We employ a simple queuing delay simulator
for each airport, as follows.
a) Determine Runway Configuration
Determine the airport’s capacity in a given hour, separately for departures and arrivals:
• Check the wind and dry/wet runway surface condition (from surface weather observations);
• Read in the runway configuration data from airport master file. For each possible runway configuration, starting from the first (highest-capacity), determine if it can be used given the wind and surface conditions;
• Once the first usable runway configuration is found, check the departure and arrival capacity as stored for this configuration.
b) Calculate Lowest Applicable Capacity
Calculate lowest capacity (departure or arrival, respectively) under given conditions. This is the smallest of the following values:
• IMC capacity if conditions are IMC;
• VMC capacity if conditions are not IMC;
• The airport’s maximum (rather than runway-dependent) VMC capacity possibly degraded by non-IMC factors such as wind or local thunderstorm. Degradation can be 0 if there were no significant winds/thunderstorms/etc. The reason we apply capacity degradation to the maximum listed VMC capacity is to avoid “double-counting” the inclement weather effects.
• The airport’s VMC capacity possibly degraded by thunderstorm lines in en-route and especially in the terminal airspace. Degradation can be 0 if there were no significant storm lines around the airport. See next section, Airport Blockage.
c) Determine Traffic Demand Determine the traffic demand for the same hour.
• This data can be obtained from the FAA ASPM database or ETMS data.
d) Compute Estimated Queuing Delay Compute estimated queuing delay for this hour
and carry over any excess demand to the next hour.
• Divide each hour into 15-minute intervals. For each interval, check the number of scheduled departures or arrivals vs. the respective capacity;
• If we have excess capacity over demand, their difference is the size of the departure (or arrival) queue for the given 15-minute interval. We multiply the size of this queue by 15 as an estimate of departure (arrival) delay minutes;
• Process the next 15-minute interval; carry over any unsatisfied traffic demand to this next interval (so the departure/arrival queue may become longer or shorter, depending on overall traffic demand and available capacity);
• Queuing delays are stored for each airport / hour and can be aggregated, just like other Q-WITI components.
7th USA-Europe ATM R&D Seminar, Barcelona, Spain, July 2007 4
Airport Blockage by Lines of Storms This is our initial attempt to capture the non-
linear effect of “route blockage” by convective weather, essentially lines of storms. The method is somewhat similar to that described in [10].
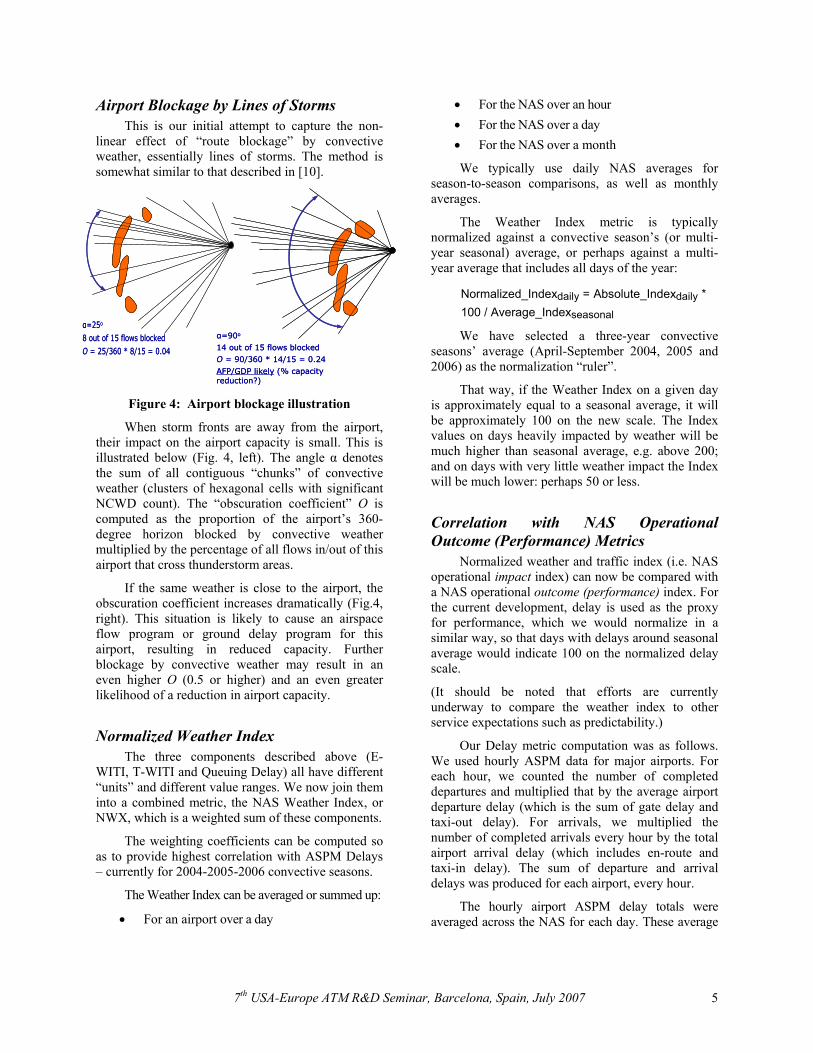
Figure 4: Airport blockage illustration
When storm fronts are away from the airport, their impact on the airport capacity is small. This is illustrated below (Fig. 4, left). The angle α denotes the sum of all contiguous “chunks” of convective weather (clusters of hexagonal cells with significant NCWD count). The “obscuration coefficient” O is computed as the proportion of the airport’s 360-degree horizon blocked by convective weather multiplied by the percentage of all flows in/out of this airport that cross thunderstorm areas.
If the same weather is close to the airport, the obscuration coefficient increases dramatically (Fig.4, right). This situation is likely to cause an airspace flow program or ground delay program for this airport, resulting in reduced capacity. Further blockage by convective weather may result in an even higher O (0.5 or higher) and an even greater likelihood of a reduction in airport capacity.
Normalized Weather Index The three components described above (E-
WITI, T-WITI and Queuing Delay) all have different “units” and different value ranges. We now join them into a combined metric, the NAS Weather Index, or NWX, which is a weighted sum of these components.
The weighting coefficients can be computed so as to provide highest correlation with ASPM Delays – currently for 2004-2005-2006 convective seasons.
The Weather Index can be averaged or summed up:
• For an airport over a day
• For the NAS over an hour • For the NAS over a day • For the NAS over a month
We typically use daily NAS averages for season-to-season comparisons, as well as monthly averages.
The Weather Index metric is typically normalized against a convective season’s (or multi-year seasonal) average, or perhaps against a multi-year average that includes all days of the year:
α=90o
14 out of 15 flows blockedO = 90/360 * 14/15 = 0.24AFP/GDP likely (% capacity reduction?)
α=90o
14 out of 15 flows blockedO = 90/360 * 14/15 = 0.24AFP/GDP likely (% capacity reduction?)
We have selected a three-year convective seasons’ average (April-September 2004, 2005 and 2006) as the normalization “ruler”.
That way, if the Weather Index on a given day is approximately equal to a seasonal average, it will be approximately 100 on the new scale. The Index values on days heavily impacted by weather will be much higher than seasonal average, e.g. above 200; and on days with very little weather impact the Index will be much lower: perhaps 50 or less.
Correlation with NAS Operational Outcome (Performance) Metrics
Normalized weather and traffic index (i.e. NAS operational impact index) can now be compared with a NAS operational outcome (performance) index. For the current development, delay is used as the proxy for performance, which we would normalize in a similar way, so that days with delays around seasonal average would indicate 100 on the normalized delay scale.
(It should be noted that efforts are currently underway to compare the weather index to other service expectations such as predictability.)
Our Delay metric computation was as follows. We used hourly ASPM data for major airports. For each hour, we counted the number of completed departures and multiplied that by the average airport departure delay (which is the sum of gate delay and taxi-out delay). For arrivals, we multiplied the number of completed arrivals every hour by the total airport arrival delay (which includes en-route and taxi-in delay). The sum of departure and arrival delays was produced for each airport, every hour.
The hourly airport ASPM delay totals were averaged across the NAS for each day. These average
7th USA-Europe ATM R&D Seminar, Barcelona, Spain, July 2007 5
delays were then normalized using the same basis as for the weather index (3-year seasonal average = 100).
An example of normalized NWX and delay chart for the 2006 convective season is shown in Figure 5. We consistently achieve around 85% correlation while keeping all days, including possible outliers (e.g. hurricane-impacted days). Without the outliers, the correlation coefficient approaches 90%.
2004-2005-2006 In Review
Monthly Comparisons (Convective Seasons) The Weather Index methodology presented in this
paper was applied to the analysis of NAS operational performance during the 2004, 2005 and 2006 convective seasons (April-September inclusive).
For each hour on each day of these three seasons, we computed the Weather Index using actual airport traffic data, seasonal flow (frequencies) data, as well as detailed en-route convective weather and airport surface weather observations. The OEP-35 airport list was used as standard. The hourly / airport WITI data was aggregated into daily NAS Weather Index data. The same was done for ASPM Delay data. These daily weather-index and average-delay values were normalized using the three-year NAS seasonal average as the 100 “ruler”.
Let us start with a scatter plot showing all three seasons’ weather index vs. delay (Fig. 6).
As we can see, overall NAS performance vis-à-vis weather and traffic demand was slightly better in
2004 (lower gradient of the linear trend line), followed by 2006 and, last, 2005:
Normalized Wx Index vs. Delay, 2006 Apr-Sep, OEP35 (3-yr seasonal avg = 100)
0
50
100
150
200
250
300
4010
6
4050
6
4090
6
4130
6
4170
6
4210
6
4250
6
4290
6
5030
6
5070
6
5110
6
5150
6
5190
6
5230
6
5270
6
5310
6
6040
6
6080
6
6120
6
6160
6
6200
6
6240
6
6280
6
7020
6
7060
6
7100
6
7140
6
7180
6
7220
6
7260
6
7300
6
8030
6
8070
6
8110
6
8150
6
8190
6
8230
6
8270
6
8310
6
9040
6
9080
6
9120
6
9160
6
9200
6
9240
6
9280
6
Wx IndexDelay
Figure 5: Normalized Weather Index and ASPM Delay, 2006 convective season
Wx Index vs. Delay, OEP-35, Apr-Sep 2004-2006Normalized vs. 3-Season Average (=100)
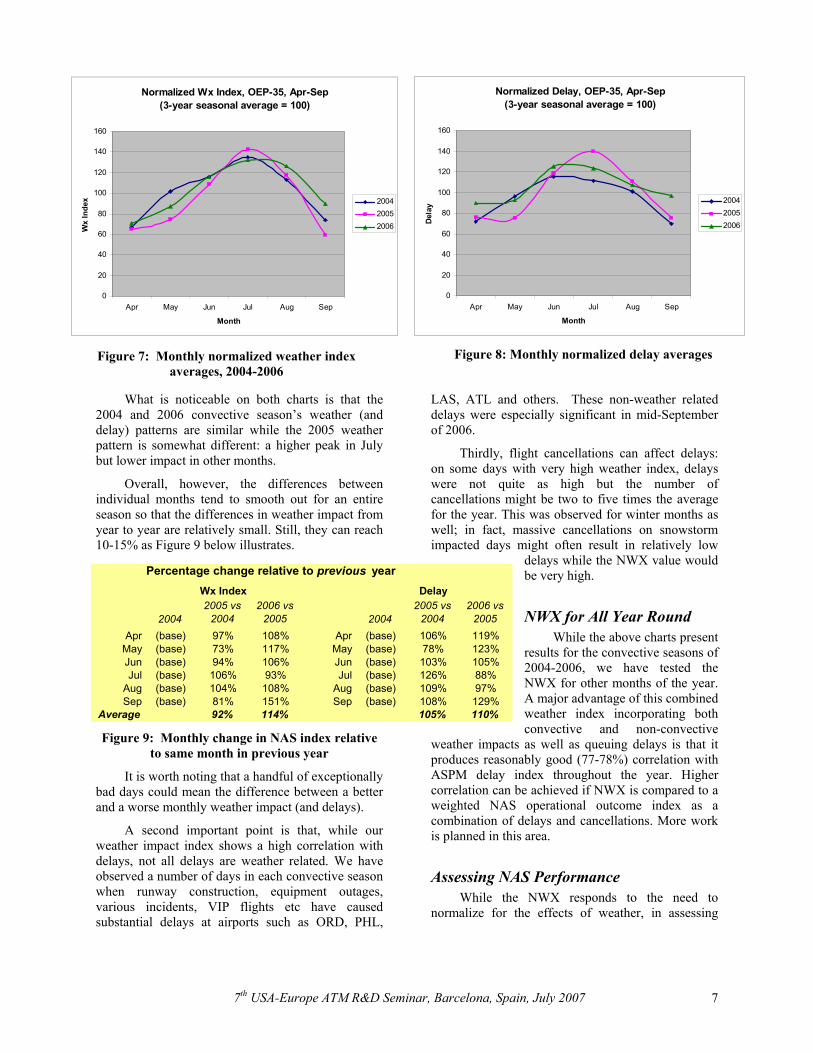
What is noticeable on both charts is that the 2004 and 2006 convective season’s weather (and delay) patterns are similar while the 2005 weather pattern is somewhat different: a higher peak in July but lower impact in other months.
Overall, however, the differences between individual months tend to smooth out for an entire season so that the differences in weather impact from year to year are relatively small. Still, they can reach 10-15% as Figure 9 below illustrates.
Figure 9: Monthly change in NAS index relative to same month in previous year
It is worth noting that a handful of exceptionally bad days could mean the difference between a better and a worse monthly weather impact (and delays).
A second important point is that, while our weather impact index shows a high correlation with delays, not all delays are weather related. We have observed a number of days in each convective season when runway construction, equipment outages, various incidents, VIP flights etc have caused substantial delays at airports such as ORD, PHL,
LAS, ATL and others. These non-weather related delays were especially significant in mid-September of 2006.
Thirdly, flight cancellations can affect delays: on some days with very high weather index, delays were not quite as high but the number of cancellations might be two to five times the average for the year. This was observed for winter months as well; in fact, massive cancellations on snowstorm impacted days might often result in relatively low
delays while the NWX value would be very high.
NWX for All Year Round While the above charts present
results for the convective seasons of 2004-2006, we have tested the NWX for other months of the year. A major advantage of this combined weather index incorporating both convective and non-convective
weather impacts as well as queuing delays is that it produces reasonably good (77-78%) correlation with ASPM delay index throughout the year. Higher correlation can be achieved if NWX is compared to a weighted NAS operational outcome index as a combination of delays and cancellations. More work is planned in this area.
Percentage change relative to previous yearWx Index Delay
20042005 vs
20042006 vs
2005 20042005 vs
20042006 vs
2005Apr (base) 97% 108% Apr (base) 106% 119%
May (base) 73% 117% May (base) 78% 123%Jun (base) 94% 106% Jun (base) 103% 105%Jul (base) 106% 93% Jul (base) 126% 88%
Aug (base) 104% 108% Aug (base) 109% 97%Sep (base) 81% 151% Sep (base) 108% 129%
Average 92% 114% 105% 110%
Assessing NAS Performance While the NWX responds to the need to
normalize for the effects of weather, in assessing
7th USA-Europe ATM R&D Seminar, Barcelona, Spain, July 2007 7
NAS performance there remain two other critical components.
The first is establishment of and consensus regarding a range of service expectations or attributes. The ICAO Global Concept of Operations [11] articulates a list of 11 ATM service expectations. These include safety, efficiency, and predictability, among others.
The second is the development of a methodology, consistent with the weather index, of measuring the weather forecast accuracy. Analysis of ATM performance requires knowing not only what weather conditions were encountered by the ATM system, but also what weather was expected to be encountered – and against which planning and response strategies were developed/enacted.
Once established, these measures used in concert with the weather index will support discussions and planning to identify, analyze and take action to elevate system performance at the “best” investment level. (Cost-effectiveness is also one of the ICAO CONOPS expectations.)
Daily NAS Performance Assessment First and foremost, the methodology presented in
this paper is going to be applied to daily NAS operational impact (and outcome-to-impact ratio) assessment – specifically, readied in time for the FAA’s daily meetings starting at 7:30 am. The availability of good-quality weather and traffic schedule data may present certain challenges. The software performance of the WITI Toolset is more than adequate: a day in the NAS is processed in approximately 60 seconds.
Future plans
Toolset Refinements A series of refinements of the weather index
computation is planned. These include more accurate airport capacity estimation (with Marginal VMC added to IMC and VMC); ability to take flight-planned altitudes vs. thunderstorm cloud (“echo”) tops into account; a more comprehensive sensitivity analysis of the parameter space; a better methodology to deal with hurricane- and snowstorm-impacted days, and other measures.
NAS Outcome Prediction Having developed the Weather Index
quantification methodology, we are now in a better position to analyze outcome variability: for instance, why on seemingly “similar” weather days do NAS outcomes (Delays, Costs) vary so much? As the base of reliable historical data increases we will be able to compare the outcomes from the application of differing response strategies. What are the factors contributing to this variance; can it be reduced? How can we best quantify “similar” weather impact?
Also, this methodology could be applied to NAS operational outcome forecasting. Given the current severe weather forecast (e.g. CCFP) we could use the expanded NWX technique to predict NAS outcomes N hours ahead across a range of differing response strategies. We will also explore how the accuracy of the weather forecast affects NAS outcomes.
Future-NAS Analyses For long-term projections, given forecast traffic
demand, we could use this technique to predict NAS impacts from weather for future years (e.g. 2010 or 2025) under differing scenarios of investments expected to yield differing capacity increases.
Conclusions The development of the NAS Weather Index
(NWX) has established a common framework within which ATM System service performance discussions may be held. It provides the opportunity to segregate individual elements impacting performance that are interdependent with weather and supports analysis to elevate system performance at the best investment level.
Acknowledgements The authors are grateful to Dr. Steve Bradford,
Dave Knorr and Jim Littleton of the FAA, as well as to Dr. Stephane Mondoloni of CSSI, for productive discussions on the NWX development.
References [1] NTSB Weather Related Accident Study, FAA
National Aviation Safety Data Analysis Center (NASDAC), Washington, DC, 2004. At: http://www.asias.faa.gov/aviation_studies/weather_study/studyindex.html
7th USA-Europe ATM R&D Seminar, Barcelona, Spain, July 2007 8
[2] FAA OPSNET and ASPM data. At: http://www.apo.data.faa.gov/
[3] Bennett, M., 2004, Free Flight En Route Metrics, NEXTOR Moving Metrics Workshop, Asilomar, CA, 2006.
[4] Callaham, M., J. DeArmon, A. Cooper, J. Goodfriend, D. Moch-Mooney, and G. Solomos, 2001, Assessing NAS Performance: Normalizing for the Effects of Weather, 4th USA/Europe ATM R&D Seminar, Santa Fe, NM.
[5] Chatterji, G., and Sridhar, B., National Airspace System Delay Estimation Using Weather Weighted Traffic Counts, AIAA Guidance, Navigation, and Control Conference, San Francisco, CA, 2005.
[6] Sridhar, B., Relationship Between Weather, Traffic, and Delay based on Empirical Methods, NEXTOR NAS Performance Workshop, Asilomar, CA, 2006.
[7] J. Post et al, The Use of Flight Track and Convective Weather Densities for National Airspace System Efficiency Analysis, 21st DASC, Piscataway, NY, 2002.
[8] Klein, A., Cost Index as a Metric for Assessing NAS Performance and Weather Impact, Proceedings of the 50th Annual Air Traffic Control Association Conference, Dallas, TX, 2005, pp. 271-280.
[9] Bennett, M., Flexibility and Predictability in Management of Convective Weather Impacts on the NAS, FAA-NEXTOR Moving Metrics Workshop, Asilomar, CA, 2004
[10] Hoffman, B. et al – Weather Forecast Requirements to Facilitate Fix-Based Airport Ground Delay Programs. 12th Conference on Aviation Range and Aerospace Meteorology, 86th AMS Annual Meeting, Atlanta, 2006.
[11] ICAO Doc. 9854 - Global Air Traffic Management Operational Concept, International Civil Aviation Organization (ICAO), Montreal, 1st edition, 2005, ISBN 92-9194-554-4.
Keywords Weather Impacted Traffic Index, NAS
Performance, Metrics.
Authors’ Biographies Dr. Alexander Klein received his PhD in
theoretical mechanics in 1984 from the Institute of Mechanics, Moscow State University. In mid-80’s, Dr. Klein worked at the Computing & Automation Institute of the Hungarian Academy of Science in Budapest where he conducted internationally recognized research in computer graphics and robotics. In 1988, Dr. Klein joined Preston Aviation Solutions in Melbourne, Australia, where he led the development of simulation modeling and decision support tools for the aviation industry. He was the principal designer of TAAM, a sophisticated fast-time gate-to-gate air traffic simulation model that became a de-facto world standard in its field. Since Preston’s acquisition by Boeing in 1999, Dr. Klein worked on a number of Boeing’s ATM, airline operational support, and homeland security related projects. After a 16-year career at Preston, from software engineer to Senior Vice-President, Dr. Klein joined George Mason University in Virginia in 2004 as a Research Professor. He conducted successful FAA-sponsored research in NAS analysis and airspace design, with the main focus on developing the WITI / NAS Weather Index. In August 2006, Dr. Klein started his own business, Air Traffic Analysis, Inc, working on a variety of projects for government agencies and leading organizations in the air transportation field.
Richard Jehlen is Director - Integration for System Operations Services in the FAA’s Air Traffic Organization. His office serves as the principal Air Traffic element responsible for operational concepts such as the NAS Operational Concept and the ICAO Global Concept. It is also responsible for Air Traffic’s validation of the concepts, international harmonization efforts for the future and ultimately the efficient integration of new systems. Prior to his tenure in this office, Mr. Jehlen was the ATS requirements lead for future decision support tools, which were incorporated into the FAA’s Free Flight initiative. Over 22 years in ATC, his responsibilities have included Airspace & Procedures, Military Liaison, Automation and direct operational oversight.
Diana Liang works for the Office of System Architecture and Investment Analysis for the Architecture and System Engineering Division. She is responsible for the development of the NAS Architecture Tool and Interface called CATS-I, directing analyses in support of NAS Concept Validation, and the development of Modeling Tools and Fast-Time Simulations to support that validation. This work includes several models she is developing
7th USA-Europe ATM R&D Seminar, Barcelona, Spain, July 2007 9
jointly with NASA and cooperative efforts with Europe via Eurocontrol. Prior to working for ASD, Ms. Liang worked in the Office of Energy and Environment for two years as the lead for the Emissions and Dispersion Modeling System (EDMS), updated the FAA's Air Quality Handbook and reviewed Environmental Impact Statements related to emissions. Ms. Liang holds a BS in Computer Engineering.
7th USA-Europe ATM R&D Seminar, Barcelona, Spain, July 2007 10