Introduction Weather is a part of our daily lives. Almost all of our activities revolve around the weather and it is often the first topic in conversation. Weather reports take up almost a third of a 30-minute newscast with updates reported throughout the day on television and radio. Also a part of our daily lives are wireless devices and the Internet. People are constantly making phone calls in their cars, checking their email every ten minutes, and surfing the web for information. These three concepts of weather, wireless devices, and the Internet have always interested me. Integrating these concepts into one project created an enticing challenge for me to tackle. This is why I propose to design and build a Wireless Weather Station with a Web Interface. General Description This weather station would include a remote station for monitoring outdoor weather conditions and a base station that would connect to the Internet via a Local Area Network (LAN). The remote station would take temperature, humidity, and pressure measurements and transmit the data using radio frequencies. The remote station can be mounted anywhere outside a house or building and be monitored without running any cables. This is a great benefit because the installation only involves a few screws as opposed to fishing cables under buildings or through walls. The base station would receive the data and display it on a web page. Weather data could be displayed on any computer in the world, giving the user the ability to check the weather at their home, while at work, or even on vacation. Weather information would be updated ten times an hour. The web page will also display if the weather data (temperature, humidity, and 1
Transcript
Introduction
Weather is a part of our daily lives. Almost all of our activities revolve around the
weather and it is often the first topic in conversation. Weather reports take up almost a third of a
30-minute newscast with updates reported throughout the day on television and radio.
Also a part of our daily lives are wireless devices and the Internet. People are constantly
making phone calls in their cars, checking their email every ten minutes, and surfing the web for
information.
These three concepts of weather, wireless devices, and the Internet have always interested
me. Integrating these concepts into one project created an enticing challenge for me to tackle.
This is why I propose to design and build a Wireless Weather Station with a Web Interface.
General Description
This weather station would include a remote station for monitoring outdoor weather
conditions and a base station that would connect to the Internet via a Local Area Network
(LAN). The remote station would take temperature, humidity, and pressure measurements and
transmit the data using radio frequencies. The remote station can be mounted anywhere outside
a house or building and be monitored without running any cables. This is a great benefit because
the installation only involves a few screws as opposed to fishing cables under buildings or
through walls.
The base station would receive the data and display it on a web page. Weather data could
be displayed on any computer in the world, giving the user the ability to check the weather at
their home, while at work, or even on vacation. Weather information would be updated ten
times an hour. The web page will also display if the weather data (temperature, humidity, and
1
pressure) has risen or fallen since the last measurement. Figure 1.1 shows the major system
hardware required for this project.
Optional features include a built in display on the base station that would give current
weather conditions without having to log onto the Internet. Sensors for monitoring indoor
conditions could be added as well. Also, a 24 hour data logger could be viewed on an additional
web page, which would be created in software and require no additional hardware. These
optional features will not be added until all of the main features are finished. However, hardware
and software resources will be allocated as if the optional features were in place.
Figure 1.1: System Hardware Block Diagram
Humidity Sensor
Remote Station MCU
Temperature Sensor
Pressure Sensor
RF Transmitte
RF Receiver
Optional LCD Base
Station MCU
Optional Temperature
Sensor Optional Humidity
Sensor
Embedded Web Server
2
Functional Description of Hardware
The hardware is broken down into two main parts: the remote station and the base
station. Both will contain a micro controller unit (MCU), RF section, and power supply. The
remote station will also have a sensor section, and the base station will have an embedded web
server. Again, the optional hardware features for the base station include an LCD screen and
sensors to monitor indoor conditions.
Remote Station
The main function of the remote station is to collect the weather conditions and transmit
the data to the base station. The detailed remote station hardware block diagram is shown in
Figure 2.1.
The remote station will have a 68HC908QT4 (QT4) MCU from Motorola at its core
controlling the connected peripherals. The QT4 is a part of Motorola's new Nitron 8-bit MCUs
that are designed to offer high performance at a low cost. The QT4 comes in an 8-pin dip or
SOIC package and features:
• 4.0K Bytes of in-application reprogrammable Flash and 128 Bytes of RAM
• 4 Channel 8-bit analog to digital converter
• Selectable trip point low-voltage inhibit (LVI)
• Computer operating properly (COP) timer with auto wake-up from stop
• 5 Bi-Directional and 1 input only pins
This small chip offers the power and flexibility needed for the remote station functions
and offers a unique power management system. The QT4 has the ability to wake itself up
without the need for an external crystal. Because the QT4 has an internal oscillator, in software,
it can be programmed to wakeup after a specified amount of time has passed. The QT4 also has
3
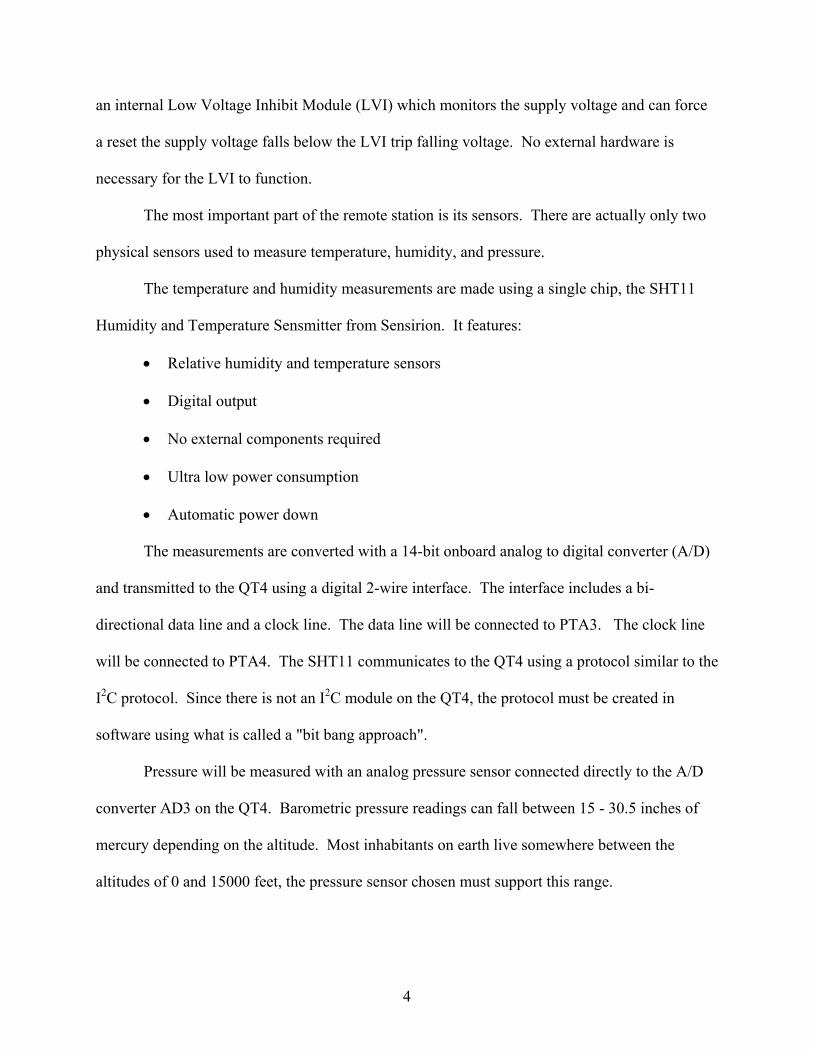
an internal Low Voltage Inhibit Module (LVI) which monitors the supply voltage and can force
a reset the supply voltage falls below the LVI trip falling voltage. No external hardware is
necessary for the LVI to function.
The most important part of the remote station is its sensors. There are actually only two
physical sensors used to measure temperature, humidity, and pressure.
The temperature and humidity measurements are made using a single chip, the SHT11
Humidity and Temperature Sensmitter from Sensirion. It features:
• Relative humidity and temperature sensors
• Digital output
• No external components required
• Ultra low power consumption
• Automatic power down
The measurements are converted with a 14-bit onboard analog to digital converter (A/D)
and transmitted to the QT4 using a digital 2-wire interface. The interface includes a bi-
directional data line and a clock line. The data line will be connected to PTA3. The clock line
will be connected to PTA4. The SHT11 communicates to the QT4 using a protocol similar to the
I2C protocol. Since there is not an I2C module on the QT4, the protocol must be created in
software using what is called a "bit bang approach".
Pressure will be measured with an analog pressure sensor connected directly to the A/D
converter AD3 on the QT4. Barometric pressure readings can fall between 15 - 30.5 inches of
mercury depending on the altitude. Most inhabitants on earth live somewhere between the
altitudes of 0 and 15000 feet, the pressure sensor chosen must support this range.
4
The data will be transmitted to the base station via the TLP418 418Mhz ASK RF
Transmitter from Laipac Technology. This transmitter is a "data in/data out" device. This means
any data serially sent to the data pin will be transmitted serially through an antenna. The antenna
used will be a standard 50 ohm 1/4 wave whip antenna from Linx Technologies. The RF
Transmitter data pin will be connected to PTA0 on the QT4. The data will be sent the RF
Transmitter over a serial connection using the "bit-bang approach".
For transmission, a protocol must be used to assemble the data into packet form. The
first thing a protocol must able to do is identify the difference between noise and valid data. To
do this, the transmission protocol must begin with one or more start bytes. A 255 followed by a
zero will form the start packet in the transmission protocol. The receiver protocol would then
only accept packets that start with a 255 followed by a 0.
The next bytes will consist of the temperature, which is duplicated two times for a total of
three copies. The redundancy provided for a simple method of forward error correction. The
correction is achieved by comparing the bits of each of three copies of the data. For example, if
two or more bits are set are set, the corrected version has that bit set:
• An asynchronous serial communications interface (SCI)
• Both byte-erasable EEPROM and flash EEPROM on the same device
The HC12 was chosen because of its flexibility and ample supply of resources. Enough
resources are left available to connect an optional LCD display as well as sensors for monitoring
indoor conditions.
7
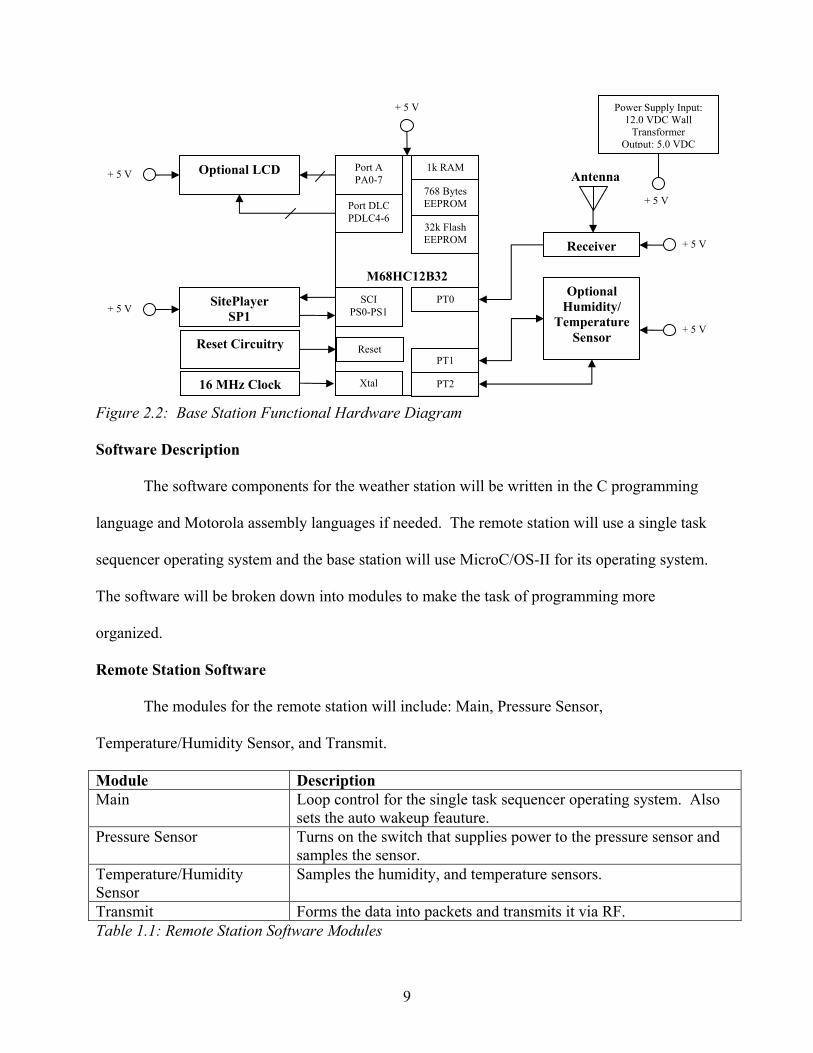
The base station receives the transmitted data from the remote station via the RLP418
418Mhz ASK RF Receiver, also from Laipac Technology. The receiver sends the data via a
serial connection into the HC12. The output of the RF Receiver will be connected to Port T
(PT0). The same antenna for the transmitter will be used for the receiver. The reception
protocol will have the same packet structure as the transmission protocol.
The SitePlayer SP1 Web Server Coprocessor from NetMedia will be used to connect the
HC12 to the Internet. The SitePlayer is a complete Ethernet web server in approximately one
square inch and features:
• Real-time changing graphics for displays, bar graphs, buttons, switches, and knobs
• 48K bytes of flash web pages, Ethernet downloadable
• Serial Port for processor interface
The Siteplayer will be connected to the SCI Port (PS0-1).
The optional LCD display can be connected to Port A (PA0-7) and Port DLC (PDLC4-
6). The optional sensor that could be added would consist of another SHT11 Humidity and
Temperature Sensmitter from Sensirion. The SHT11 would be interfaced with the HC12 the
same way as was on the QT4. Only temperature and humidity will be measured for indoor
conditions because pressure is constant from indoor to outdoor. The data line would be
connected to Port T (PT1) and the clock line to Port T (PT2). A 16 MHz crystal will be
connected to Xtal on the HC12. If the optional 24 hour data logger is added, accurate clock
timing will be required. To accomplish accurate timing, a crystal with an accuracy of 30 parts
per million will be used. The optional clock would be created in software.
The power supply for the base station will consist of a 12 VDC wall transformer, which
will be regulated to 5 VDC using a Linear Regulator.
8
+ 5 V Power Supply Input: 12.0 VDC Wall
Transformer Output: 5.0 VDC
Port A 1k RAM Optional LCD + 5 V Antenna PA0-7 768 Bytes EEPROM + 5 V Port DLC
PDLC4-6 32k Flash EEPROM + 5 V Receiver
M68HC12B32Optional
SitePlayer PT0 SCI Humidity/ Temperature
Sensor
+ 5 V PS0-PS1 SP1+ 5 V
Reset Circuitry Reset PT1
16 MHz Clock Xtal PT2
Figure 2.2: Base Station Functional Hardware Diagram
Software Description
The software components for the weather station will be written in the C programming
language and Motorola assembly languages if needed. The remote station will use a single task
sequencer operating system and the base station will use MicroC/OS-II for its operating system.
The software will be broken down into modules to make the task of programming more
organized.
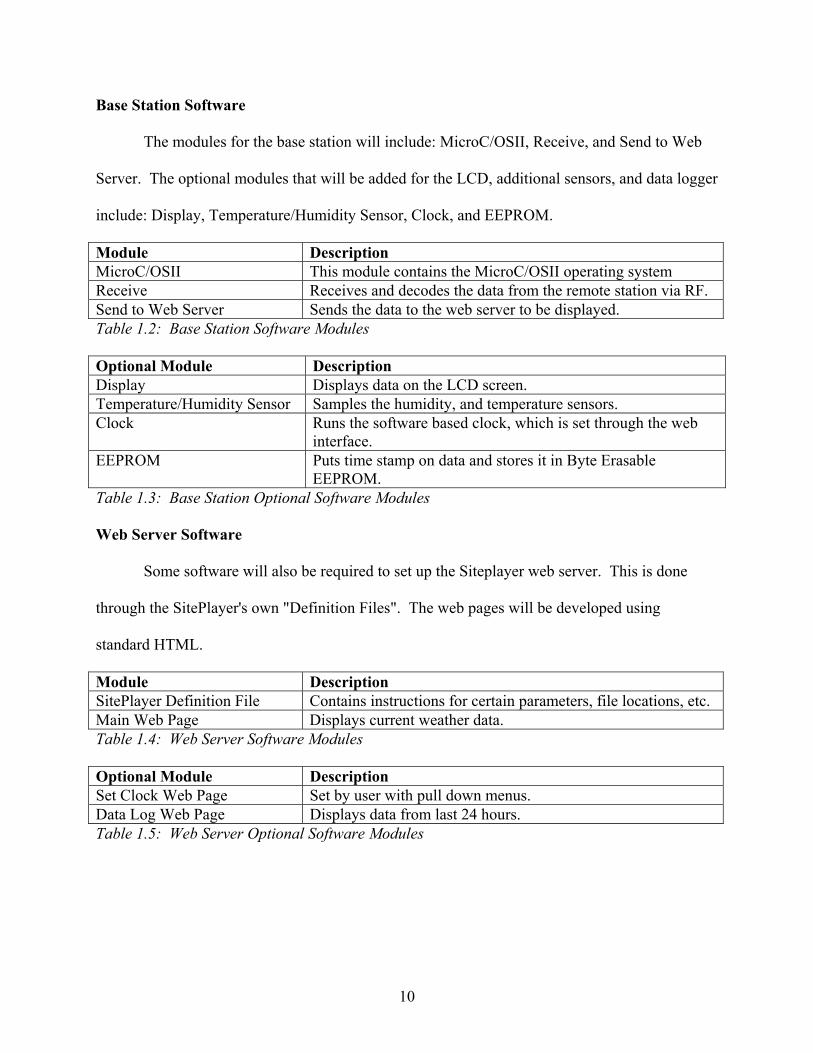
Remote Station Software
The modules for the remote station will include: Main, Pressure Sensor,
Temperature/Humidity Sensor, and Transmit.
Module Description Main Loop control for the single task sequencer operating system. Also
sets the auto wakeup feauture. Pressure Sensor Turns on the switch that supplies power to the pressure sensor and
samples the sensor. Temperature/Humidity Sensor
Samples the humidity, and temperature sensors.
Transmit Forms the data into packets and transmits it via RF. Table 1.1: Remote Station Software Modules
9
Base Station Software
The modules for the base station will include: MicroC/OSII, Receive, and Send to Web
Server. The optional modules that will be added for the LCD, additional sensors, and data logger
include: Display, Temperature/Humidity Sensor, Clock, and EEPROM.
Module Description MicroC/OSII This module contains the MicroC/OSII operating system Receive Receives and decodes the data from the remote station via RF. Send to Web Server Sends the data to the web server to be displayed. Table 1.2: Base Station Software Modules Optional Module Description Display Displays data on the LCD screen. Temperature/Humidity Sensor Samples the humidity, and temperature sensors. Clock Runs the software based clock, which is set through the web
interface. EEPROM Puts time stamp on data and stores it in Byte Erasable
EEPROM. Table 1.3: Base Station Optional Software Modules Web Server Software Some software will also be required to set up the Siteplayer web server. This is done
through the SitePlayer's own "Definition Files". The web pages will be developed using
standard HTML.
Module Description SitePlayer Definition File Contains instructions for certain parameters, file locations, etc. Main Web Page Displays current weather data. Table 1.4: Web Server Software Modules Optional Module Description Set Clock Web Page Set by user with pull down menus. Data Log Web Page Displays data from last 24 hours. Table 1.5: Web Server Optional Software Modules
10
User Interface Description The user interface will consist of a PC with a network card. Using any standard HTML
browser the user can log into their weather station and view the current weather. The main page
of the weather station will display the outdoor humidity, temperature, and pressure. The main
page will also display whether these values are rising or falling with a simple arrow graphic.
Optionally, there will also be a clock displaying the current date and time as well as links to set
the clock and view the 24 hour data log. The optional indoor conditions would be displayed in a
similar fashion.
Current Weather Conditions
7 0 . 5Temperature: ºF
6 0 . 4Humidity: %
2 9 . 5 HgPressure:
Figure 3.1: Weather Station Main Page
11
Last 24 HoursTime Temp. (º F) Humidity (% RH) Pressure (Hg) 12 am 55.5 40.6 28.3 1 am 55.3 40.9 29.3 2 am 55.4 40.6 29.3 3 am 55.6 40.1 29.3 4 am 55.5 40.6 29.3 5 am 56.5 40.6 29.5 6 am 57.5 40.6 29.7 7 am 58.2 40.3 29.3 8 am 59.1 40.6 29.3 9 am 60.5 40.6 29.7 10 am 61.5 40.2 30.1 11 am 63.5 41.1 30.3 12 pm 63.5 41.1 30.3 etc etc etc etc
Back
Figure 3.2: Optional Weather Station Last 24 Page
Set ClockMonth Day Year Hour Minute PM
Set Back
Figure 3.3: Optional Weather Station Set Clock Page with pull down menus.
12
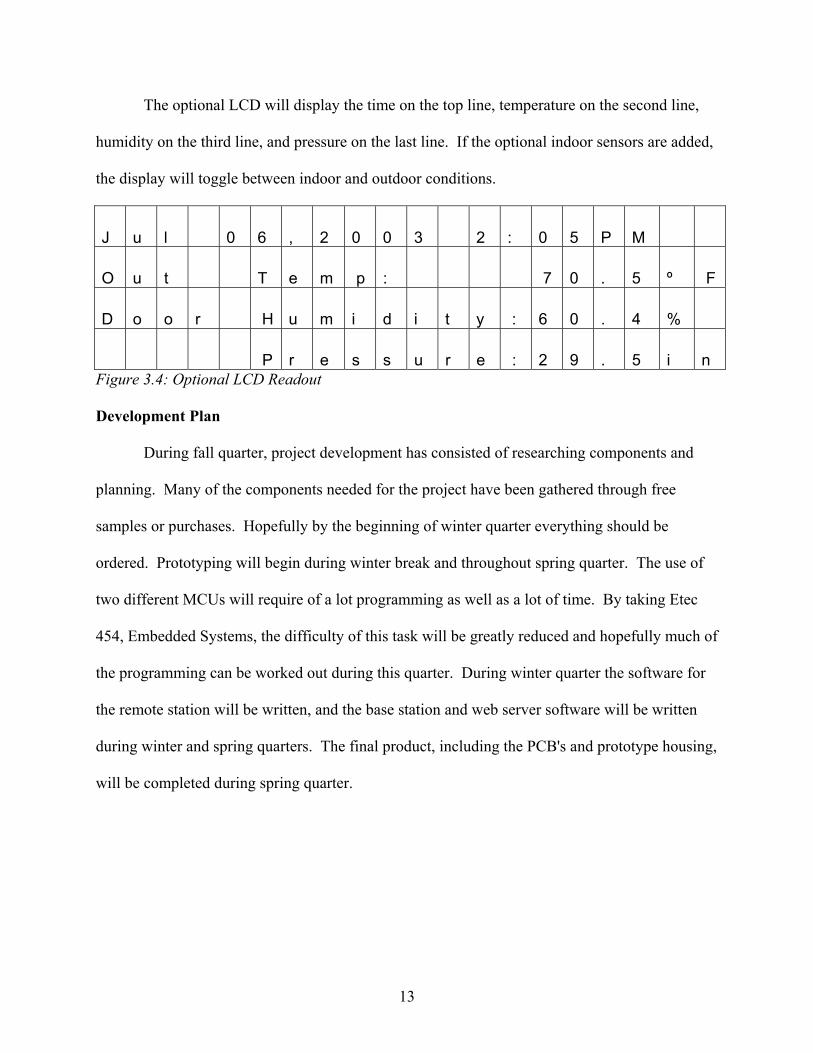
The optional LCD will display the time on the top line, temperature on the second line,
humidity on the third line, and pressure on the last line. If the optional indoor sensors are added,
the display will toggle between indoor and outdoor conditions.
J u l 0 6 , 2 0 0 3 2 : 0 5 P M
O u t T e m p : 7 0 . 5 º F
D o o r H u m i d i t y : 6 0 . 4 %
P r e s s u r e : 2 9 . 5 i n Figure 3.4: Optional LCD Readout
Development Plan
During fall quarter, project development has consisted of researching components and
planning. Many of the components needed for the project have been gathered through free
samples or purchases. Hopefully by the beginning of winter quarter everything should be
ordered. Prototyping will begin during winter break and throughout spring quarter. The use of
two different MCUs will require of a lot programming as well as a lot of time. By taking Etec
454, Embedded Systems, the difficulty of this task will be greatly reduced and hopefully much of
the programming can be worked out during this quarter. During winter quarter the software for
the remote station will be written, and the base station and web server software will be written
during winter and spring quarters. The final product, including the PCB's and prototype housing,
will be completed during spring quarter.
13
The following is a schedule for the rest of fall quarter and subsequent winter and spring
quarters.
Week Task Week 10 Order the rest of required parts, Solder SHT11 chip onto surfboard and place in
Week Task Week 1 Construct and test power supply for remote and base stations Week 2 Construct prototypes for remote and base station Week 3 Become familiar with CodeWarrior Week 4 Play Table 2.2: Christmas Break Schedule
Week Task Week 1 Work on software for the Main module for the remote station Week 2 Work on software Pressure Sensor module for the remote station Week 3 Work on software for the Temperature/Humidity Sensor module for the remote
station Week 4 Work on software for the Transmit module for the remote station Week 5 Work on software for the MicroC/OSII module for the base station Week 6 Work on software for the Receive module for the base station Week 7 Work on software for the Send to Web Server module for the base station Week 8 Work on software for the SitePlayer Definition File module for the web server Week 9 Work on software for the Main Web Page module for the web server Week 10 Spare Week Week 11 Finals Week Table 2.3: Winter Quarter Schedule
Week Task Week 1 Testing and debugging Week 2 Testing and debugging Week 3 Get PCB's printed and soldered Week 4 Get PCB's printed and soldered Week 5 Add optional hardware features to the prototype Week 6 Add optional software features to the prototype Week 7 Construct housing for final product Week 8 Package into final product for demonstration Week 9 Spare Week Week 10 Spare Week Week 11 Finals week Table 2.4: Spring Quarter Schedule
14
Development Hardware and Software
All development of this project will take place at Western Washington University's Ross
Engineering Technology Building EET 340 Lab. This lab has all the required hardware and
software needed to complete this project. The development hardware needed for the project
include: a digital multimeter, a mixed signal oscilloscope, a digital oscilloscope, a programmable
power supply, and a soldering iron. Three evaluation boards (EVB) are also needed, one for the
QT4, one for the HC12 and one for the SitePlayer. The MCU EVBs are provided by the
department and a Siteplayer EVB must be purchased. The development software to complete
this project will include several packages including: CodeWarrior Development Studio for
HTML 4.0 HTTP 1.1 Ethernet 10baseT IP Address Static or Dynamic through DHCP Server Web Browser IE 4.0, Netscape 6.0 or higher
Table 3.2: Internet Requirements Specifications
• Power Requirements
Batteries (3-D Cells) Worst Case Power Dissipation 25 mA Average Power Dissipation 4.25 mA Estimated Life 3 months
Table 3.3: Remote Station Power Requirements
12 VDC Wall Transformer Worst Case Power Dissipation 200 mA Table 3.4: Base Station Power Requirements
• Special Environmental Requirements
o Outdoor Remote Station must handle severe weather conditions, including wind and rain (final product)
o Outdoor Remote Station must be within 150 feet of Indoor Base Station o Remote Station Operational between -20 ºC to 50 ºC o Base Station Operational between 0 ºC to 50 ºC
17
18
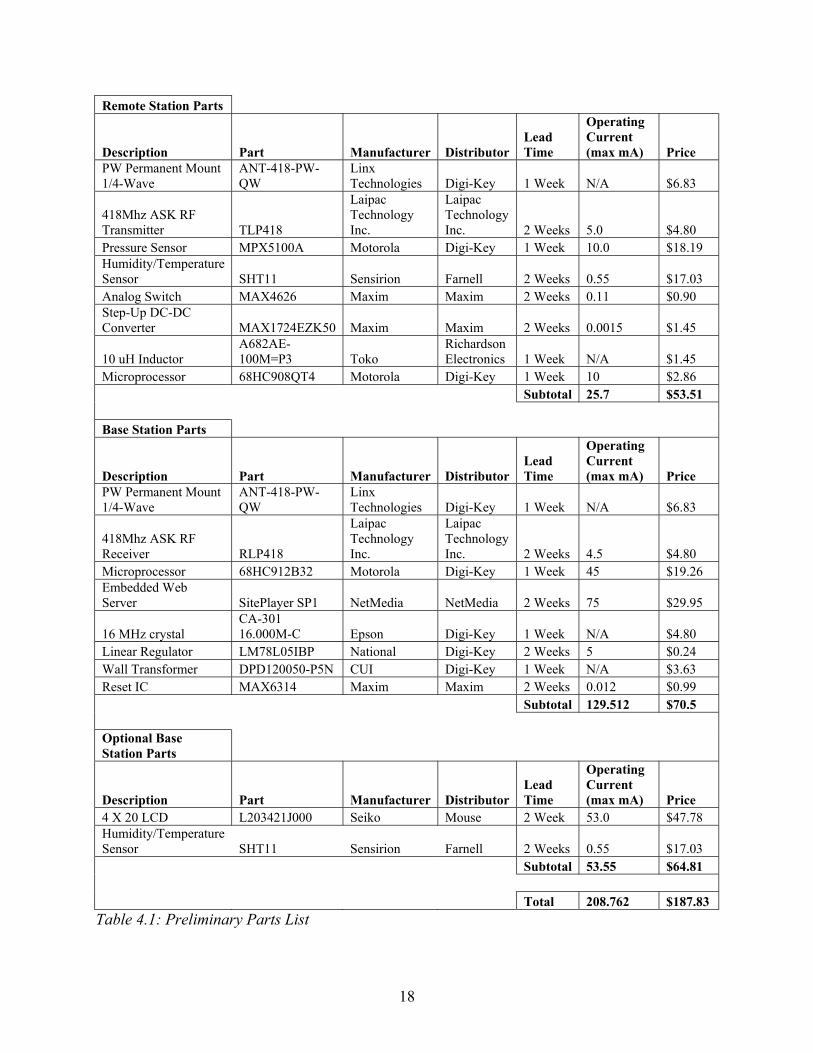
Remote Station Parts
Description Part Manufacturer Distributor Lead Time
Linear Regulator LM78L05IBP National Digi-Key 2 Weeks 5 $0.24 Wall Transformer DPD120050-P5N CUI Digi-Key 1 Week N/A $3.63 Reset IC MAX6314 Maxim Maxim 2 Weeks 0.012 $0.99 Subtotal 129.512 $70.5 Optional Base Station Parts
Description Part Manufacturer Distributor Lead Time