Page 1
Web Appendix A: Proof of Concept Facebook Study
In January 2018, an online petition asking the USDA to allow SNAP funds to be spent on
pet food was signed by over 100,000 people (Morris 2018). Networks who shared this news via
social media received hundreds of comments from consumers who gave their opinions on this
proposed policy. For two such articles shared on social media, we i) coded people’s responses as
either being for or against this policy change and ii) labeled respondents as either having a pet or
not (codings were made independent of each other). We posited that support for this policy
would be predicted by whether or not a commenter showed evidence of having a pet. While a
naturalistic study such as this is less controlled, it does serve to capture a spontaneous, real-world
illustration of our proposed effect which our experimental studies build on further.
Method
We analyzed Facebook users’ comments that were made on two articles posted by news
sources (NBC affiliate in Madison, WI and Fox affiliate in Cleveland, OH).
NBC Madison article. Four hundred and forty-three comments were originally included
in the dataset. Eighteen of these comments were removed from analysis because they lacked any
meaningful content that could be analyzed (e.g., comment only contained the name of a friend
tagged in the post, leaving 425 comments to be analyzed. Comments were coded by MTurk users
as having either a favorable or unfavorable opinion of the proposed policy change on a five-point
scale (1 = strongly against policy, 5 = strongly supports policy). Coders were randomly assigned
to rate 20 of the comments. Each comment received 5 to 10 ratings. The commenters’ Facebook
profiles were then explored for evidence of having a pet in their profile picture(s). A priori,
profiles that had fewer than ten public pictures were considered uninformative (n = 108). Profiles
Page 2
with pictures of pets were considered as evidence of having a pet (n = 145), and profiles with
more than ten pictures and no pictures of pets were considered as not having a pet (n = 172).
Fox Cleveland article. Two hundred and twenty-three comments were originally included
in the dataset. One comment was removed from analysis because they lacked any meaningful
content that could be analyzed, leaving 222 comments to be analyzed. MTurk users were
randomly assigned to rate 20 of the comments as having a favorable or unfavorable attitude
toward the policy (1 = strongly against policy, 2 = somewhat against policy, 3 = mixed opinion
of policy, 4 = somewhat supports policy, 5 = strongly supports policy). Each comment received 7
to 10 ratings. To simplify and more objectively define the coding of having a pet, we simply
coded whether the respondent had a picture of a pet specifically in their profile picture (n = 30),
or did not (n = 192). Our coding choices create a conservative test of our hypotheses, insofar as
one can theoretically have a pet or value pets and not post pictures of them on social media. This
also explains why there are seemingly so few people with pets in this dataset compared to the
NBC Wisconsin dataset.
Results and Discussion
Welfare attitudes are often articulated as principled beliefs and a reflection of ideology.
However, we found that the simple fact of whether or not one has a pet was a strong predictor of
policy attitudes. For the NBC article, an ANOVA showed that those with evidence of having a
pet showed significantly more support for the policy (M = 2.70, SD = 1.36) compared to those
showing no evidence of having a pet (M = 2.03, SD = 1.00) or those for whom having a pet was
inconclusive (M = 2.08, SD = 1.21), F (2, 422) = 14.83, p < .001. Said differently, 25.3% of
those identified as having a pet made comments that were on average “somewhat” or “strongly”
Page 3
supportive of the policy versus only 8.2% of those with no evidence of having a pet (and 10% of
those for who having a pet was inconclusive).
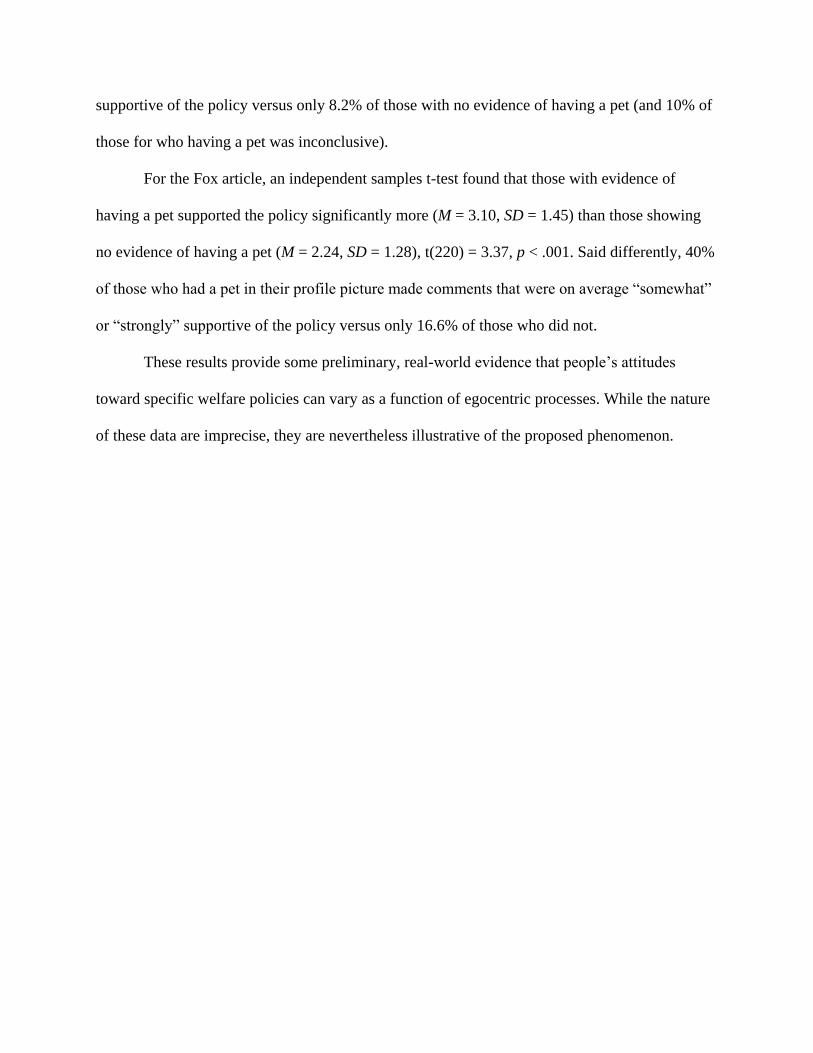
For the Fox article, an independent samples t-test found that those with evidence of
having a pet supported the policy significantly more (M = 3.10, SD = 1.45) than those showing
no evidence of having a pet (M = 2.24, SD = 1.28), t(220) = 3.37, p < .001. Said differently, 40%
of those who had a pet in their profile picture made comments that were on average “somewhat”
or “strongly” supportive of the policy versus only 16.6% of those who did not.
These results provide some preliminary, real-world evidence that people’s attitudes
toward specific welfare policies can vary as a function of egocentric processes. While the nature
of these data are imprecise, they are nevertheless illustrative of the proposed phenomenon.
Page 4
Web Appendix B: Study 1a Experimental Materials, Pre-test, and Supplementary Analyses
Study 1a Materials
Please RANK the following things according to how you would PRIORITIZE them. That is,
with a limited amount of money, what you would keep in your budget and what would you
remove? Things you would keep in your budget go toward the TOP of the list. Things you would
NOT buy in order to buy other things go toward the BOTTOM of the list:
salty snacks (e.g., pretzels, potato chips)
soda
sugary snack (e.g., candy, candy bars)
frozen processed food
dessert foods (e.g., cake, ice cream)
Now, please rate how much you like each of the following things: (same five items as above
were listed, 1 = not at all, 5 = moderately, 9 = very)
How well do the following statements describe your personality? I see myself as someone who...
…is reserved
…is generally trusting
…tends to be crazy
…is relaxed, handles stress well
…has few artistic interests
…is outgoing, sociable
…tends to find fault with others
…does a thorough job
…gets nervous easily
…has an active imagination
You will next read about a person and answer some questions about your impression of them.
Tim Garrett is 32 years old, and lives in Kansas City Missouri. He has a diploma from a community
college. He has a wife and child that he lives with. He is recently unemployed, and is receiving
welfare from the government. He receives a few hundred dollars a month in the form of cash
assistance as well as Supplemental Nutrition Assistance Program funds (SNAP, i.e., "food
stamps").
Target Profile Image from Minear, Meredith and Denise C. Park (2004), “A Lifespan Database
of Adult Facial Stimuli,” Behavior Research Methods, Instruments, and Computers, 36, 630 –
633).
Image file name: TMWmale22neutral.bmp
When Tim goes grocery shopping with his SNAP (food stamp) funds, he will sometimes buy
some ______________ along with his other groceries [food item varied by condition. Was either
participants most or least preferred item from ranking task].
Page 5
Manipulation check: How much value do you think Tim will get from buying salty snacks,
considering other ways that he could spend his SNAP funds?
(1 = very little, 5 = a moderate amount, 9 = a lot)
In your opinion, how likely is it that Tim…
(1 = not at all, 5 = moderately, 9 = extremely).
…is irresponsible with his money
…is impulsive
…is easily tempted
…lacks self-control
…violent
…rude
…vulgar
…mean
What was Tim’s occupation? [attention check]
None, was receiving government assistance
None, disability
Restaurant server
Construction
Consumer service
What is your sex? Male, Female
What is your age?
On the scale below please indicate your household’s approximate yearly income before taxes
(Below $20,000, 20-30k, 30-40k, 40-50k, 50-70k, 70-100k, 100-200k, 200k+)
How would you describe yourself politically? (1 = very liberal, 5 = moderate, 9 = very
conservative)
Have YOU ever been a recipient of government assistance (SNAP/"food stamps", or
SSI/TANF/"welfare") (No, Yes)
What is your overall attitude toward government assistance programs commonly referred to as
"welfare" (e.g., SNAP/"food stamps", SSI and TANF)? (1 = very negative, 5 = neither negative
nor positive, 9 = very positive)
Page 6
Pre-test
To first determine that the stereotype of welfare recipients being irresponsible is indeed a
relevant stereotype that is relatively unique to this group, 75 participants (MTurk) were asked, in
random order, the extent to which they associate the following traits with each of six different
groups: impulsive, easily gives into temptation, can delay gratification, and is bad at money
management (1 = not at all, 9 = very much; coded so that higher scores reflect higher
irresponsibility). The six groups rated were welfare recipients, middle-class people, blue-collar
workers, businesspeople, non-working housewives, and the retired elderly. Thus, target groups
varied in their employment status and income level. We found that welfare recipients were
judged as more irresponsible (M = 5.25, SD = 1.98) compared to all other groups (Ms < 4.64 SDs
= 1.37 – 1.73), ts > 2.19, ps < .03, suggesting that this stereotype is more relevant to people’s
perceptions of welfare recipients than for other groups.
Primary Analyses with Control Variables (Income, Political Orientation, If They Have
Received Welfare Before, General Welfare Attitudes)
Effect of condition on stereotyping: F (2, 180) = 5.02, p = .008
Least preferred vs. most preferred: p = .02
Least preferred vs. baseline: p = .004
Most preferred vs. baseline: p = .75
Effect of condition stereotype-irrelevant traits: F (2, 180) = 6.91, p = .001
Least preferred vs. most preferred: p = .07
Least preferred vs. baseline: p < .001
Most preferred vs. baseline: p = .10
Interaction Between Target Product (Most vs. Least Preferred) and Specific Product
Selected by Participant (e.g., Salty Snacks, Soda, etc.)
Stereotyping: F (1, 182) = 1.18, p = .87
Page 7
Web Appendix C: Study 1b Materials and Supplementary Analyses
Study 1b Materials
Please rank your interest in paying for each of the following things, with your MOST preferred
option at the TOP, and your LEAST preferred option at the bottom of the list.
(the zoo, a play in a theater, an amusement park, a museum, a movie)
[profile of Tim was the same as in Study 1].
Imagine that Tim is walking down the street and finds $50. Unable to find the original owner, he
takes this bit of good luck and decides to take his wife to ________________. [purchase listed
was either participants’ most or least preferred purchase from the ranking task, depending on condition].
You read that Tim spent $50 taking his family to the zoo. To you, how much is this purchase
“worth”? Meaning, what price do you think accurately reflects the value that one would obtain
from making this purchase? You might see it as not worth very much based on what kind of
use/enjoyment/satisfaction/value one gets out of it. You might see it as worth a lot given the
amount of use/enjoyment/satisfaction/value one gets out of it.
[participants indicated a dollar amount from $0-100]
How much value do you think Tim will get from this purchase, considering other ways that one
could spend $50? (1 = very little, 5 = a moderate amount, 9 = a lot)
Tim is responsible with his money (1 = strongly disagree, 5 = neither agree nor disagree, 9 =
strongly agree
Tim is impulsive
Tim lacks self-control
Tim makes poor purchasing decisions
(1 = not at all, 5 = moderately, 9 = very)
[Attention check, demographic, and control items were the same as in Study 1a, except general
welfare attitudes was not measured]
Primary Analyses with Control Variables (Income, Political Orientation, If They Have
Received Welfare Before)
Effect of condition on stereotyping: F (1, 182) = 6.77, p = .01
Interaction Between Target Purchase (Most vs. Least Preferred) and Specific Purchase
Selected (e.g., going to the zoo, amusement park, etc.)
Page 8
Stereotyping: F (1, 177) = 1.89, p = .11
Web Appendix D: Study 1c Materials and Supplementary Analyses
Study 1c Materials
Healthy goal condition:
On the next page, please imagine that you are going grocery shopping with the overall goal of
buying healthy food. This may or may not be what you already do, but imagine that your primary
concern on this trip is making healthy choices.
Imagine that you are going grocery shopping with the overall goal of buying healthy food. This
may or may not be what you already do, but imagine that your primary concern on this trip is
making healthy choices.
Please list 10 items below that you would buy on this trip. As you try to think of things, consider
that you will need food for breakfast, lunch, and dinner, side dishes, snacks, drinks, and so on.
Please take a minute or two and do your best to list 10 healthy items you would buy on this trip.
Baseline goal condition:
On the next page, please imagine that you are going on a typical grocery shopping trip.
Imagine that you are going on a typical grocery shopping trip.
Please list 10 items below that you would buy on this trip. As you try to think of things, consider
that you will need food for breakfast, lunch, and dinner, side dishes, snacks, drinks, and so on.
Please take a minute or two and do your best to list 10 items you would buy on a typical grocery
shopping trip.
Next, you will be asked to rate different purchases made with Supplemental Nutrition Assistance
Program (SNAP) funds, otherwise known as food stamps.
You can see each purchase as a not at all appropriate use of SNAP money, very appropriate, or
something in between.
Please just try to answer as honestly as possible.
(1 = not at all appropriate, 5 = moderately appropriate, 9 = very appropriate
Page 9
Less-healthy items:
Healthy items:
Think back to your grocery shopping trip that you made a minute ago.
Overall, how healthy do you think your purchases were on this trip? (1 = not at all, 5 =
moderately, 9 = very)
To what extent do you think that the grocery purchases that YOU made earlier are similar to
those of the average SNAP ("food stamp") recipient? (1 = not at all, 5 = moderately, 9 = very)
[demographic and control items were the same as in Study 1a]
Primary Analyses with Control Variables (Income, Political Orientation, If They Have
Received Welfare Before, General Welfare Attitudes)
Effect of goal condition on purchase appropriateness ratings:
Less healthy items: F (1, 198) = 21.97, p < .001
Healthy items: F (1, 198) = 1.19, p = .28
Page 10
Web Appendix E: Study 2 Materials and Supplementary Analyses
Study 2 Materials
[The ranking task and subsequent filler task was the same as in Study 1]
Manipulation check: How much value do you think people get from buying ________,
considering other ways that people can spend money? [item was either the participant’s most or
least preferred item, depending on condition]
(1 = very little, 5 = a moderate amount, 9 = a lot)
To what extent do you think that a middle-class American buying…/To what extent do you think
that someone receiving welfare (e.g., SNAP/food stamps) buying __________ reflects…
[target varied by condition, item listed varied by condition]
…being irresponsible with one’s money
…being impulsive
…being easily tempted
…lacking self-control
State legislators in various states are proposing that _________ be prohibited as SNAP (aka:
food stamp) purchases. What do you think of this? [item was either the participant’s most or
least preferred item, depending on condition]
(1 = strongly agree, 5 = neither agree nor disagree, 9 = strongly agree)
These purchases should NOT be covered by welfare programs.
I would support this kind of restriction.
This policy is a good idea.
Making these purchases should disqualify SNAP/food stamp recipients from receiving their
benefits.
If this policy was on a ballot, I would vote for it.
Attention check: What product category did you answer questions about? (salty snacks, soda,
sugary snacks, frozen processed food, dessert foods)
Suspicion probe: In your own words, what do you think this survey was investigating?
[All demographic items and control items were the same as in Study 1]
Page 11
Primary Analyses with Control Variables (Income, Political Orientation, If They Have
Received Welfare Before, General Welfare Attitudes)
Stereotyping:
Purchase (most vs. least preferred) X target (welfare recipient vs. middle class): F (1,
171) = 6.35, p = .01
Effect of purchase with welfare recipient target: F (1, 84) = 18.43, p < .001
Effect of purchase with middle class target: F (1, 83) = .35, p = .56
Policy Attitudes:
Purchase (most vs. least preferred) X target (welfare recipient vs. middle class): F (1,
171) = 1.87, p = .17
Effect of purchase with welfare recipient target: F (1, 84) = 22.35, p < .001
Effect of purchase with middle class target: F (1, 83) = 11.01, p = .001
Moderated Mediation:
LLCI = -2.0284, ULCI = -.5357
Indirect effect when target is welfare recipients: LLCI = .6202, ULCI = 2.0683
Indirect effect when target is middle class: LLCI = -.1145, ULCI = .2910
Interaction Between Target Product (Most vs. Least Preferred), Target Being Judged
(Welfare Recipient vs. Middle Class) and Specific Product Selected (e.g., Salty Snacks,
Soda, etc.)
Stereotyping:
Three-way interaction: F (3, 164) = .79, p = .50
All two-way interactions between conditions and specific product selected:
Fs < .79, ps > .48
Policy Attitudes:
Three-way interaction: F (3, 164) = .29, p = .84
Two-way interaction between target being judged (welfare vs. middle class) and specific
product selected: F (4, 164) = 2.59, p = .04. Two-way interaction between target being
judged (welfare vs. middle class) and target product (most vs. least preferred): F (4, 164)
= .65, p = .63.
Page 12
Factor Loadings for Stereotyping and Policy Attitudes
Principal axis factoring with promax rotation
Item Stereotyping Policy
Attitudes
…being irresponsible with
one’s money
.64 .17
…being impulsive
.92 -.10
…being easily tempted
.91 -.05
…lacking self-control
.81 .11
These purchases should NOT
be covered by welfare
programs.
.01 .89
I would support this kind of
restriction.
-.04 1.00
This policy is a good idea.
-.01 .95
Making these purchases should
disqualify SNAP/food stamp
recipients from receiving their
benefits.
.06 .70
If this policy was on a ballot, I
would vote for it.
.02 .95
Page 13
Mediation Pathways
Model 58 PROCESS macro for SPSS (Hayes 2018). Coefficients are unstandardized. Direct
effect from target product to policy attitudes is with stereotyping, judgment target, and
stereotyping X judgment target in the model. Effect of stereotyping on policy attitudes is with
target product, judgment target, and stereotyping X judgement target in the model. *p <.05, **p
< .01.
Page 14
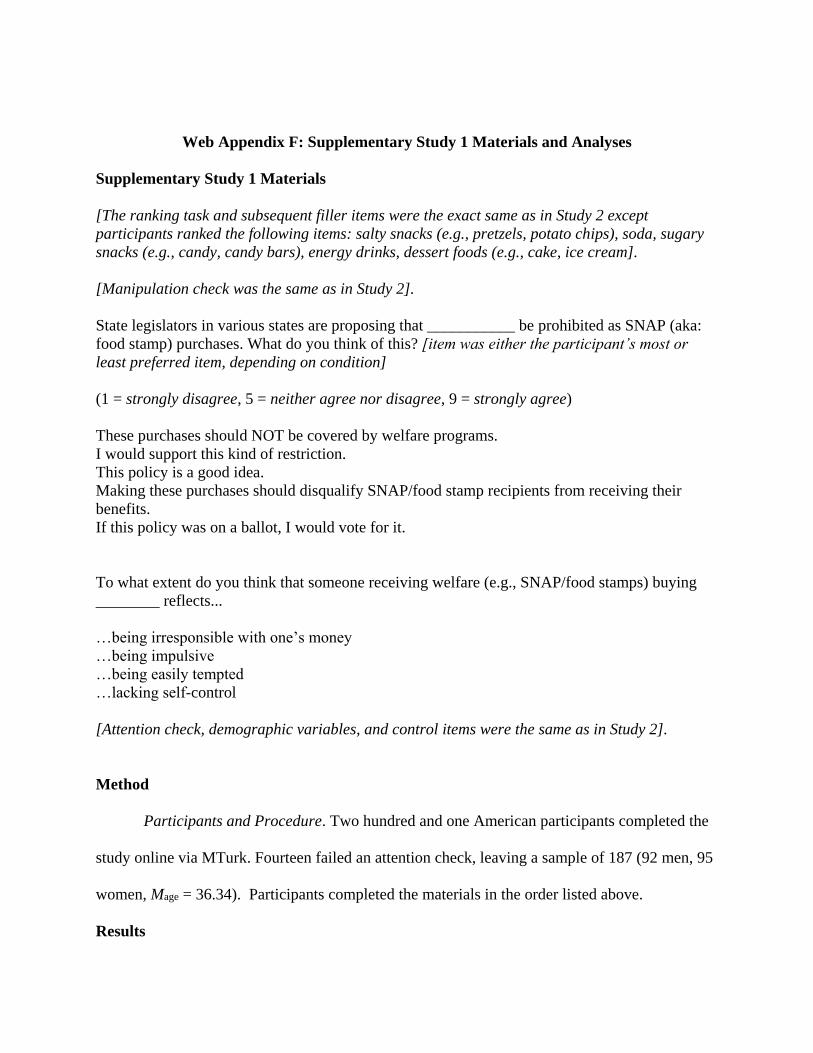
Web Appendix F: Supplementary Study 1 Materials and Analyses
Supplementary Study 1 Materials
[The ranking task and subsequent filler items were the exact same as in Study 2 except
participants ranked the following items: salty snacks (e.g., pretzels, potato chips), soda, sugary
snacks (e.g., candy, candy bars), energy drinks, dessert foods (e.g., cake, ice cream].
[Manipulation check was the same as in Study 2].
State legislators in various states are proposing that ___________ be prohibited as SNAP (aka:
food stamp) purchases. What do you think of this? [item was either the participant’s most or
least preferred item, depending on condition]
(1 = strongly disagree, 5 = neither agree nor disagree, 9 = strongly agree)
These purchases should NOT be covered by welfare programs.
I would support this kind of restriction.
This policy is a good idea.
Making these purchases should disqualify SNAP/food stamp recipients from receiving their
benefits.
If this policy was on a ballot, I would vote for it.
To what extent do you think that someone receiving welfare (e.g., SNAP/food stamps) buying
________ reflects...
…being irresponsible with one’s money
…being impulsive
…being easily tempted
…lacking self-control
[Attention check, demographic variables, and control items were the same as in Study 2].
Method
Participants and Procedure. Two hundred and one American participants completed the
study online via MTurk. Fourteen failed an attention check, leaving a sample of 187 (92 men, 95
women, Mage = 36.34). Participants completed the materials in the order listed above.
Results
Page 15
Participants saw less value in the welfare recipient’s purchase when it was the
participants’ least preferred item (M = 3.15, SD = 1.92) compared to their most preferred item (M
= 4.23, SD = 2.07), t(185) = 3.66, p < .001. Participants also stereotyped the welfare recipient
target more when buying one’s least preferred item (M = 5.83, SD = 2.35) compared to their
most preferred item (M = 4.60, SD = 2.31), t(185) = 3.58, p < .001. Finally, participants showed
more support for restrictive policy when considering their least preferred item (M = 5.95, SD =
2.46) compared to their most preferred item (M = 4.76, SD = 2.52), t(185) = 3.25, p < .001. A
simple mediation analysis was conducted to test H2b (5000 bootstrap resamples; PROCESS
Model 4, Hayes 2018). The path from target product (most preferred = -1, least preferred = 1) to
stereotyping was significant (B = .62, SE = .17, t = 3.58, p < .001), as was the path from
mediator to dependent variable (B = .78, SE = .05, t = 14.66, p < .001) and the direct path from
target product to policy attitudes (B = .60, SE = .18, t = 3.25, p = .001). Supporting H2b,
bootstrap analysis of the causal chain yielded a confidence interval that did not contain zero
(indirect effect = .48, SE = .13, 95% CI = .22 to .75).
Primary Analyses with Control Variables (Income, Political Orientation, If They Have
Received Welfare Before, General Welfare Attitudes)
Effect of condition on stereotyping: F (1, 175) = 12.66, p < .001
Effect of condition on policy attitudes: F (1, 175) = 11.09, p = .001
Indirect effect: LLCI = .33, ULCI = 1.29
Interaction Between Target Product (Most vs. Least Preferred) and Specific Product
Selected (e.g., Salty Snacks, Soda, etc.)
Stereotyping: F (1, 177) = 1.26, p = .29
Policy attitudes: F (1, 177) = .64, p = .64
Page 16
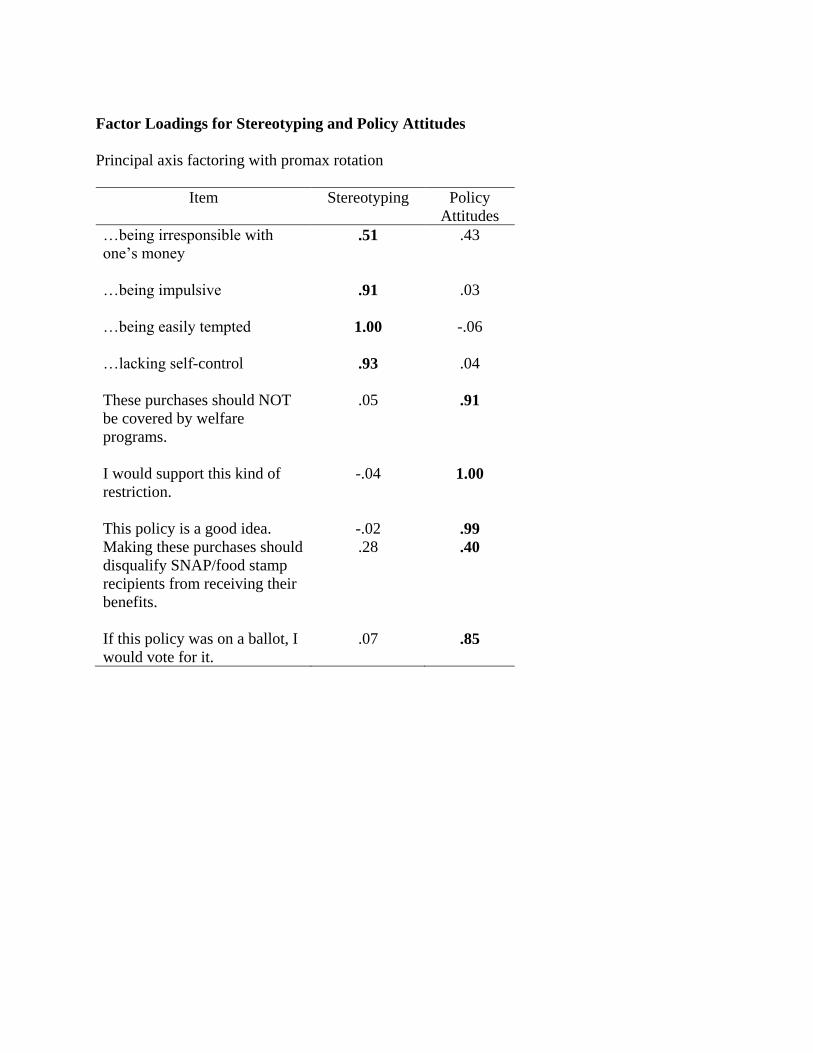
Factor Loadings for Stereotyping and Policy Attitudes
Principal axis factoring with promax rotation
Item Stereotyping Policy
Attitudes
…being irresponsible with
one’s money
.51 .43
…being impulsive
.91 .03
…being easily tempted
1.00 -.06
…lacking self-control
.93 .04
These purchases should NOT
be covered by welfare
programs.
.05 .91
I would support this kind of
restriction.
-.04 1.00
This policy is a good idea. -.02 .99
Making these purchases should
disqualify SNAP/food stamp
recipients from receiving their
benefits.
.28 .40
If this policy was on a ballot, I
would vote for it.
.07 .85
Page 17
Mediation Pathways
Model 4 PROCESS macro for SPSS (Hayes 2018). Coefficients are unstandardized (direct effect
from target product to policy attitudes with stereotyping in the model indicated in parentheses).
*p <.05, **p < .01.
Page 18
Web Appendix G: Study 3 Experimental Materials and Supplementary Analyses
Study 3 Materials
[Ranking task instructions and filler task were the exact same as in Studies 1a and 2. In the
necessities condition, the four items were: shampoo, dish soap, laundry detergent, and
deodorant. In the non-necessities condition, the four items were: take-out pizza, fast food, take-
out coffee/tea, take-out deli sandwiches].
[Manipulation check and stereotyping measure was the same as in Study 2].
Currently, _________ is prohibited as a SNAP (aka: food stamp) purchase. What do you think of
this? [item was either the participant’s most or least preferred item, and either a necessity or
non-necessity, depending on condition]
(1 = strongly agree, 5 = neither agree nor disagree, 9 = strongly agree)
This restriction is wrong; it should be covered by SNAP.
I support the current policy; this purchase should be prohibited with SNAP funds.
If it was on a ballot, I would vote for allowing this purchase to be made with SNAP funds.
[Attention check, suspicion probe, demographic variables, and control items were the same as in
Study 2].
Primary Analyses with Control Variables (Income, Political Orientation, If They Have
Received Welfare Before, General Welfare Attitudes)
Stereotyping:
Purchase (most vs. least preferred) X product type (non-necessity vs. necessity): F (1,
274) = 3.12, p = .08
Non-necessities, effect of purchase: F (1, 133) = 9.98, p = .02
Necessities, effect of purchase: F (1, 137) = 1.45, p = .23
Policy Attitudes:
Purchase (most vs. least preferred) X product type (non-necessity vs. necessity): F (1,
274) = 3.12, p = .08
Non-necessities, effect of purchase: F (1, 133) = 3.81, p = .05
Necessities, effect of purchase: F (1, 137) = .18, p = .67
Moderated Mediation:
LLCI = -.8210, ULCI = .0433
Moderated mediation with all covariates excluding political orientation:
LLCI = -.8458, ULCI = -.0054
Indirect effect when target purchases are non-necessities: LLCI = .1690, ULCI = .9081
Indirect effect when target purchases are non-necessities: LLCI = -.1140, ULCI = .3495
Page 19
Interaction Between Target Product (Most vs. Least Preferred), Necessity (vs. Not), and
Specific Product Selected (e.g., Take-out Pizza, Fast Food, etc.)
Stereotyping:
Three-way interaction: F (3, 272) = .1.13, p = .54
All two-way interactions between conditions and specific product selected:
Fs < 2.10, ps > .10
Policy Attitudes:
Three-way interaction: F (3, 272) = .91, p = .43
Two-way interaction between necessity (vs. not) and specific product selected: F (3, 272)
= 4.13, p = .007. Note however that this interaction is not particularly meaningful, as it is
essentially indicates that the gap in policy attitudes for take-out pizza vs. shampoo, fast food vs.
dish soap, and take-out coffee/tea vs. laundry detergent, is larger than for take-out sandwiches vs.
deodorant. Had these items been arbitrarily coded with different numerical values, this pattern of
effects would vary. The two-way interaction between target being judged (welfare vs. middle
class) and target product (most vs. least preferred): F (4, 164) = .65, p = .63.
Factor Loadings for Stereotyping and Policy Attitudes
Principal axis factoring with promax rotation
Item Stereotyping Policy Attitudes
…being irresponsible with
one’s money
.74 .06
…being impulsive
.95 -.03
…being easily tempted
.93 .02
…lacking self-control
.97 .00
This restriction is wrong; it
should be covered by SNAP
-.01 -.74
I support the current policy;
this purchase should be
prohibited with SNAP funds.
.05 .88
If it was on a ballot, I would
vote for allowing this purchase
to be made with SNAP funds
.03 -.91
Page 20
Mediation Pathways
Model 8 PROCESS macro for SPSS (Hayes 2018). Coefficients are unstandardized. Direct effect
from target product to policy attitudes is with stereotyping, product type, and target product X
product type in the model. Effect of target product X product type on policy attitudes is with
stereotyping in the model. *p <.05, **p < .01.
Page 21
Web Appendix H: Supplementary Study 2 Experimental Materials and Analyses
Supplementary Study 2 Materials
[Ranking task instructions and filler task were the same as Studies, 1a and 2. Rankings were
made for four items: salty snacks (e.g., pretzels, potato chips), soda, sugary snack (e.g., candy,
candy bars), dessert foods (e.g., cake, ice cream)
Perspective-taking: reasons not to buy item:
Do you think that each of the following could be a reason that someone would NOT buy
__________ and instead buy other things?
They don’t like the taste.
They prefer other flavors over this one (e.g., sweet over salty, or salty over sweet).
They have a daily routine that involves some other kind of food.
They have allergies to this food so they buy other food.
The ingredients in this food cause stomach or health issues, so they buy other food.
They just prefer other kinds of foods over this kind of food.
They didn’t grow up with it.
They have negative memories or associations with the food.
Perspective-taking: reasons to buy item:
Do you think that each of the following could be a reason that someone would buy ___________
as opposed to other things?
They like the taste.
They prefer this flavor over others (e.g., sweet over salty, or salty over sweet).
They have a daily routine that involves this food.
They have allergies to other foods, so their options are limited.
The ingredients in other foods cause stomach or health issues, so their options are limited.
They just prefer this kind of food over other kinds of food.
They grew up with it.
They have positive memories or associations with this food.
[Manipulation check, stereotyping items, and policy attitude items, were the same as in Study 2].
[Attention check, demographic variables, and control items were the same as in Study 2 and 4].
Page 22
Method
Participants. Four hundred American participants completed the study via MTurk.
Twenty-one failed an attention check asking what product they answered questions about in the
study, leaving a sample of 379 American participants (178 men, 201 women; Mage= 37.21).
Procedure. Participants completed the product ranking task followed by the same filler
items as in earlier studies. Participants were then presented either with reasons why someone
would buy the target item, or would not buy it. On average, participants agreed with 6.78 of the
items out of eight, suggesting that disagreeing with these reasons to buy/not buy a product is not
a likely explanation for this perspective-taking task failing to reduce egocentrism. They then
completed the same manipulation check as Studies 2 and 3, and the same stereotyping items (α =
.95), policy items (α = .93), demographic, and control items as in Study 2.
Results and Discussion
Manipulation check. The manipulation check addresses the important question of
whether or not the perspective-taking task reduces egocentric judgments of value. The two-way
interaction between target product (participant’s most vs. least preferred) and perspective-taking
task (reasons to buy item vs. reasons not to buy item) was not significant, F (1, 375) = .18, p =
.68. Instead, there was a main effect of target product (most preferred: M = 4.73, SD = 1.96;
least preferred: M = 3.63, SD = 1.97, F (375) = 28.85, p < .001). Therefore, when considering an
item that one does not value, even salient and sensible reasons why others still buy it did nothing
to reduce egocentrism compared to when reasons not to buy it were salient.
Stereotyping. Given the results of the manipulation check, our theory predicts only a
main effect of target product on stereotyping. In line with this reasoning, the two-way interaction
between target product and perspective-taking on stereotyping was not significant, F (1, 375) =
Page 23
.43, p = .51 and only a main effect of target product emerged. Supporting H1, participants saw
welfare recipients as more irresponsible for buying one’s least preferred (M = 5.67, SD = 2.53)
as opposed to most preferred item (M = 4.78, SD = 2.31), F (1, 375) = 12.44, p < .001.
Policy attitudes. The same two-way interaction on policy attitudes was not significant, F
(1, 375) = .16, p = .69, and only a main effect of target product emerged; participants showed
increased support for policy that would ban their least (M = 5.46, SD = 2.77) as opposed to their
most preferred item (M = 4.68, SD = 2.71), F (1, 375) = 7.53, p < .01. These results support H2a.
Mediation. Collapsing across perspective-taking conditions, a simple mediation analysis
was conducted to test H2b (5000 bootstrap resamples; PROCESS Model 4, Hayes 2018). The
path from target purchase (most preferred = -1, least preferred = 1) to stereotyping was
significant (B = .44, SE = .12, t = 3.55, p < .001), as was the path from mediator to dependent
variable (B = .77, SE = .04, t = 17.93, p < .001) and the direct path from target purchase to policy
attitudes (B = .39, SE = .14, t = 2.74, p = .01). Supporting H2b, bootstrap analysis of the causal
chain yielded a confidence interval that did not contain zero (indirect effect = .34, SE = .10, 95%
CI = .15 to .54).
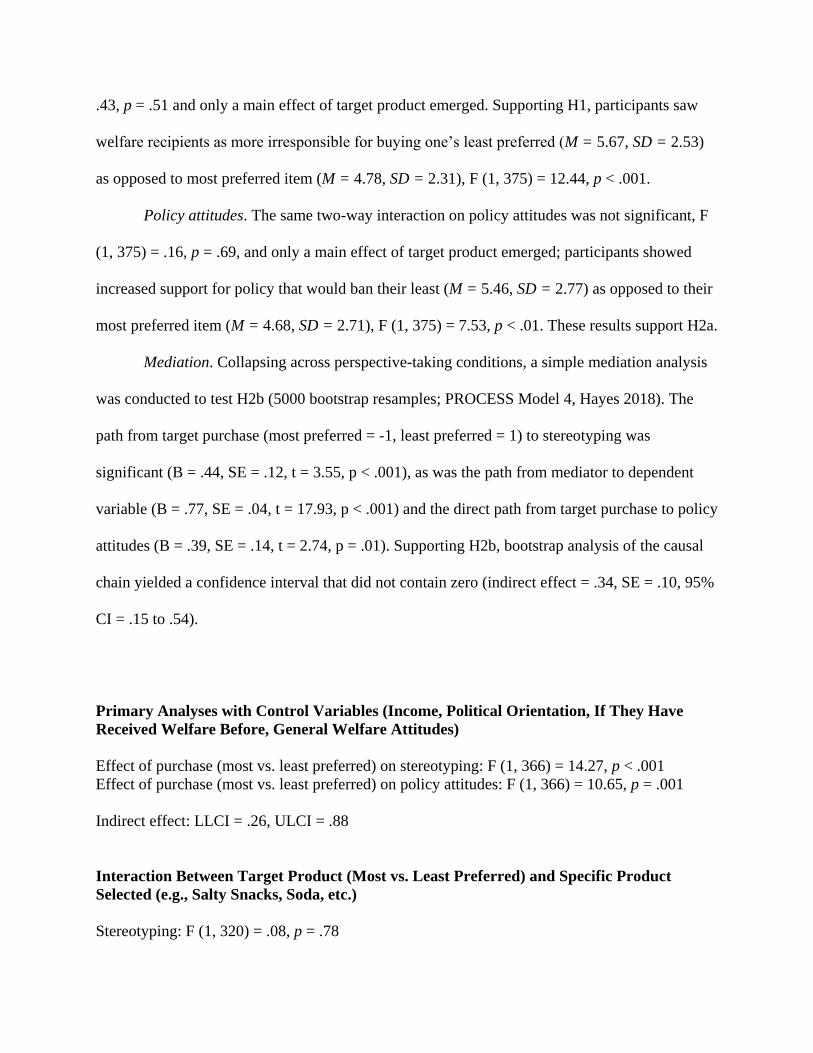
Primary Analyses with Control Variables (Income, Political Orientation, If They Have
Received Welfare Before, General Welfare Attitudes)
Effect of purchase (most vs. least preferred) on stereotyping: F (1, 366) = 14.27, p < .001
Effect of purchase (most vs. least preferred) on policy attitudes: F (1, 366) = 10.65, p = .001
Indirect effect: LLCI = .26, ULCI = .88
Interaction Between Target Product (Most vs. Least Preferred) and Specific Product
Selected (e.g., Salty Snacks, Soda, etc.)
Stereotyping: F (1, 320) = .08, p = .78
Page 24
Policy attitudes: F (1, 320) = .25, p = .62
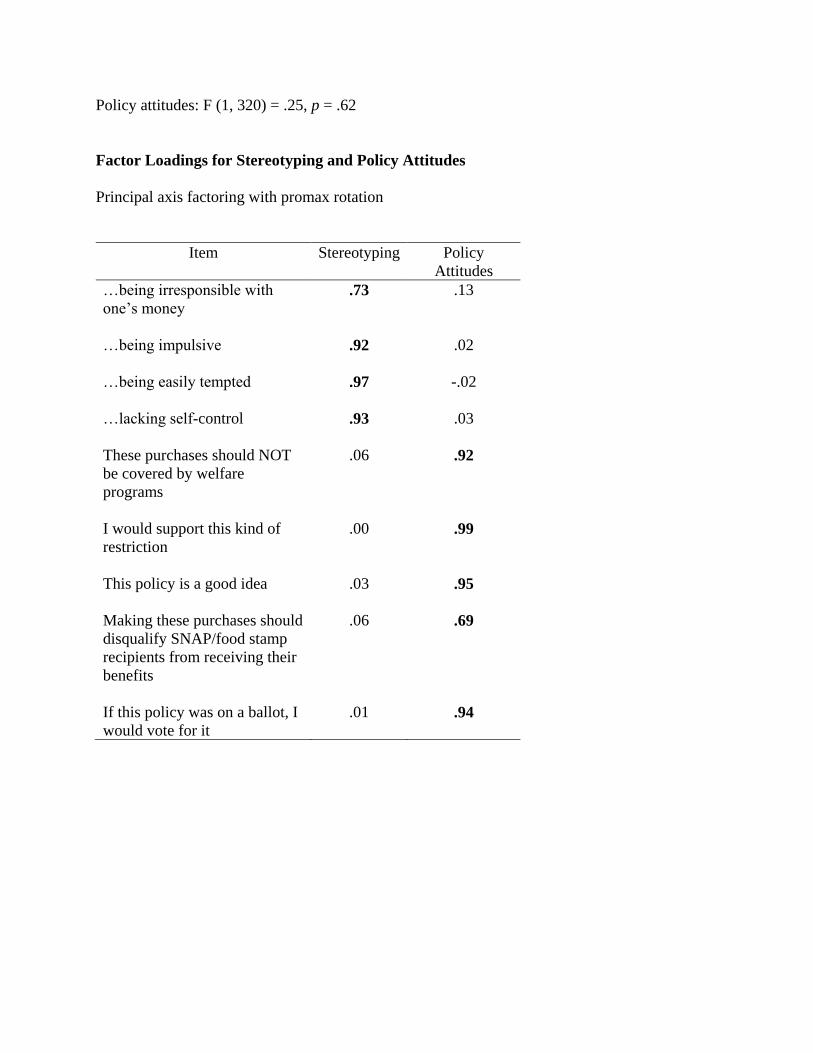
Factor Loadings for Stereotyping and Policy Attitudes
Principal axis factoring with promax rotation
Item Stereotyping Policy
Attitudes
…being irresponsible with
one’s money
.73 .13
…being impulsive
.92 .02
…being easily tempted
.97 -.02
…lacking self-control
.93 .03
These purchases should NOT
be covered by welfare
programs
.06 .92
I would support this kind of
restriction
.00 .99
This policy is a good idea
.03 .95
Making these purchases should
disqualify SNAP/food stamp
recipients from receiving their
benefits
.06 .69
If this policy was on a ballot, I
would vote for it
.01 .94
Page 25
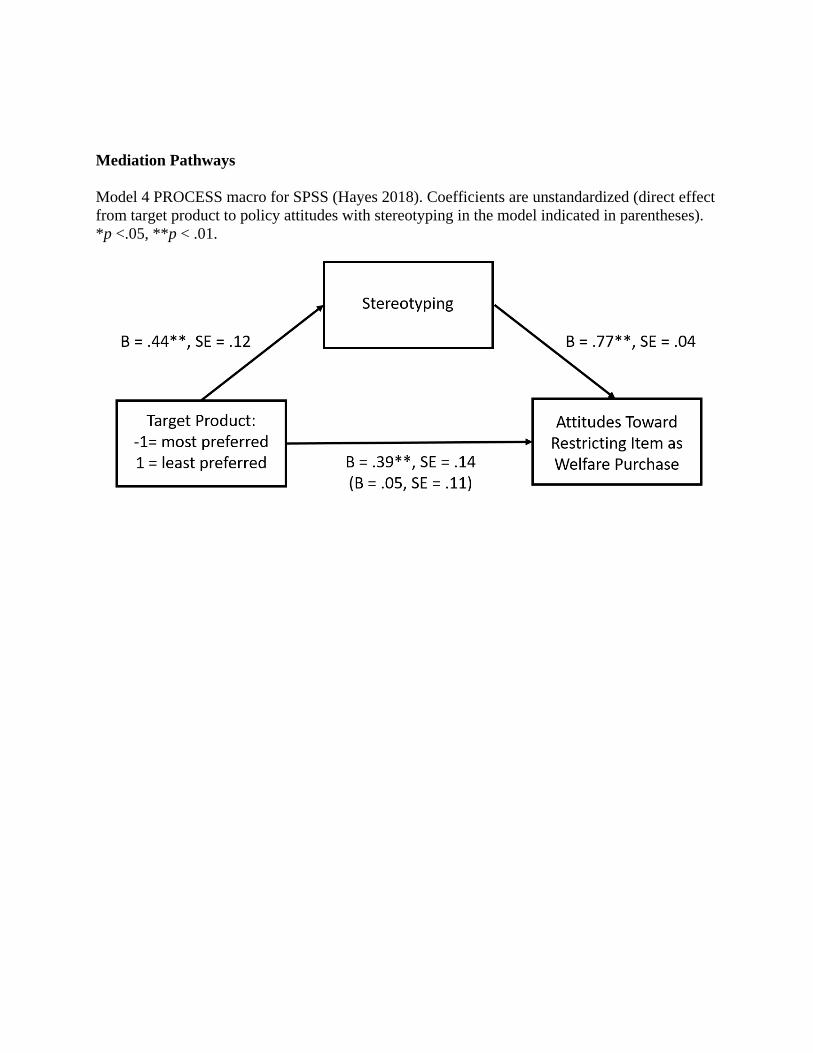
Mediation Pathways
Model 4 PROCESS macro for SPSS (Hayes 2018). Coefficients are unstandardized (direct effect
from target product to policy attitudes with stereotyping in the model indicated in parentheses).
*p <.05, **p < .01.
Page 26
Web Appendix I: Study 4 Experimental Materials and Supplementary Analyses
Study 4 Materials
[Ranking task was the exact same as in Supplementary Study 2].
Baseline condition:
Tim Garrett is 32 years old, and lives in Kansas City Missouri. He has a diploma from a
community college. Tim is unemployed and is receiving assistant (i.e., welfare) from the
government. He receives Supplemental Nutrition Assistance Program funds (SNAP, i.e., "food
stamps").
Responsible condition:
Tim Garrett is 32 years old, and lives in Kansas City Missouri. He has a diploma from a
community college. Tim is unemployed and is receiving assistant (i.e., welfare) from the
government. He receives Supplemental Nutrition Assistance Program funds (SNAP, i.e., "food
stamps"). Tim spends a lot of time budgeting the funds that he receives. He divides his funds so
that he knows how much he has to spend each week on food and whether or not he is on track to
finish the month with enough groceries to get by. He also clips coupons from flyers and pays
attention to sales. He prioritizes his purchases accordingly, avoiding less necessary purchases
until he knows he has enough money for them.
[The same image of Tim from Studies 1a, 1b and 4 was also included].
In your opinion, how likely is it that Tim…
(1 = not at all, 5 = moderately, 9 = extremely).
…is irresponsible with his money
…is impulsive
…is easily tempted
…lacks self-control
How likely do you think it is that Tim is also buying?
(1 = not at all likely, 5 = moderately likely, 9 = very likely).
Fast food
Lottery tickets
Casino gambling
Page 27
Beer
Cigarettes
[Egocentrism manipulation check, and policy attitude items were the exact same as in Studies 1a
and 2]:
[Attention check was the same as Study 1a, demographic variables, and control items were the
same as in Studies 2, 3, and 4].
Primary Analyses with Control Variables (Income, Political Orientation, If They Have
Received Welfare Before, General Welfare Attitudes)
Stereotyping:
Purchase (most vs. least preferred) X target info (baseline vs. responsible): F (1, 590) =
3.12, p = .08
Baseline, effect of purchase: F (1, 300) = 7.17, p = .008
Responsible, effect of purchase: F (1, 286) = .09, p = .76
Policy Attitudes:
Purchase (most vs. least preferred) X target info (baseline vs. responsible): F (1, 590) =
1.38, p = .24
Baseline, effect of purchase: F (1, 300) = 24.93, p < .001
Responsible, effect of purchase: F (1, 286) = 9.05, p = .003
Mediation with baseline information about target: LLCI = .08, ULCI = .67
Mediation with responsible information about target: LLCI = -.13, ULCI = .18
Interaction Between Target Product (Most vs. Least Preferred), Target Info (Baseline vs.
Responsible) and Specific Product Selected (e.g., Salty Snacks, Soda, etc.)
Stereotyping:
Three-way interaction: F (3, 593) = 1.07, p = .36
All two-way interactions between conditions and specific product selected:
Fs < .81, ps > .32.
Policy Attitudes:
Three-way interaction: F (3, 593) = 1.16, p = .82
All two-way interactions between conditions and specific product selected:
Fs < 1.64, ps > .18.
Page 28
Factor Loadings for Stereotyping and Policy Attitudes
Principal axis factoring with promax rotation
Item Stereotyping Policy
Attitudes
…is irresponsible with one’s
money
.74 .14
…is impulsive
.85 -.00
…is easily tempted
.87 .00
…lacks self-control
.88 .01
Fast food
.79 -.02
Lottery tickets
.84 .00
Casino gambling
.82 .00
Beer
.85 -.02
Cigarettes
.84 -.01
These purchases should NOT
be covered by welfare
programs
-.04 .97
I would support this kind of
restriction
-.03 .96
This policy is a good idea
-.01 .97
Making these purchases should
disqualify SNAP/food stamp
recipients from receiving their
benefits
.17 .65
If this policy was on a ballot, I
would vote for it
.00 .93
Page 29
Mediation Pathways
Model 8 PROCESS macro for SPSS (Hayes 2018). Coefficients are unstandardized. Direct effect
from target product to policy attitudes is with stereotyping, target person info, and target product
X target person info in the model. Effect of target product X target person info on policy
attitudes is with stereotyping in the model. *p <.05, **p < .01


![November 24, 2020 arXiv:2011.10908v1 [quant-ph] 22 Nov 2020using just n = O(log(m)log(1/δ)/ǫ2) copies [Aar20]. We review the proof in Appendix A, We review the proof in Appendix](https://static.documents.pub/doc/80x56/60a074eaa9719b36bc29954b/november-24-2020-arxiv201110908v1-quant-ph-22-nov-2020-using-just-n-ologmlog12.jpg)


