57
Web Intelligence Rich Client User Guide

Web Intelligence Rich Client User Guide

Web Intelligence User Guide
2 | P a g e
Web Intelligence User Guide Contents
Selecting the version of Web Intelligence .................................................................................................... 4 Log into EDDIE ........................................................................................................................................... 4 Setting your Web Intelligence Preferences .............................................................................................. 5
Close Web Intelligence.................................................................................................................................. 8 Opening Web Intelligence Rich Client from your Desktop ........................................................................... 9 Login to Web Intelligence (Connecting to the Server) ................................................................................ 10 Creating a New Document .......................................................................................................................... 12 Query Panel Overview ................................................................................................................................ 13
Query Panel Toolbar: .............................................................................................................................. 13 Universe Outline: .................................................................................................................................... 13 Result Object Panel ................................................................................................................................. 14 Removing Objects from Result Objects .................................................................................................. 14 Query Filter Panel ................................................................................................................................... 14 Data Preview ........................................................................................................................................... 18 Answering Prompts ................................................................................................................................. 18
Report Manager Window ........................................................................................................................... 19 File Tab .................................................................................................................................................... 19 Properties Tab ......................................................................................................................................... 19 Document Toolbar .................................................................................................................................. 20 Left Sidebar Panel ................................................................................................................................... 20 Status Bar ................................................................................................................................................ 21
Saving a Document as Web Intelligence ..................................................................................................... 21 Saving to Other File Formats (Excel, PDF, CSV, and Text) ........................................................................... 22 Saving Documents to EDDIE ........................................................................................................................ 22 Refreshing a Document............................................................................................................................... 23 Editing a Query ............................................................................................................................................ 24 Adding Objects to an Existing Query........................................................................................................... 24
Adding objects to a Table ........................................................................................................................ 25 Sorting ......................................................................................................................................................... 25 Sections ....................................................................................................................................................... 27 Breaks .......................................................................................................................................................... 28 Inserting Calculations .................................................................................................................................. 30 Inserting Predefined Cells into Report ........................................................................................................ 31
Available Predefined Cells ....................................................................................................................... 31 Adding a Prompt Summary ..................................................................................................................... 32
Creating Additional Report Tabs ................................................................................................................. 33 Duplicating a Report ............................................................................................................................... 33 Rename a Report .................................................................................................................................... 33
Filtering a Report ........................................................................................................................................ 34 Using Report Filters ................................................................................................................................. 34 Using Simple Filters on the Filter Bar ...................................................................................................... 35 Input Controls ......................................................................................................................................... 37
Creating Variables ....................................................................................................................................... 40 Displaying a List of Values in the Variable Editor .................................................................................... 42
Grouping ..................................................................................................................................................... 42

Web Intelligence User Guide
3 | P a g e
Merge Dimension ........................................................................................................................................ 45 Step 1: Sort Available Objects by Query ................................................................................................. 45 Step 2: Merge Dimension Objects .......................................................................................................... 46 Step 3: Create Variables for Objects to be Displayed with Other Data Source ...................................... 48
Report Formatting ...................................................................................................................................... 50 Viewing the Print Preview (Page View) ................................................................................................... 50 Scaling (Fit to Page) ................................................................................................................................. 50 Changing Page Margins ........................................................................................................................... 50 Wrapping Text ......................................................................................................................................... 51 Changing Row Height and Column Width ............................................................................................... 51 Rearranging Columns .............................................................................................................................. 52 Deleting a Column ................................................................................................................................... 52 Format Numbers ..................................................................................................................................... 52 Editing the Report Title ........................................................................................................................... 53
Conditional Formatting ............................................................................................................................... 54

Web Intelligence User Guide
4 | P a g e
Selecting the version of Web Intelligence There are two versions Web Intelligence that you can use to created and edit reports. One is the HTML version and the other is the Desktop or Rich Client version. The major difference between the versions is that the HTML version only allows you to save to your folders in the Business Objects (EDDIE) repository. The Rich Client version allows you to save to the repository or to your hard-drive or network drives. Also, the Rich Client has to be installed. There are other small differences, but the HTML version does almost everything the Rich Client does.
You can select which version to use when viewing reports in EDDIE and when modifying reports. By default the HTML version will be used for both viewing and modifying reports. The following steps show how to select the Desktop or Rich Client version to modify reports.
Log into EDDIE 1. Open the EDDIE login page: https://eddie.ds.uillinois.edu/
2. Click the Log In to EDDIE button.

Web Intelligence User Guide
5 | P a g e
3. Enter your University NetID and Password.
4. Click LOG IN.
Setting your Web Intelligence Preferences 1. Select Preferences (upper right corner)
Web Intelligence User Guide
6 | P a g e
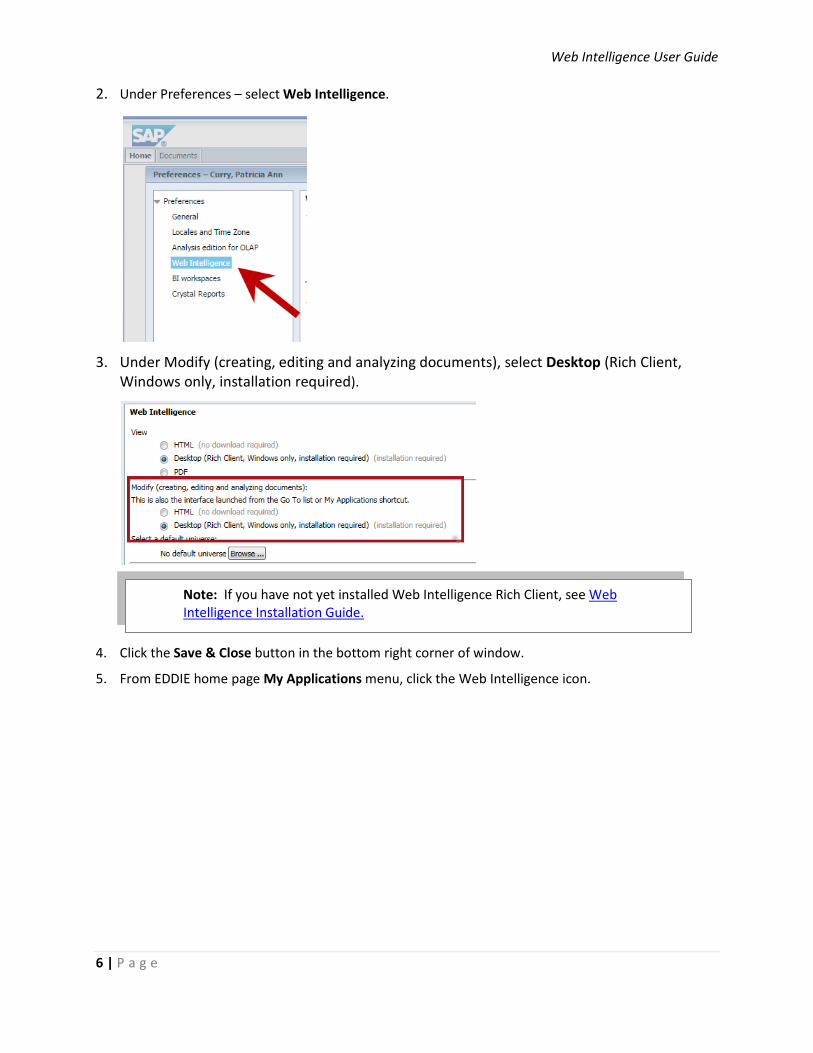
2. Under Preferences – select Web Intelligence.
3. Under Modify (creating, editing and analyzing documents), select Desktop (Rich Client, Windows only, installation required).
4. Click the Save & Close button in the bottom right corner of window.
5. From EDDIE home page My Applications menu, click the Web Intelligence icon.
Note: If you have not yet installed Web Intelligence Rich Client, see Web Intelligence Installation Guide.

Web Intelligence User Guide
7 | P a g e
6. When prompted to Open or Save the file, Click Open
7. Web Intelligence Rich Client opens and the home page is displayed:

Web Intelligence User Guide
8 | P a g e
Close Web Intelligence Web Intelligence Rich Client will stay running even after you close it. You have the option to have Web Intelligence completely close rather than stay running in the background. To have Web Intelligence completely close:
1. Click the Tools icon in the upper-right corner.
2. Select Options from the pop-up menu.
Web Intelligence User Guide
9 | P a g e
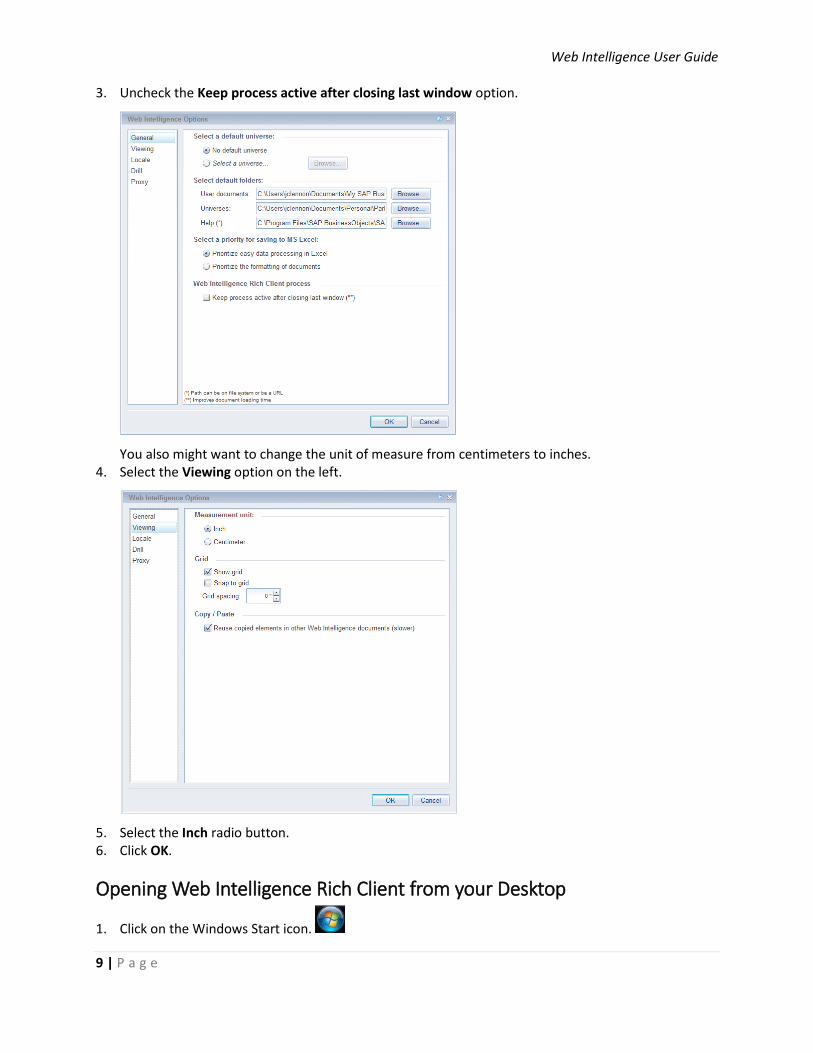
3. Uncheck the Keep process active after closing last window option.
You also might want to change the unit of measure from centimeters to inches. 4. Select the Viewing option on the left.
5. Select the Inch radio button. 6. Click OK.
Opening Web Intelligence Rich Client from your Desktop
1. Click on the Windows Start icon.
Web Intelligence User Guide
10 | P a g e
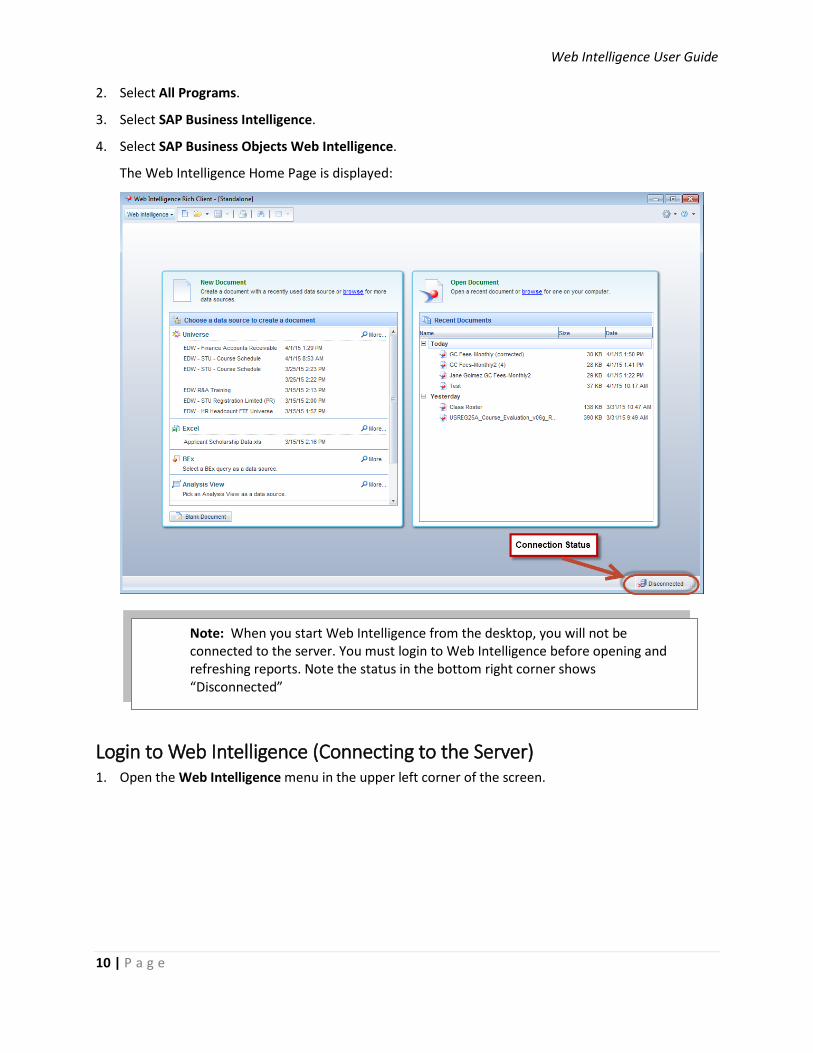
2. Select All Programs.
3. Select SAP Business Intelligence.
4. Select SAP Business Objects Web Intelligence.
The Web Intelligence Home Page is displayed:
Login to Web Intelligence (Connecting to the Server) 1. Open the Web Intelligence menu in the upper left corner of the screen.
Note: When you start Web Intelligence from the desktop, you will not be connected to the server. You must login to Web Intelligence before opening and refreshing reports. Note the status in the bottom right corner shows “Disconnected”
Web Intelligence User Guide
11 | P a g e
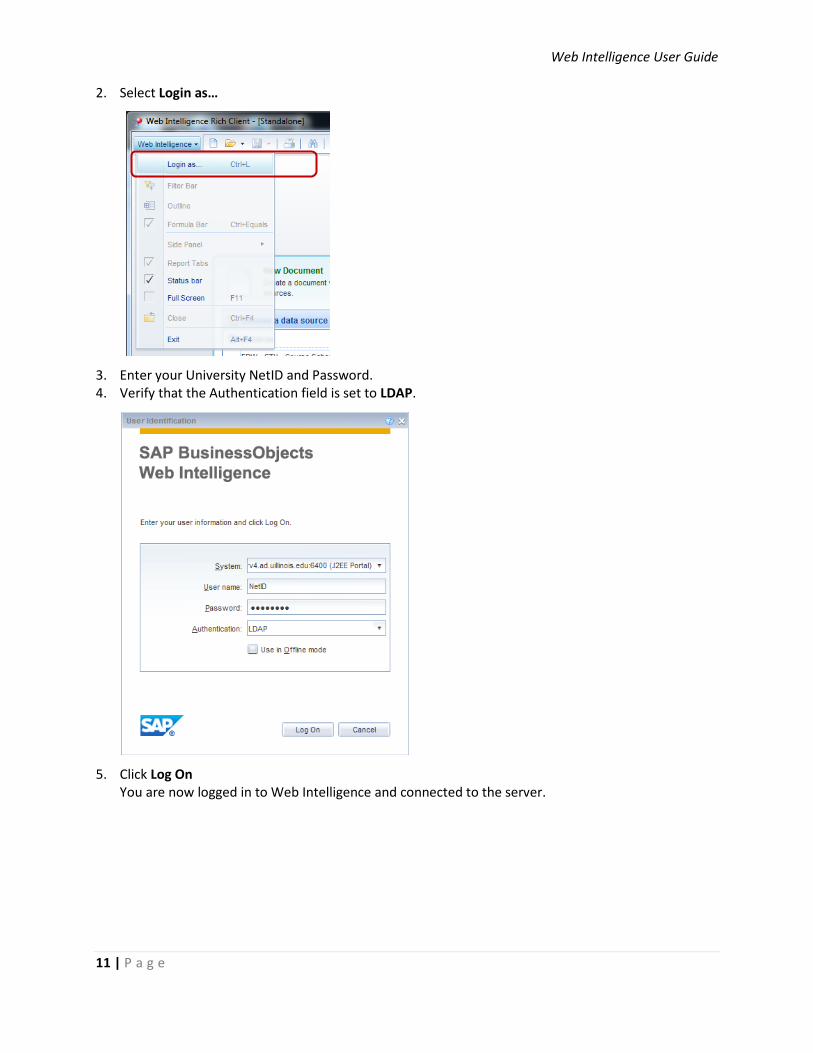
2. Select Login as…
3. Enter your University NetID and Password. 4. Verify that the Authentication field is set to LDAP.
5. Click Log On You are now logged in to Web Intelligence and connected to the server.

Web Intelligence User Guide
12 | P a g e
Creating a New Document Most reports will be created using a universe. A universe is an interface to the database that contains objects, which are tied to columns in database tables. Related objects are organized into folders that are called classes. A universe also can contain predefined query filters.
1. Choose a data source by selecting the Universe link or select the universe from your recently used universes in the list.
2. Select the desired Universe from the list and click Select.
The Query Panel is displayed:
Note: You can use the filter box to search for a particular universe.

Web Intelligence User Guide
13 | P a g e
Query Panel Overview
Query Panel Toolbar:
1. Add Query – Use drop-down menu to select data source for additional queries.
2. Hide / Show Data Preview Panel
3. Combine Query – Select from Union, Intersection, or Minus
4. Query Properties – Name query, set limits, change prompt order, turn off retrieve duplicate rows.
5. View Script – View the SQL script for query
6. Run Query
Universe Outline: The Universe Outline displays all of the classes and objects in the universe.

Web Intelligence User Guide
14 | P a g e
Searching for Objects and Filters 1. Enter and word(s) that are contained in the name of the object you are looking for.
2. The Universe Outline will be filtered to only show classes, objects, and predefined filters that contain that text.
Expand All / Collapse All You can expand the classes by clicking the triangle next to the folder icon. You can choose to use the Expand All feature to expand all classes and objects, and the Collapse All feature to collapse all classes and objects.
1. Click Expand all to expand all folders in universe outline. 2. Click Collapse all to collapse or close all folders in the universe outline.
Result Object Panel The data for objects in the Results Objects panel will be returned when the query is run. To add objects to the Results Objects double-click the object or drag and drop the object from the Universe Outline into the Result Object Panel.
Removing Objects from Result Objects To remove one or more objects from the Result Objects panel:
1. Click the button to remove selected object.
2. Click the button to remove all objects.
Query Filter Panel Filters allow you to limit the data returned by your query. There are two types of Query Filters: predefined and user-defined. Predefined query filters are filters are saved in the universe. User-defined query filters are created using any of the objects in the universe.
Web Intelligence User Guide
15 | P a g e
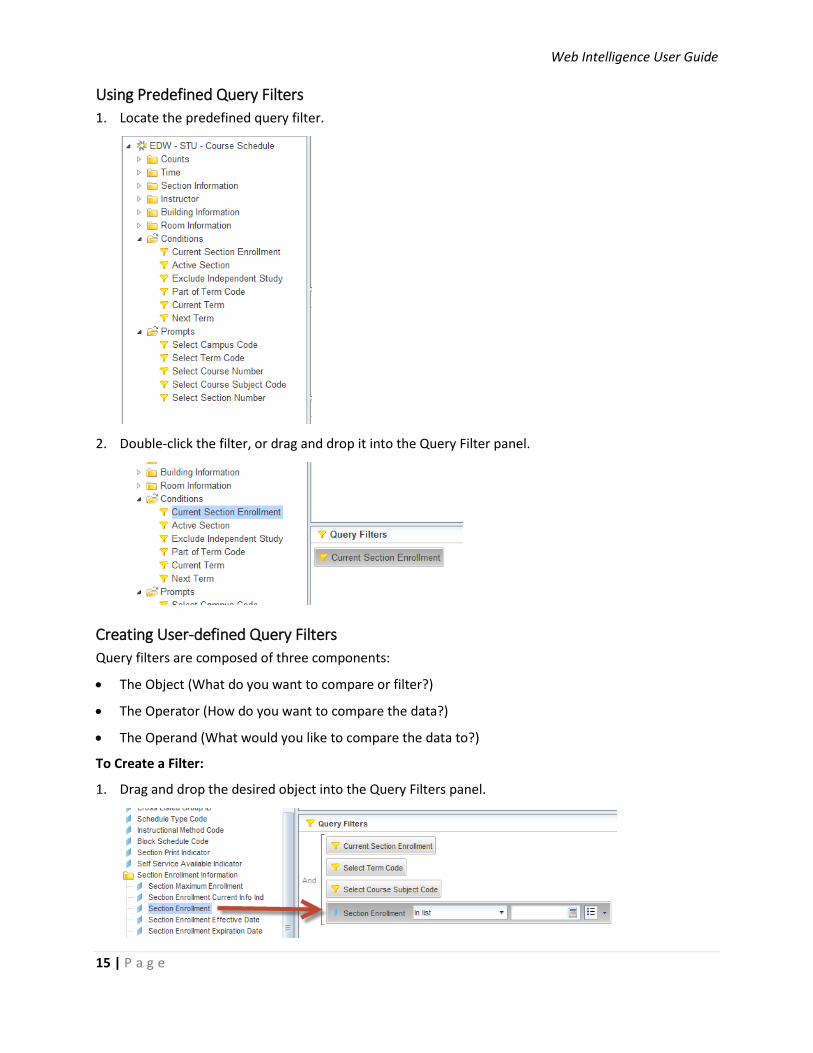
Using Predefined Query Filters 1. Locate the predefined query filter.
2. Double-click the filter, or drag and drop it into the Query Filter panel.
Creating User-defined Query Filters Query filters are composed of three components:
• The Object (What do you want to compare or filter?)
• The Operator (How do you want to compare the data?)
• The Operand (What would you like to compare the data to?)
To Create a Filter:
1. Drag and drop the desired object into the Query Filters panel.

Web Intelligence User Guide
16 | P a g e
2. Click the operator drop-down menu to select an operator. The default operator is In list.
3. Click the Operand Menu button at the end of the filter to specify how to enter the operand. Options include: Enter a Constant, select values from the List of Values, or create a Prompt.
4. To enter a constant, enter the value(s) for your filter in the text box. To enter multiple values, use the semi-colon (;) to separate values. Remember that values must be entered exactly as they appear in the database and are case-sensitive.
5. To use Values from List, select the value(s) from the list, then click the > button. Click OK.

Web Intelligence User Guide
17 | P a g e
6. If using the Prompt option, click the Prompt Properties button to change the way your prompt functions. You may also modify the prompt text in the text box.
Grouping Filters To group two or more filters together to link with the ‘or’ logical operator:
1. Create filters to group.
2. Drag and Drop one filter on top of the other.
3. Click the ‘And’ operator to change to ‘Or’.
Note: The system no longer shows the Blue Rectangular indicating that the filters will be grouped.

Web Intelligence User Guide
18 | P a g e
Data Preview Provides a preview of the data that will be generated once the query is run. Gives you an idea if your query is set up correctly without having to wait for the full query to generate. If this area is empty, Click
Refresh to generate the preview. (Optional)
Answering Prompts If your query contains prompts, the prompt window will be displayed when you run your query.
There are two methods for entering values in the Prompt Window:
• Type a Value box: Manually enter a value in this box. Remember that values must be entered exactly as they appear in the database and are case-sensitive.
• Select Value(s) from the List: select values from the list of values that is populated from the database.
• When you have answered all prompts, click OK to run the query.

Web Intelligence User Guide
19 | P a g e
Report Manager Window Once your query has run, the report will be displayed in the Report Manager window. This window has many toolbars and tabs that contain the various features available in Web Intelligence.
File Tab Create a New Document – Will prompt you for a data source for new document. Open an Existing Document – Will allow you to browse your files to open a document. Save Document – Allows you to save your document as a Web Intelligence Document, Excel, PDF, CSV, or Text file. Also allows you to save document to ypur personal folders in EDDIE. Print – Print your document Find Text in Document – Search for particular text within the dcoument. Export Data – Export the report data as a CSV file. Send Document as an Email Attachment – Opens a new Outlook message and attaches the report. Choices to send as Web Intelligence, Excel, PDF, CSV or Text.
Properties Tab
View – Allows you to view and hide the various menu bars. Document – Document Properties including Refresh on Open. Application – Set Web Intelligence options (Change Default folders, default measurement unit, etc)
Web Intelligence User Guide
20 | P a g e
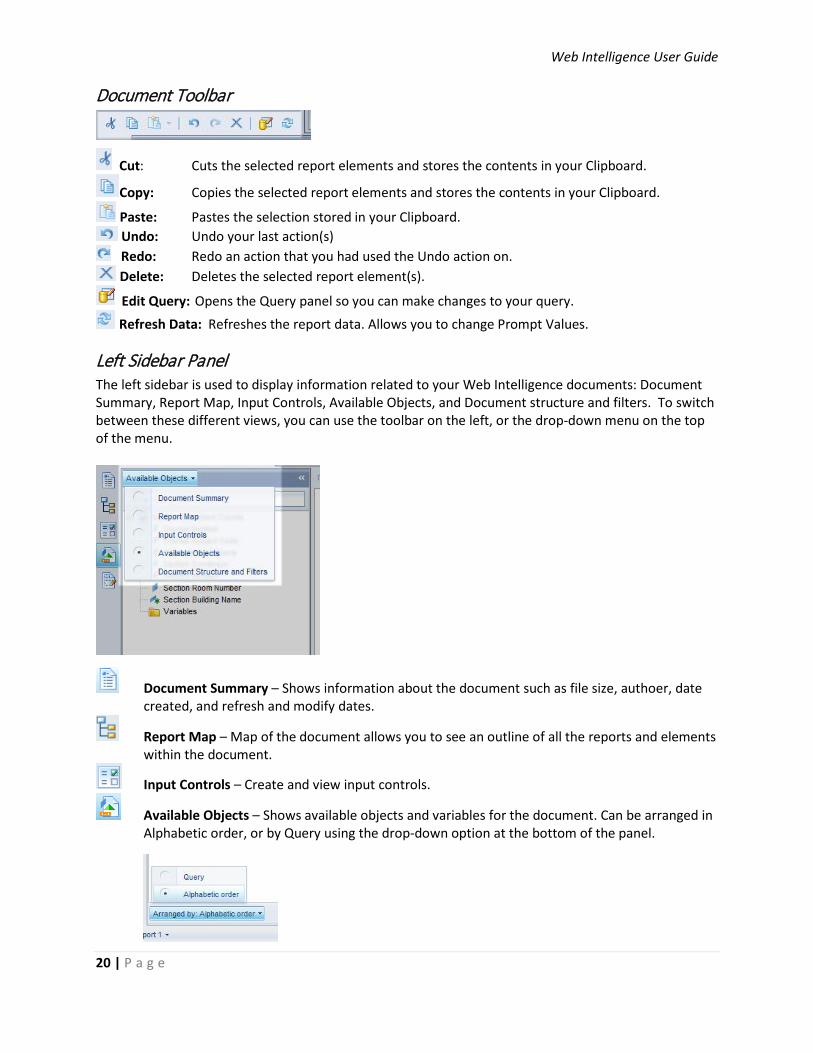
Document Toolbar
Cut: Cuts the selected report elements and stores the contents in your Clipboard.
Copy: Copies the selected report elements and stores the contents in your Clipboard.
Paste: Pastes the selection stored in your Clipboard. Undo: Undo your last action(s)
Redo: Redo an action that you had used the Undo action on. Delete: Deletes the selected report element(s).
Edit Query: Opens the Query panel so you can make changes to your query. Refresh Data: Refreshes the report data. Allows you to change Prompt Values.
Left Sidebar Panel The left sidebar is used to display information related to your Web Intelligence documents: Document Summary, Report Map, Input Controls, Available Objects, and Document structure and filters. To switch between these different views, you can use the toolbar on the left, or the drop-down menu on the top of the menu.
Document Summary – Shows information about the document such as file size, authoer, date created, and refresh and modify dates.
Report Map – Map of the document allows you to see an outline of all the reports and elements within the document.
Input Controls – Create and view input controls.
Available Objects – Shows available objects and variables for the document. Can be arranged in Alphabetic order, or by Query using the drop-down option at the bottom of the panel.

Web Intelligence User Guide
21 | P a g e
Document Structure and Filters – View the structural elements of the document as well as any report filters that are applied to the reports.
Status Bar The Status Bar is located at the bottom of the Web Intelligence Report Manager window.
Page Navigation: Shows the current/total page of document. Use arrows to naivgate to other pages. (First page, Previous page, Next page, and Last page)
Print Preview: buttons allow you to toggle between print preview and quick display mode.
Refresh: Displays the time elapsed since last refresh. Click the Refresh button to refresh document.
Connection Status: Shows the server connection status. Options are Connected or Disconnected. If disconnected, you will not be able to refresh document. Click the status to login to server.
Saving a Document as Web Intelligence 1. In the File Tab, click the Save drop-down menu.
2. Select Save as
3. Select location to save to
4. Name the document
5. Check the Save for All Users and Remove Document Security checkboxes. (Enables other users to open and refresh the document).

Web Intelligence User Guide
22 | P a g e
6. Click Save
Saving to Other File Formats (Excel, PDF, CSV, and Text) 1. In the File Tab, click the Save drop-down menu.
2. Select Save as
3. In the Files of Type drop-down menu, select desired file type. Options include: • PDF • Excel 2007 (.xlsx) • Excel (.xls) • CSV • Text
4. Select a location to save to and modify the file name if needed.
5. Click Save
Saving Documents to EDDIE The Save to Enterprise option allows you to save a copy of your document to the EDDIE repository.
1. From the File tab, select the save drop-down menu

Web Intelligence User Guide
23 | P a g e
2. Click Save to Enterprise
3. Select the folder or Category to save document to
4. Click Save
Refreshing a Document To refresh your document, or to bring up the prompt window to change prompt values:
1. Click the Refresh Button. You can find this button either on the left sidebar toolbar, or on the toolbar on the bottom-right of the document.
Note: If the Refresh buttons are inactive or grayed-out, you may be working in Offline mode. See Appendix B: Trouble-shoot Common Issues

Web Intelligence User Guide
24 | P a g e
Editing a Query To view or make changes to the query:
1. Click the Edit Data Provider button located on the left sidebar toolbar or in the Data Access Tab.
The Query Panel will be displayed:
2. If you have multiple queries, select the tab for the query you would like to view or edit.
Adding Objects to an Existing Query If you need to add additional objects to an existing query:
1. Click the Edit Data Provider button.
2. Locate the object(s) to add and add them to the Result Objects panel.
3. Run the Query.

Web Intelligence User Guide
25 | P a g e
Adding objects to a Table 1. Open the Available Objects menu.
2. Drag the new object into the table.
3. Use the blue rectangles to determine the location of the new column:
Insert column to the left of current column
Insert column to the right of current column
Replace column with new column
Sorting By default, tables are sorted by dimension and detail columns, left to right in ascending order. There are two methods for adding sorts to a table:
Right-click Menu 1. Right-click in the column to apply sort.
2. Select Sort.
3. Select the desired sort order (Ascending or Descending).
Note: You will notice that the new object is not displayed in your report table.

Web Intelligence User Guide
26 | P a g e
Toolbar Option 1. Select the column to sort on
2. Select Analysis > Display
3. Click the Sort drop-down menu
4. Select the desired sort order (Ascending or Descending)
Changing Sort Priority If a table has multiple sorts applied, you can use the Advanced… sort option to change the priority of the sorts:
1. From the Sort menu box, select Advanced
2. Select the object to change sort priority
3. Under Priority, click the or button
Create a Custom Order Sort 1. From the Sort menu box, select Advanced

Web Intelligence User Guide
27 | P a g e
2. Under Custom Order, select Values button.
4. Use the click the or button to rearrange the order of the sorting.
3. When finished, click OK
Sections Sections divides your report into parts, one for each value for the object used to create the sections. There are two methods to create a section within a report table:
Web Intelligence User Guide
28 | P a g e
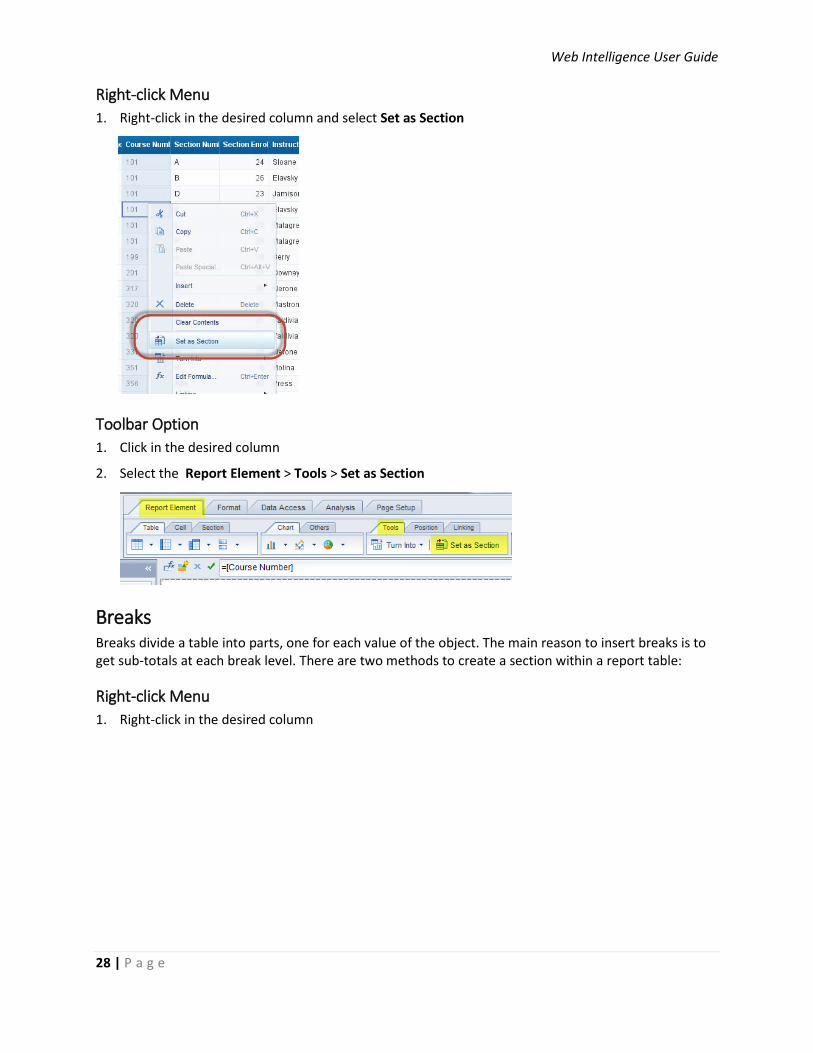
Right-click Menu 1. Right-click in the desired column and select Set as Section
Toolbar Option 1. Click in the desired column
2. Select the Report Element > Tools > Set as Section
Breaks Breaks divide a table into parts, one for each value of the object. The main reason to insert breaks is to get sub-totals at each break level. There are two methods to create a section within a report table:
Right-click Menu 1. Right-click in the desired column

Web Intelligence User Guide
29 | P a g e
2. Select Break > Add Break
Toolbar Option 1. Select the column for desired break
2. Select Report Elements > Table Layout > Break > Add Break
Managing Breaks To manage the way a break is displayed or the properties for a break:
1. Select the column that contains the break.
2. Right-click and select Breaks > Manage Break

Web Intelligence User Guide
30 | P a g e
3. From this menu, you can:
• Add additional breaks and manage the priority of breaks
• Remove breaks
• Turn on/off break headers and footers
• Turn on/off sorting on breaks
• Change the way duplicate values are displayed within a break
• Avoid page breaks within a break
• Have header row repeated at the top of each page
Inserting Calculations There are two ways methods to insert a calculation into a report:
Right-click Menu 1. Right-click in the column for desired calculation
2. Select Insert
3. Select the desired calculation

Web Intelligence User Guide
31 | P a g e
Toolbar Option 1. Select the column for desired calculation
2. Select Analysis > Functions
3. Select either Sum, Count, or More (Average, Min, Max, and Percentage)
Inserting Predefined Cells into Report Web Intelligence provides several predefined cells that can be added to enhance your reports. The following cells can be found in the Report Element toolbar tab:
Available Predefined Cells Document Name Displays the Document Name
Last Refresh Date Displays the date the report was last refreshed
Drill Filters Displays all applying drill filters (using the Filter bar)
Query Summary Displays a summary of the query including the Universe name, object descriptions, and number of rows returned.
Prompt Displays a summary of all prompts, or individual prompts
Report Filter Summary Displays all report filters that are applied to a report

Web Intelligence User Guide
32 | P a g e
Page Numbers Displays the page number on the report. Can also include total number of pages.
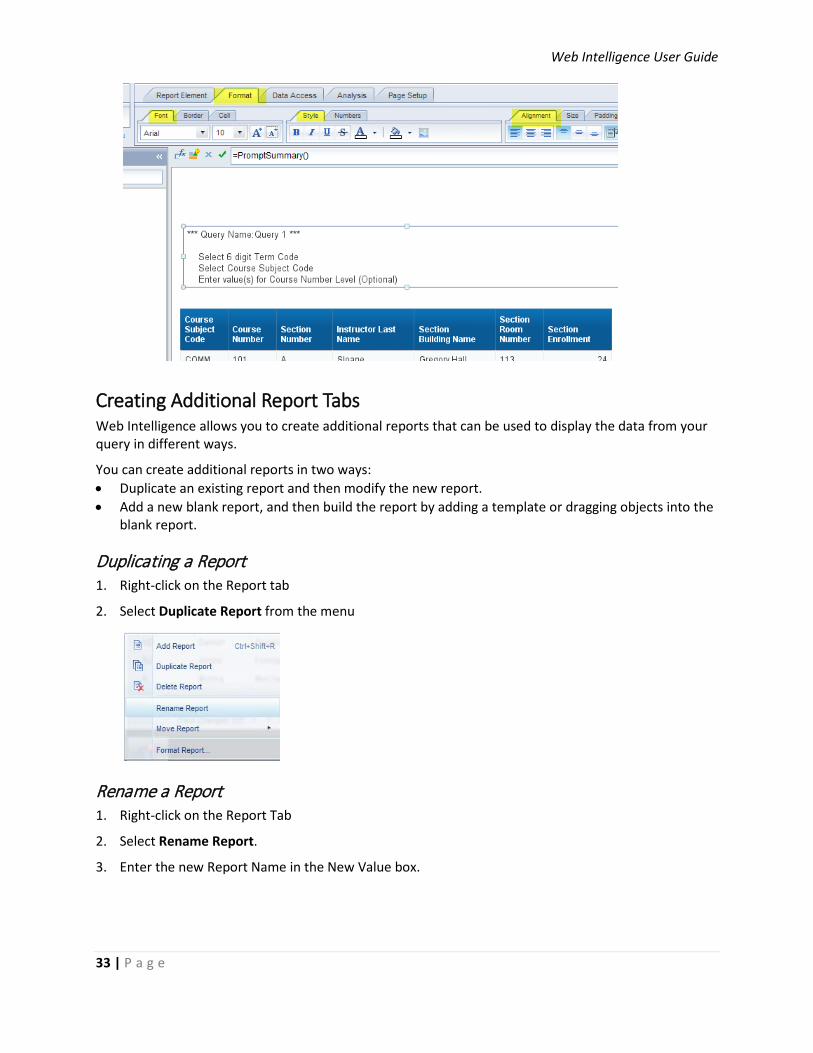
Adding a Prompt Summary 1. Select the Report Element toolbar tab
2. Select the Cell sub-tab
3. Select the Pre-Defined Drop-down menu button
4. Select Prompt > Prompt Summary
5. Click your mouse in the location to display the prompt summary
6. Click on the Format toolbar tab to change the font and cell formatting for the Prompt Summary
Web Intelligence User Guide
33 | P a g e
Creating Additional Report Tabs Web Intelligence allows you to create additional reports that can be used to display the data from your query in different ways.
You can create additional reports in two ways: • Duplicate an existing report and then modify the new report. • Add a new blank report, and then build the report by adding a template or dragging objects into the
blank report.
Duplicating a Report 1. Right-click on the Report tab
2. Select Duplicate Report from the menu
Rename a Report 1. Right-click on the Report Tab
2. Select Rename Report.
3. Enter the new Report Name in the New Value box.

Web Intelligence User Guide
34 | P a g e
4. Click OK.
Filtering a Report Web Intelligence offers several ways to apply filters to a report. In this section we will cover how to use Report Filters, the Filter Toolbar, and Input Controls to filter the data displayed in reports.
Using Report Filters There are two methods for accessing the Report Filter feature:
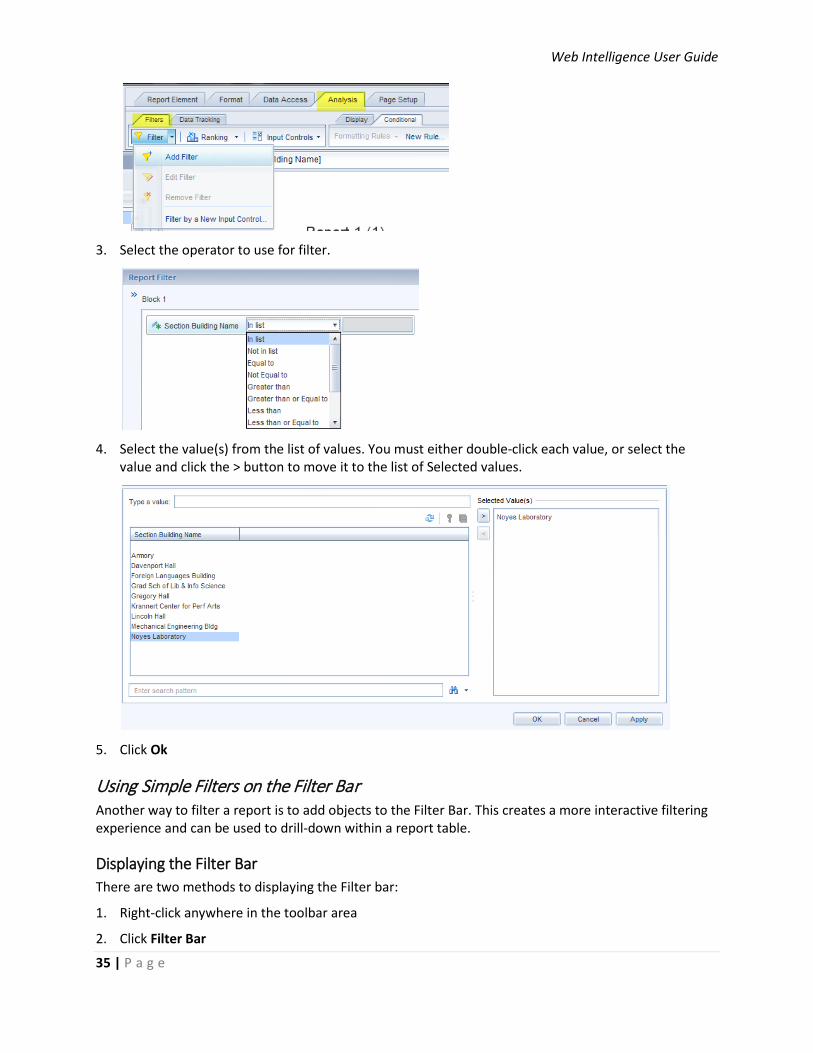
1. Right-click in the column that you wish to filter, then select Filter > Add Filter
2. Select the column that you wish to filter, then on the toolbars, select Analysis > Filters > Filter > Add Filter
Note: When you rename the report tab, the report title is automatically updated.
Web Intelligence User Guide
35 | P a g e
3. Select the operator to use for filter.
4. Select the value(s) from the list of values. You must either double-click each value, or select the value and click the > button to move it to the list of Selected values.
5. Click Ok
Using Simple Filters on the Filter Bar Another way to filter a report is to add objects to the Filter Bar. This creates a more interactive filtering experience and can be used to drill-down within a report table.
Displaying the Filter Bar There are two methods to displaying the Filter bar:
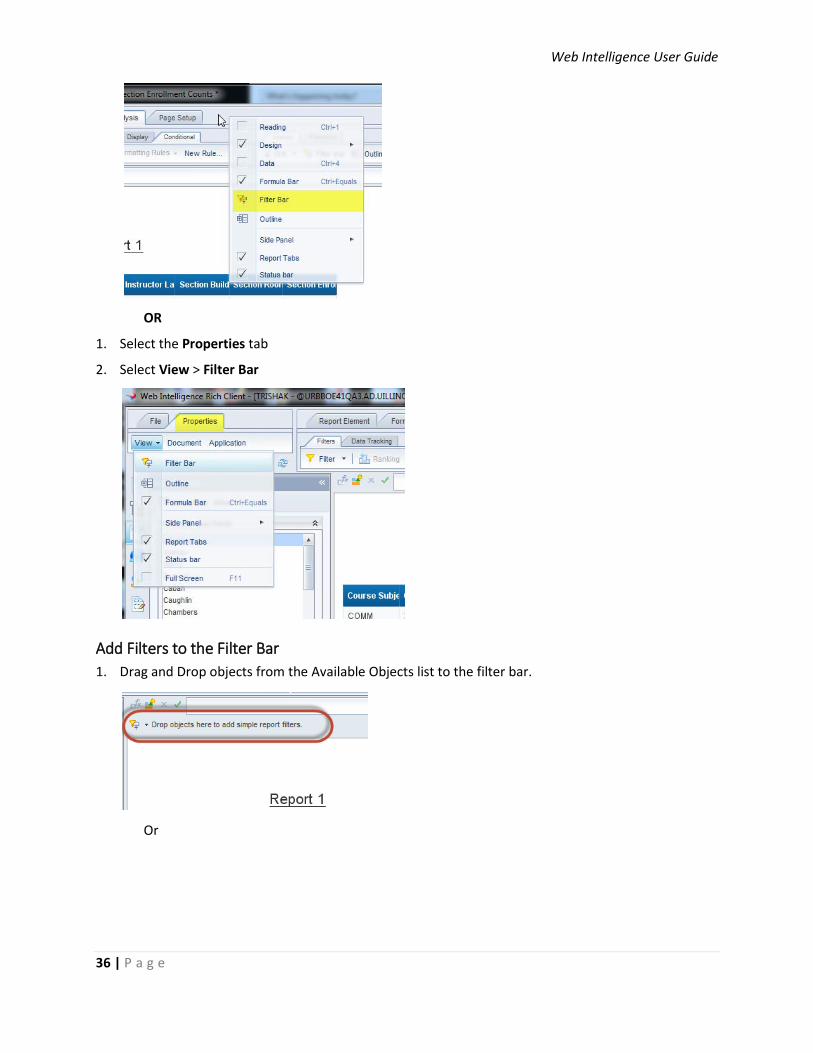
1. Right-click anywhere in the toolbar area
2. Click Filter Bar
Web Intelligence User Guide
36 | P a g e
OR
1. Select the Properties tab
2. Select View > Filter Bar
Add Filters to the Filter Bar 1. Drag and Drop objects from the Available Objects list to the filter bar.
Or
Web Intelligence User Guide
37 | P a g e
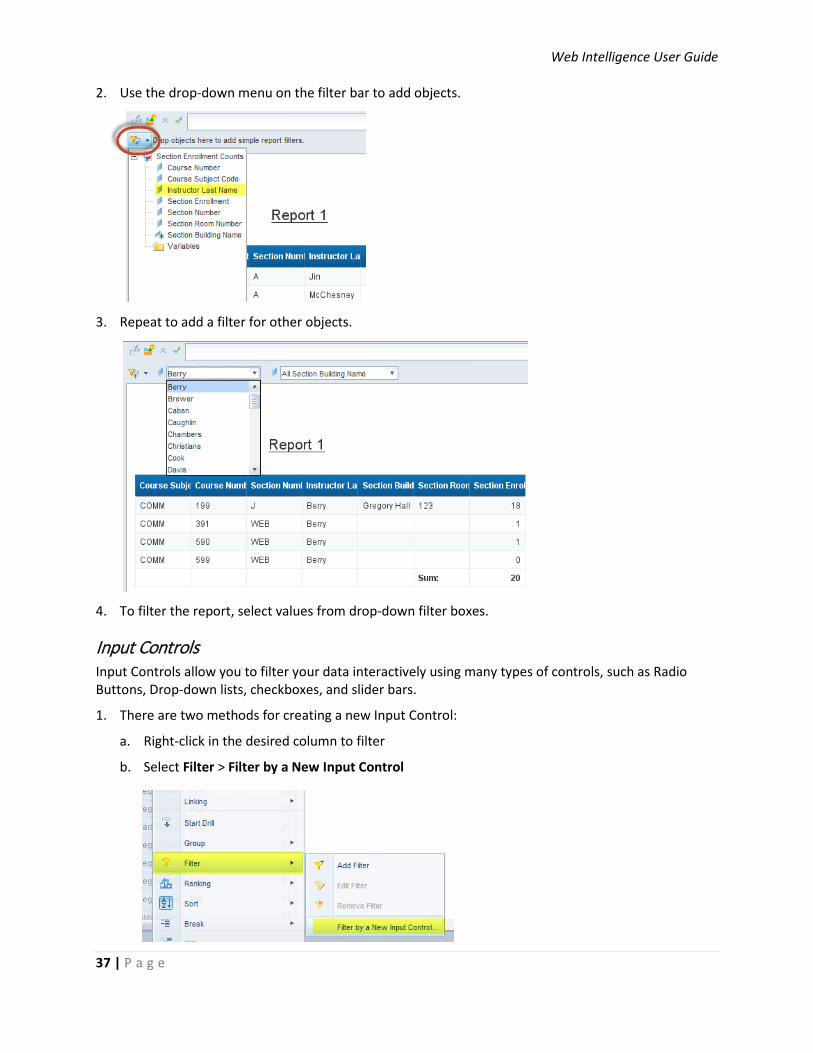
2. Use the drop-down menu on the filter bar to add objects.
3. Repeat to add a filter for other objects.
4. To filter the report, select values from drop-down filter boxes.
Input Controls Input Controls allow you to filter your data interactively using many types of controls, such as Radio Buttons, Drop-down lists, checkboxes, and slider bars.
1. There are two methods for creating a new Input Control:
a. Right-click in the desired column to filter
b. Select Filter > Filter by a New Input Control

Web Intelligence User Guide
38 | P a g e
OR
a. On the toolbars, select Analysis > Filters > Input Controls.
2. Verify that the correct object is selecting and click Next.
3. Select the desired control type from the menu to the left.
4. Modify any properties needed, based on the control type selected.
5. Click Next.

Web Intelligence User Guide
39 | P a g e
6. Select the report elements that should be controlled by the new input control.
7. Click Finish.
The new Input Control will be displayed in the Input Control menu on the left sidebar.

Web Intelligence User Guide
40 | P a g e
8. Select value(s) to filter the report.
Editing or Removing an Input Control 1. In the Input Control sidebar, hover mouse over the title of the control
2. Click to edit the control
3. Click to remove the control
Creating Variables A variable is a formula with a name associated with it. Variables allow you to combine data for different objects or use part of the data for an object. There are two methods for bringing up the Create Variable window:
1. From the Available Objects menu, right-click on the Variables folder and select Create New Variable.

Web Intelligence User Guide
41 | P a g e
2. From the toolbars, select Data Access > Data Objects > New Variable.
The Create Variable window is displayed.
3. Enter the name of the variable.
4. Select the Qualification for the variable. (Dimension, Detail, or Measure)
5. If you are creating a Detail, select the Associated Dimension by clicking the button.

Web Intelligence User Guide
42 | P a g e
6. Enter the forumla for the variable in the Formula box. Use the Available Objects, Functions, and Operators lists to assist in writing the variable formula.
7. Click the button to validate your formula.
8. Click OK to exit and save your variable.
Displaying a List of Values in the Variable Editor If you are inserting values for a particular object into the variable formula, you can choose the values from the list of values:
1. Select the Object from the Available Objects list.
2. Double-click the Values option under Operators.
3. Select the value(s) to add to the formula and click OK
Grouping Web Intelligence allows you to create Grouping variables to group your data. For example, you can create groups based on the number of students enrolled in a course, or categorize transactions.
1. From the Toolbars, select Analysis > Display > Group

Web Intelligence User Guide
43 | P a g e
(or right-click in the column to group, and select Group > Manage Groups)
2. Enter a name for the grouping variable (For example: “Enrollment Levels”)
3. Select values to include in the first grouping.
4. Click the button.
5. Enter a name for the new group and click OK.
6. Repeat steps 3-5 until all groups have been created.

Web Intelligence User Guide
44 | P a g e
7. To manage ungroup values, click the Ungrouped Values button. There are two options for ungrouped values:
a. Check Visible to see the actual value.
b. Check Automatically Group to assign a group name for all ungrouped values. The default group name is “Other”.
8. Click Ok to exit Manage Groups window.
9. The Grouping will be displayed in the Variable folder in the Available Objects list.

Web Intelligence User Guide
45 | P a g e
To manage an existing group: 1. Right-click in the grouped variable column.
2. Select Group > Manage Group
To manage a particular value: 1. Right-click on the value
2. Select Group
3. Select from options:
a. Move to Group
b. Ungroup
c. Rename Group
Merge Dimension Merge Dimension allows you to synchronize data from multiple data providers into one table. Objects with common data values are merged so the data from each data provider can be combined into a table.
Step 1: Sort Available Objects by Query 1. Select the Available Objects list in the left sidebar.
2. At the bottom of the Available Objects panel, select Arranged by: drop-down menu.

Web Intelligence User Guide
46 | P a g e
3. Select Query
The Available Objects list will now be sorted by Query:
Step 2: Merge Dimension Objects Dimension Objects from difference data sources can be merged in two ways:
Using the Right-click Menu 1. In the Available Objects menu, select the first object to merge.
2. Hold down the CTRL key, and select the second object to merge. The object will most likely be grayed out, but you will still be able to select it.
3. Right-click on that object, and select Merge
Web Intelligence User Guide
47 | P a g e
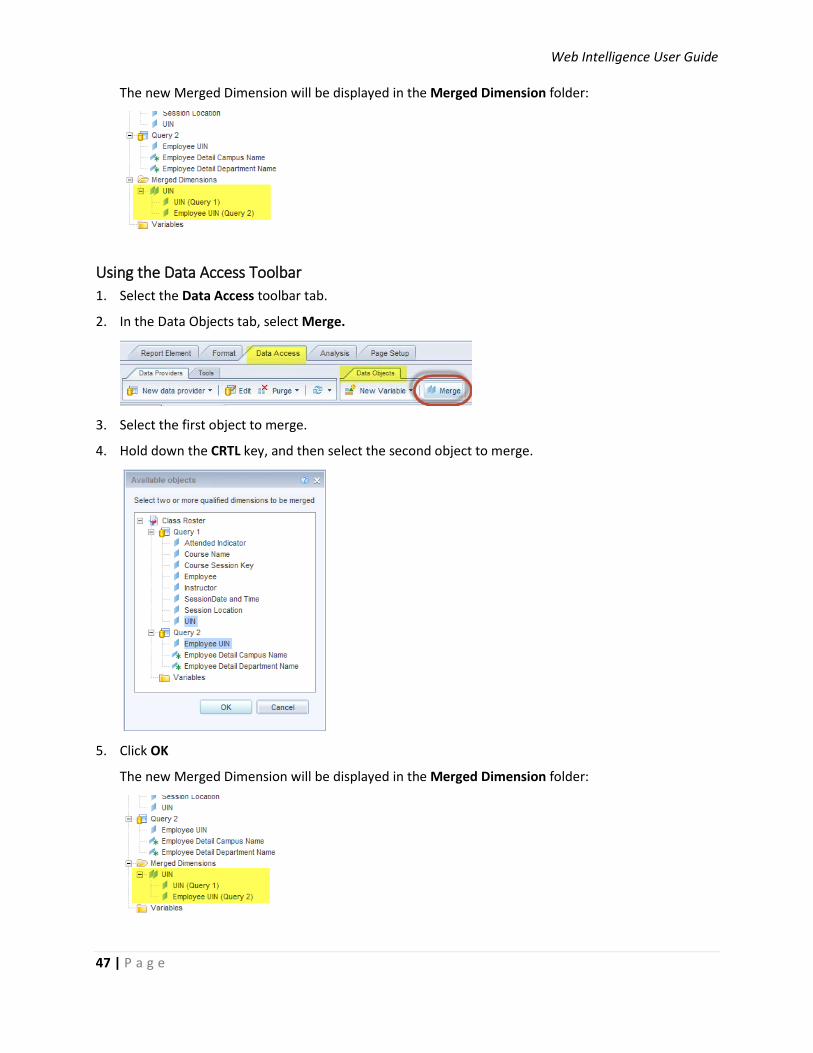
The new Merged Dimension will be displayed in the Merged Dimension folder:
Using the Data Access Toolbar 1. Select the Data Access toolbar tab.
2. In the Data Objects tab, select Merge.
3. Select the first object to merge.
4. Hold down the CRTL key, and then select the second object to merge.
5. Click OK
The new Merged Dimension will be displayed in the Merged Dimension folder:

Web Intelligence User Guide
48 | P a g e
Step 3: Create Variables for Objects to be Displayed with Other Data Source Business Objects has a rule that only objects from a single data source may be displayed together in a table (or block) of data. In order to join objects from multiple data sources into the same block of data, you must build Varaiables for each object, and those variables must be created as Details of the Merged Dimension.
1. In the Available Objects listing, right-click on the Variables folder
2. Select Create New Variable
3. Enter a name for the variable. You must use a distinct name. It cannot be the same as any of the objects in your query.
4. From the Qualifications drop-down menu, select Detail
5. Select the button to the right of the Associated Dimension field.
6. Change the Arranged by: option to Query
Note: You may also select the Data Access toolbar tab, then select New Variable from the Data Objects menu.

Web Intelligence User Guide
49 | P a g e
7. Select the Merged Dimension object from the list of available objects.
8. Click OK
9. Double-click the desired object from the Available Objects list in the variable window. The formula =[object name] will be populated in the Formula box.
10. Click OK
The new detail variable has been created and added to the Variables folder.

Web Intelligence User Guide
50 | P a g e
11. Drag and Drop the variable into the desired location in the Data Block.
Report Formatting
Viewing the Print Preview (Page View) To see what your document will look like when printed, change the view mode to Page Mode:
1. Select the Page Setup tab
2. Select the Display sub-tab.
3. Click the Page button.
Scaling (Fit to Page) If your report has many columns, you can use the Scale to Page feature to easily fit your report to one page width.
1. Select the Page Setup tab.
2. Select the Scale to Page sub-tab.
3. Use the Width or Height drop-down menus to select the desired scale.
Changing Page Margins 1. Select the Page Setup tab.
2. Select the Margins tab.
Web Intelligence User Guide
51 | P a g e
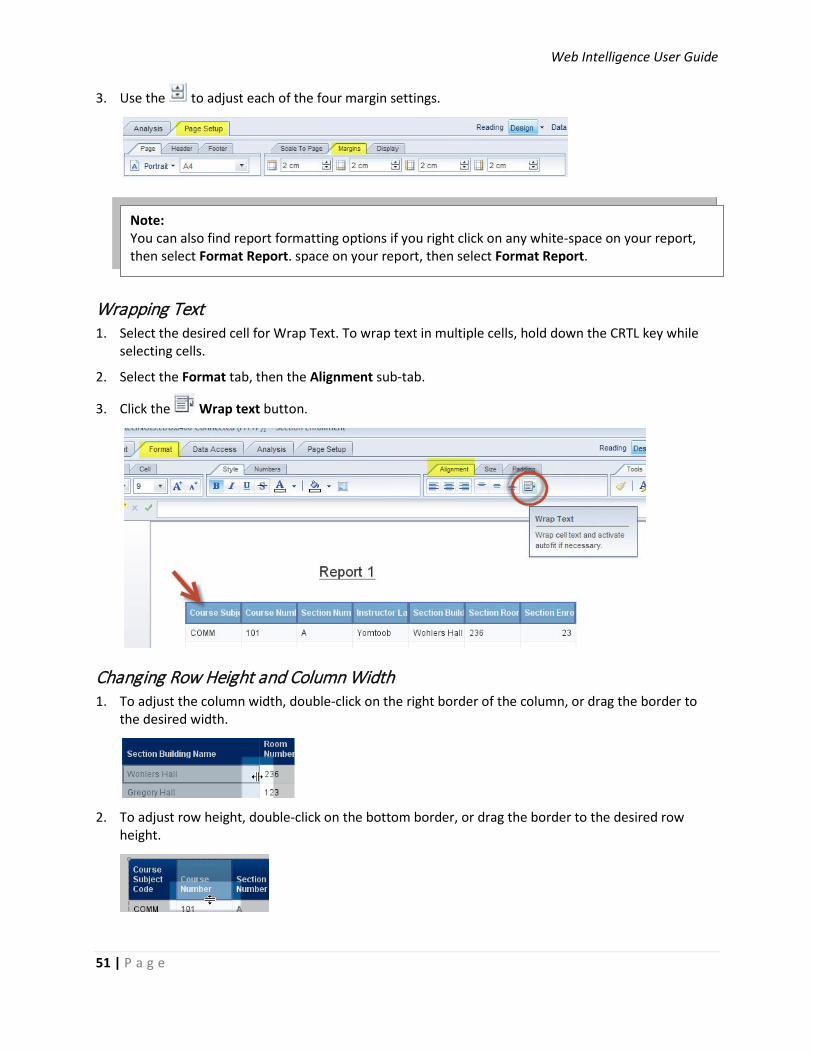
3. Use the to adjust each of the four margin settings.
Wrapping Text 1. Select the desired cell for Wrap Text. To wrap text in multiple cells, hold down the CRTL key while
selecting cells.
2. Select the Format tab, then the Alignment sub-tab.
3. Click the Wrap text button.
Changing Row Height and Column Width 1. To adjust the column width, double-click on the right border of the column, or drag the border to
the desired width.
2. To adjust row height, double-click on the bottom border, or drag the border to the desired row height.
Note: You can also find report formatting options if you right click on any white-space on your report, then select Format Report. space on your report, then select Format Report.

Web Intelligence User Guide
52 | P a g e
Rearranging Columns 1. Click your mouse anywhere in the column that you would like to move.
2. Drag and drop the column to the desired location.
3. Use the blue rectangle to determine the new column location.
Deleting a Column If you no longer want a column displayed in a table, you can delete it:
1. Select the column to be removed.
2. Click the Delete button (or right-click and select Delete)
Format Numbers You can change how numeric values in certain cells or columns are displayed. By default, number formats are defined for the objects in the universe. Use Format Number to select another predefined format, or to create a custom format for numbers in your report.
1. Right-click in the column or cell that contains the number values to reformat.

Web Intelligence User Guide
53 | P a g e
2. Select Format Number
3. Select the type of number to be formatted (Number, Currency, Date/Time, etc.)
4. Select a predefined format, or click Custom to create a custom format.
5. Click OK
Editing the Report Title 1. Double-click in the Report 1 cell.
2. Enter a new name in the formula editor box

Web Intelligence User Guide
54 | P a g e
3. Click the Validate checkmark
Conditional Formatting You can set up conditions that will automatically format the data in your Web Intelligence documents to alert you to when values value fall below or above specific thresholds, or when certain strings appear.
1. Select the Analysis tab
2. Select the Conditional subtab
3. Click New Rule to create a new conditional formatting rule
4. Enter a name for the rule in the Name box
5. In the Filtered Object or Cell field, click the button
6. Select the desired object for the conditional formatting rule
7. Click Select an Object or a Variable
Note: If you rename the report tab, the report title will be updated to match.

Web Intelligence User Guide
55 | P a g e
8. Select the object or variable from the list of Available objects and click OK
9. Select an operator from the Operator drop-down list.
10. Type a value in the Operand field, or click the button to select a value from the list of values.
11. Click the Format button to change the way you want the values to be formatted if the condition is true. (Default will be to display value in red text)

Web Intelligence User Guide
56 | P a g e
• To change the font and font style for text, click the Text menu
• To add a highlight or background color to the cell, click the Background menu
• To add a border to the cell, click the Border menu.
12. Click OK
13. To add another conditional rule, click the button.
14. When all rules have been created, click OK
Applying the Formatting Rule to a Table: 1. Select the column that the rule will apply to
2. On the Analysis > Conditional menu, select Formatting Rules drop-down menu
3. Check the rule you would like to apply to the column.

Web Intelligence User Guide
57 | P a g e
Example: Format all sections with an enrollment less than 10


