1 EXPERIMENTAL AND NUMERICAL ANALYSIS OF BENDING-BUCKLING MIXED FAILURE OF BRICKWORK WALLS Ernest Bernat a* , Lluis Gil a , Pere Roca b and Cristián Sandoval c a Department of Strength of Materials and Engineering Structures Technical University of Catalonia UPC. BarcelonaTech. ETSEIAT, Colom 11. 08222 Terrassa, Spain b Department of Construction Engineering Technical University of Catalonia UPC. BarcelonaTech. ETSECCPB. Jordi Girona 1-3. 08034 Barcelona, Spain c Department of Structural and Geotechnical Engineering, and School of Architecture Pontificia Universidad Católica de Chile. Casilla 306, Correo 22. Santiago, Chile. ABSTRACT The eccentric in-plane loading of masonry walls involves complex bending performance that includes second-order effects. In this work, a bidimensional (2D) simplified micro-model for the analysis of this type of failure is developed. An experimental investigation based on 20 tests of full-scale unreinforced masonry walls is performed. The tests are characterised by slenderness and load eccentricity. The analytical methods of Eurocode-6 and ACI-530 are compared with experimental data from the present investigation, other experimental results available * Corresponding author: Tel.: +34 937398728; fax: 937398994 e-mail address: [email protected]
Transcript
1
EXPERIMENTAL AND NUMERICAL ANALYSIS OF BENDING-BUCKLING MIXED FAILURE
OF BRICKWORK WALLS
Ernest Bernata*, Lluis Gila, Pere Rocab and Cristián Sandovalc
a Department of Strength of Materials and Engineering StructuresTechnical University of Catalonia UPC. BarcelonaTech.
ETSEIAT, Colom 11. 08222 Terrassa, Spain
b Department of Construction EngineeringTechnical University of Catalonia UPC. BarcelonaTech.
c Department of Structural and Geotechnical Engineering, and School of ArchitecturePontificia Universidad Católica de Chile. Casilla 306, Correo 22. Santiago, Chile.
ABSTRACT
The eccentric in-plane loading of masonry walls involves complex bending performance that
includes second-order effects. In this work, a bidimensional (2D) simplified micro-model for
the analysis of this type of failure is developed. An experimental investigation based on 20
tests of full-scale unreinforced masonry walls is performed. The tests are characterised by
slenderness and load eccentricity. The analytical methods of Eurocode-6 and ACI-530 are
compared with experimental data from the present investigation, other experimental results
available in the literature and simulation results from the numerical model.
this study is a 2D plane-strain simplified micro-model that combines solid elements to
represent the units with interface joint elements to represent the bed joints. As it is normally
done when using simplified micro-models, the unit volume is increased to represent the
surrounding mortar joints. Hence, the model is composed of extended units that model both
bricks and mortar and zero-thickness interface elements that simulate the discontinuities. The
interface elements do not affect the response to compression but can open and rotate under
tension. In compression, the units are assumed to behave elastically up to the compression
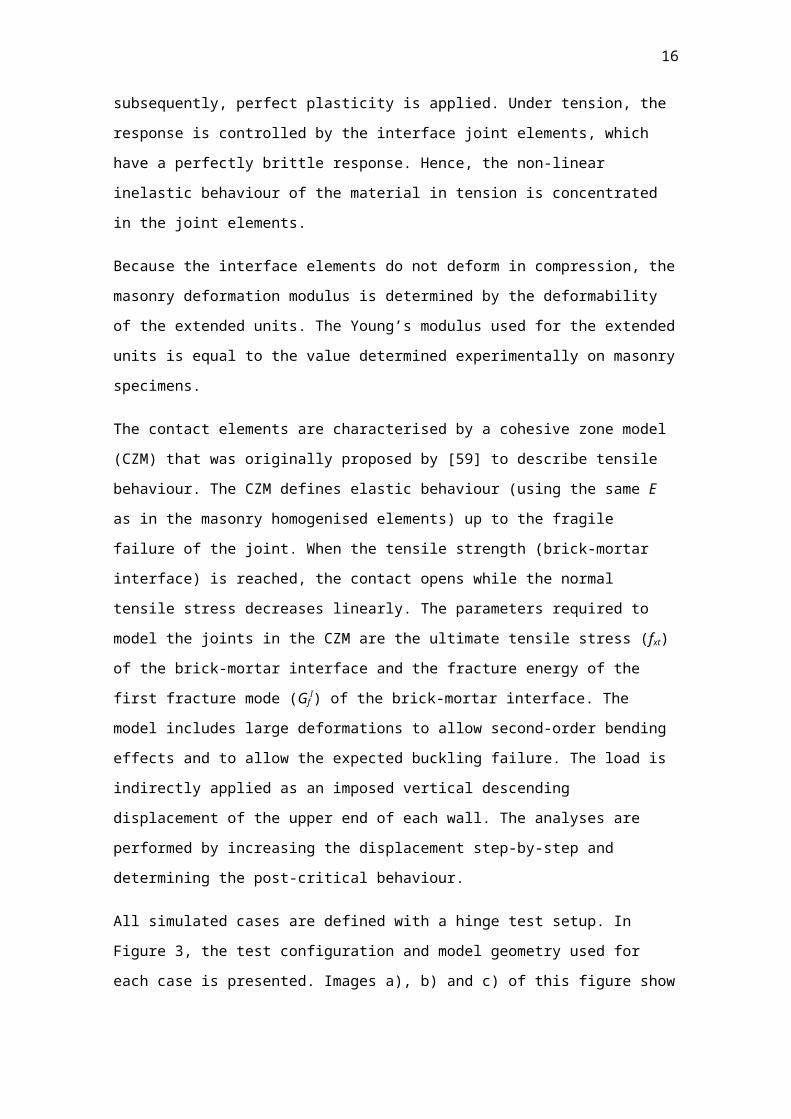
limit; subsequently, perfect plasticity is applied. Under tension, the response is controlled by
the interface joint elements, which have a perfectly brittle response. Hence, the non-linear
inelastic behaviour of the material in tension is concentrated in the joint elements.
Because the interface elements do not deform in compression, the masonry deformation
modulus is determined by the deformability of the extended units. The Young’s modulus used
for the extended units is equal to the value determined experimentally on masonry specimens.
The contact elements are characterised by a cohesive zone model (CZM) that was originally
proposed by [59] to describe tensile behaviour. The CZM defines elastic behaviour (using the
same E as in the masonry homogenised elements) up to the fragile failure of the joint. When
the tensile strength (brick-mortar interface) is reached, the contact opens while the normal
tensile stress decreases linearly. The parameters required to model the joints in the CZM are
the ultimate tensile stress (fxt) of the brick-mortar interface and the fracture energy of the first
fracture mode (GfI) of the brick-mortar interface. The model includes large deformations to
allow second-order bending effects and to allow the expected buckling failure. The load is
indirectly applied as an imposed vertical descending displacement of the upper end of each
wall. The analyses are performed by increasing the displacement step-by-step and determining
the post-critical behaviour.
All simulated cases are defined with a hinge test setup. In Figure 3, the test configuration and
model geometry used for each case is presented. Images a), b) and c) of this figure show the
real test configuration, with the actual shape of the hinges, for the walls of the current
experimental campaign (a), the experimental campaign presented in [27] (b) and the cases in
11
[26] (c). The second column of images in Figure 3 (d, e, f), shows the geometric definition of
the model used for the same experimental campaigns. Finally, illustrations g) h) and i) of the
Figure 3 (cases g), h) and i)) represent the model used for each case including the boundary
conditions, the masonry rows definition and the loading process.
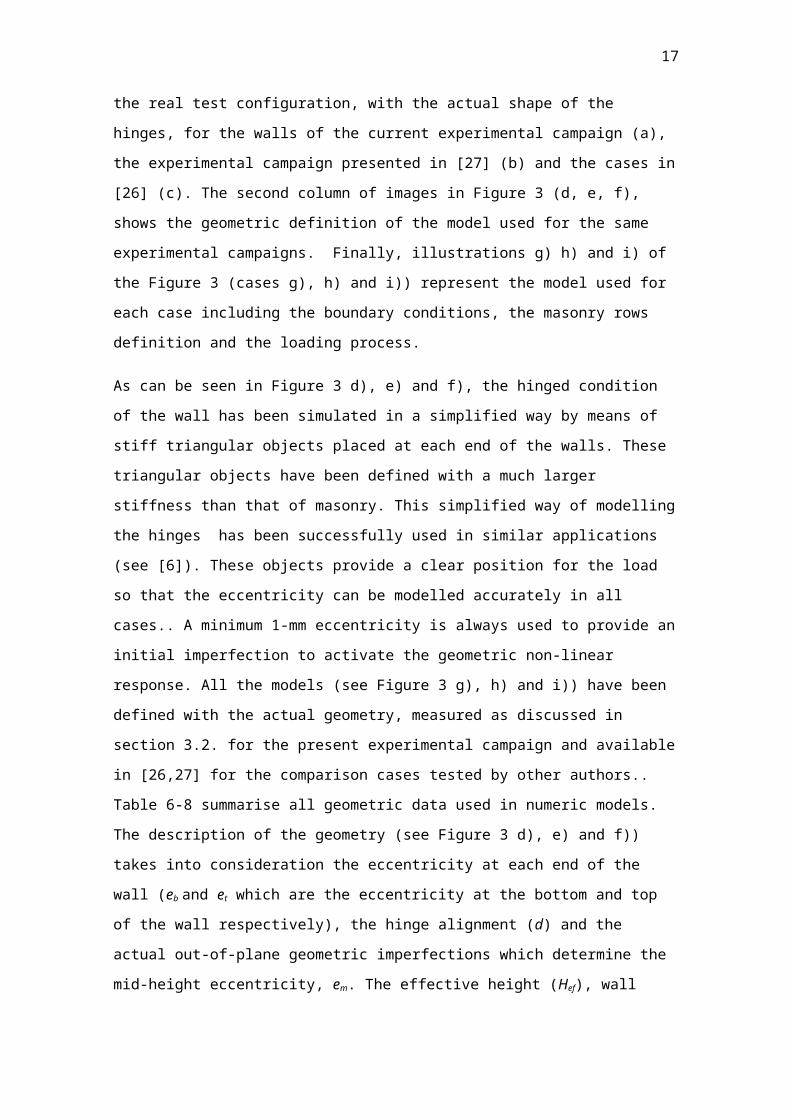
As can be seen in Figure 3 d), e) and f), the hinged condition of the wall has been simulated in a
simplified way by means of stiff triangular objects placed at each end of the walls. These
triangular objects have been defined with a much larger stiffness than that of masonry. This
simplified way of modelling the hinges has been successfully used in similar applications (see
[6]). These objects provide a clear position for the load so that the eccentricity can be
modelled accurately in all cases.. A minimum 1-mm eccentricity is always used to provide an
initial imperfection to activate the geometric non-linear response. All the models (see Figure 3
g), h) and i)) have been defined with the actual geometry, measured as discussed in section 3.2
for the present experimental campaign and available in [26,27] for the comparison cases
tested by other authors.. Table 6-8 summarise all geometric data used in numeric models. The
description of the geometry (see Figure 3 d), e) and f)) takes into consideration the eccentricity
at each end of the wall (eb and et which are the eccentricity at the bottom and top of the wall
respectively), the hinge alignment (d) and the actual out-of-plane geometric imperfections
which determine the mid-height eccentricity, em. The effective height (Hef), wall thickness (t)
and average masonry row height (hrow) are also presented in Table 6-8.
A mapped mesh of 8-node quadrangular elements is used in combination with the interface
elements. The parameters required by the numerical model are the modulus of elasticity (E),
the Poisson’s coefficient (υ) and the compressive strength (fc) of the masonry. The model
requires also the bonding strength (fxt) of the brick-mortar interface and the fracture energy of
the brick-mortar interface of the first fracture mode (GfI) as input data. In the lack of direct
experimental information, the fracture energy has been estimated based on a linear fitting,
based on experimental values from [60], relating the fracture energy of the brick-mortar
interface, GfI with the corresponding bonding strength fxt. The resulting correlation allows the
estimation of the fracture energy as GfI= 36.65· fxt, where Gf
I is given in N/m and fxt in
MPa.Table 9 summarises the values of all variables used for each simulation case. Table 6 and
Table 7 show the comparison of the numerical predictions with all the experimental results for
the cases taken from the literature [26, 27]. Figure 9 and Figure 10 show a graphical
comparison between the experimental load-bearing capacity of the walls presented in [26, 27]
and the numerical results for different slenderness and eccentricities. Table 8 presents the
12
geometric data for the simulation of the walls tested in the current research. It must be noted
that previous researches do not provide comprehensive information about the lateral or
vertical displacement of the walls at the collapse load. In contrast, the work herein presented
includes a comparison of the numerical predictions of the lateral deformation of the walls at
mid-height (Figure 8) and the vertical descending movement of the top of the specimen with
the corresponding experimental values (Figure 7).
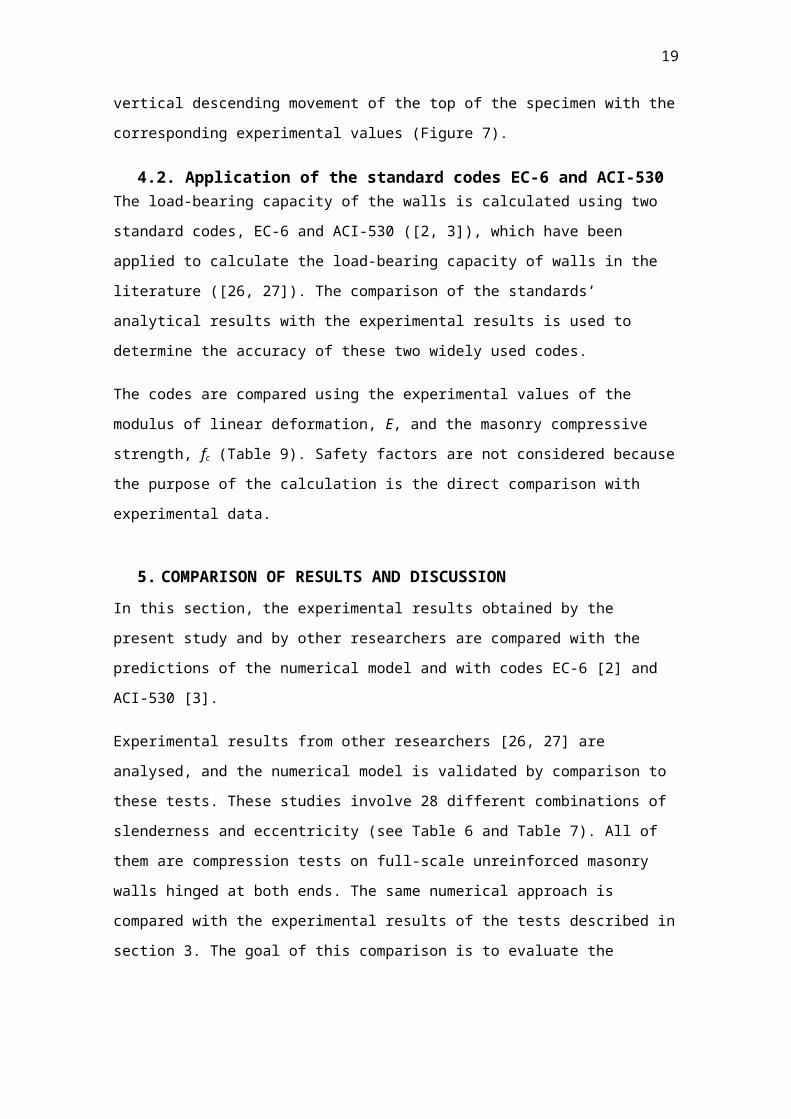
4.2. Application of the standard codes EC-6 and ACI-530 The load-bearing capacity of the walls is calculated using two standard codes, EC-6 and ACI-
530 ([2, 3]), which have been applied to calculate the load-bearing capacity of walls in the
literature ([26, 27]). The comparison of the standards’ analytical results with the experimental
results is used to determine the accuracy of these two widely used codes.
The codes are compared using the experimental values of the modulus of linear deformation,
E, and the masonry compressive strength, fc (Table 9). Safety factors are not considered
because the purpose of the calculation is the direct comparison with experimental data.
5. COMPARISON OF RESULTS AND DISCUSSION
In this section, the experimental results obtained by the present study and by other
researchers are compared with the predictions of the numerical model and with codes EC-6 [2]
and ACI-530 [3].
Experimental results from other researchers [26, 27] are analysed, and the numerical model is
validated by comparison to these tests. These studies involve 28 different combinations of
slenderness and eccentricity (see Table 6 and Table 7). All of them are compression tests on
full-scale unreinforced masonry walls hinged at both ends. The same numerical approach is
compared with the experimental results of the tests described in section 3. The goal of this
comparison is to evaluate the accuracy of the simplified micro-model in predicting the load-
bearing capacity of walls.
The methods proposed by EC-6 [2] and ACI-530 [3] for the determination of the wall capacity
are also applied and compared with the experimental and numerical results.
Experimental data from two sources, namely Watstein & Allen [26] and Kirstchig & Anstötz
[27] were chosen for the comparison because of the clear boundary conditions of the tests
(the walls were hinged at both ends), the detailed information regarding the material
properties and the fact that all walls were at full scale.
13
Table 9 summarises the parameters used in each simulation. For Poisson’s coefficient, which is
of little relevance for the type of 2D modelling utilised, a common value taken from the
literature [61, 62] was used.
The brick-mortar bonding strength (fxt) for the walls tested in [27] was estimated because it
was not provided by the authors. In this case, the value of fxt was chosen to satisfy the ratio
fc/fxt equal to the experimentally obtained value in the present study (fc/fxt = 40). The rest of
the parameters in Table 9 were obtained from the experimental tests.
The series of walls labelled as “HB” in [26] was chosen for comparison. The numerical model
provided a very satisfactory prediction of the corresponding ultimate wall load-bearing
capacities. The average relative error was 10.5%. Some calculated results were higher than the
experimental ones and others were lower, so the model appears to be balanced (see Figure 9).
It predicts without either a conservative or an unsafe bias. However, the results with the least
error were in the cases with the lowest eccentricities. For e=0, the error was 6.4%; for e=t/3,
the error was 19.5 %. The slenderness did not seem to affect the accuracy of the model, as
good results were obtained regardless of the value of the slenderness. On the whole, the
model slightly overestimates the load-bearing capacity of the walls. By contrast, the EC-6 code
produces conservative results, underestimating the capacity of the walls for all cases of [26]
(with an average relative error of 62.1%), while the ACI-530 code shows greater accuracy, with
an error of 45.3%, and a tendency to underestimate the load-bearing capacity of the most
eccentrically loaded walls. Conversely, the ACI-530 code overestimates the load-bearing
capacity of the concentrically loaded walls.
In Figure 10, the results from tests on walls with calcium silicate units reported in [27], are
compared with the results obtained with the numerical model. Good agreement between
experimental and numerical results is shown, with an average relative error of 28.4%. This
error is within the range of the scatter in the experimental results in [27]. The agreement is
particularly good in the cases with lowest eccentricities and/or slenderness (4.2% for e=0 and 𝜆=5.6) in contrast with the trend obtained for the results reported in [26]. The numerical
model seems to overestimate the load-bearing capacity of the walls tested by Kirtsching and
Anstötz [27]. The EC-6 standard code conservatively underestimates the strength of almost all
walls compared with the data in [27] (Figure 10). In all the comparisons, EC-6 overestimates
the load-bearing capacity in only two cases, those with the highest eccentricity. The ACI-530
standard code overestimates most of the ultimate loads. It shows more accurate results for
the cases with low load eccentricity and overestimates the load-bearing capacity for the cases
14
with the greatest load eccentricity. Compared with these data, the average relative error of
the EC-6 standard code is 32.3% and that of the ACI-350 standard code is 28.9%.
The comparison of the numerical model with the results from [26, 27] shows that the largest
influence of the Young’s modulus (E) over the axial load-bearing strength of the walls occurs
when the load is eccentrically applied and second-order bending appears. As the Young’s
modulus increases, the deformation of the wall from second-order effects decreases because
of the increased stiffness of the wall. A larger axial load is thus needed to develop second-
order bending failure, and buckling becomes more likely. Similarly, larger flexural brick-mortar
bonding strength (fxt) contributes by providing more strength against second-order bending
failure. The load-bearing capacity of the walls can also be improved by increasing the masonry
compressive strength (fc). However, the effect of the compressive strength is more apparent
when the predominant failure mode is material crushing, as in the case of walls with low load
eccentricity (e) and a low slenderness ratio (𝜆=Hef/t).
Once validated, the numerical model is applied to predict the response of the H-, M- and S-
series experimental walls presented in section 3.3 (except for wall W#5, whose inconsistent
response has been previously discussed). Table 9 summarises the parameters used in the
simulations. Comparisons between calculated load-bearing capacity and experimental results
are shown in Figure 11, Figure 12 and Figure 13. The best agreement is obtained for the most
slender walls (H series, Figure 11), with an average relative error of 38.4%. Although these
results are not as good as those obtained for the experimental results of previous studies ([26,
27]), the accuracy is acceptable because it is within the range of the common scatter obtained
in the experimental tests. As mentioned previously, experimental results of tests on masonry
walls that rely on the flexural strength of the material normally show highly scattered results,
e.g., [33]. In fact, the scatter in the experimental results in this study is larger than the average
relative error of the numerical model. For H-series walls, the results show no general over- or
underestimation. The best results are obtained for the most slender walls. This is the same
trend that is observed in the modelling tests from [26]. The comparison of a linear fit of the
experimental results to a linear fit of the numerical model results (see Figure 11) show that the
model correctly predicts the behaviour of the more slender walls (the H-series walls).
For the M- and S-series walls, the numerical results are consistently conservative. The error
decreases as the eccentricity increases. This result indicates that the numerical model is more
applicable for slender and eccentrically loaded walls. The average relative errors are 43.2% and
61% for M- and S-series walls, respectively. The errors in the most eccentric tests are 5.1% and
15
52.8% for M- and S-series walls, respectively. The ultimate load calculated with the numerical
model follows the trend of the experimental load measurement (see the linear fit in Figure 12
and the results in Figure 13) and is accurate within the limits of the experimental scatter. The
behaviour of the model could be improved by implementing a constitutive equation to account
for the over-strengthening of masonry in compression, e.g., the increase of the compressive
strength for eccentric loading noticed by other authors [52]. The inclusion of the over-
strengthening in compression would cause higher load-bearing capacities when the crushing
failure process is significant, as in the case of less slender walls subjected to concentric or
moderately eccentric loads.
In general, acceptable agreement is obtained between the experimental results and the
numerical predictions. With respect to the application of standards [2, 3], in the case of the
experimental programmes considered, EC-6 always underestimates the load-bearing capacity
of the walls, with an average relative error of 96.0%. The best agreement is observed for the
less slender walls (S series), with an error of 88.6%. The results from ACI-530 produce an
average relative error of 48.3%, producing conservative results for almost all cases. ACI-530
yields the best results for walls of the H series with an average relative error of 34.6%.
6. CONCLUSIONS
Experimental results on full-scale brickwork walls, tested with in-plane eccentric compression
loads, are presented. The experiments comprise tests on masonry walls, changing the
parameters of slenderness and load eccentricity. All walls are hinged at both ends. This study
completes a previous work on small-scale models.
The experimental results show considerable scatter. Nonetheless, the relationships with
eccentricity and slenderness exhibit the same trends reported in previous research.
The collapses are caused by geometric instability, except for walls W#4, W#14 and W#17, as
discussed in section 3.3. This type of failure is observed in 17 of the 20 tests. As expected, this
collapse mode is more evident in the case of the most slender walls or the most eccentrically
loaded walls.
Using two mechanical hinges in the experimental design is advantageous for the purpose of
validating the numerical tools because the boundary conditions are more precisely known and
can be more accurately modelled.
16
A numerical model for the prediction of the ultimate load-bearing capacity of masonry walls is
chosen and validated by comparison with the experimental results. The experimental results
are also compared with the methods proposed by standards ACI-350 and EC-6 for the
calculation of the load-bearing capacity of masonry walls.
The numerical model yields better results than the two standard codes for all the wall series
tested. Moreover, it is the most balanced method, with predictions of the load-bearing
capacity both over- and underestimating the experimental results. The EC-6 predictions are
conservative for all cases except for those shown in Figure 11. Generally, ACI-530 is more
accurate for cases with low eccentricity and low slenderness. In other words, ACI-530 is more
applicable to cases when the failure is directly associated with masonry crushing. The
numerical model is more accurate in the cases with high eccentricity and more slenderness, as
observed by comparing Figure 11 with Figure 13. The model is less accurate in cases with low
eccentricity and/or less slenderness. This reduction in accuracy may be caused by the
simplicity of the compressive behaviour model (linearly elastic and perfectly plastic). Future
work to include an improved compressive stress-strain relationship in the model is
recommended. Further future works could also be oriented toward incorporating the out-of-
plane shear in the analysis of unreinforced masonry walls.
To obtain acceptable results with a finite element analysis, a realistic Young’s modulus must be
used because it determines the deformation leading to the geometric instability associated
with buckling failure. The formulations included in the standard codes ([2, 3]) are highly
dependent on the value of Young’s modulus. Given the variability and limited information on
the value of Young’s modulus in masonry, it is necessary to do further work on the study of
this essential parameter and its influence of the behaviour of slender and eccentrically loaded
walls.
These results emphasise that a realistic description of the joint behaviour is essential to
accurately predict the load-bearing capacity of unreinforced masonry walls, especially when
the failure mode is primarily second-order bending.
7. ACKNOWLEDGEMENTS
The authors wish to acknowledge Dr. Marco Antonio Pérez, Mr. Juan José Cruz, Mr. Francesc
Puigvert and Mr. Christian Escrig for providing essential support in the experimental
programme and Dr. Jordi Marcé for his assistance in the development of the numerical model.
17
This study has been partially performed within the project BIA 2006-04127, funded by the
Spanish Ministry of Science and Innovation, and the project MURETEX, funded by CDTI -
Spanish Ministry of Economics and Competitiveness, whose assistance is gratefully
acknowledged.
8. REFERENCES
[1] Mann W. Basics of design of masonry walls subjected to vertical loads and buckling according to the present draft of Eurocode EC6 and comparison with experimental data. Proceedings of the 9th International Brick/Block Masonry Conference. Berlin: Deutsche Gesellschaft fur Mauerwerksbau eV; 1991. p. 1281-91.[2] Standardization ECf. Eurocode 6: Design of masonry structures. Part 1-1: General rules for buildings. Rules for reinforced and unreinforced masonry. 1997:150.[3] Committee MSJ. Building Code Requirements for Masonry Structures. ACI 530-05. Farmington Hills: American Concrete Institute; 2005.[4] Lu M, Schultz A, Stolarski H. Analysis of the Influence of Tensile Strength on the Stability of Eccentrically Compressed Slender Unreinforced Masonry Walls Under Lateral Loads. J Struct Eng. 2004;130:921.[5] Brencich A, Corradi C, Gambarotta L, Mantegazza G, Sterpi E. Compressive strength of solid clay brick masonry under eccentric loading. Proceedings British Masonry Society2002. p. 37-46.[6] Sandoval C, Roca P, Bernat E, Gil L. Testing and numerical modelling of buckling failure of masonry walls. Constr Build Mater. 2011;25:4394-402.[7] Dajun D. Studies on brick masonry under compression. Mater Struct. 1997;30:247-52.[8] Defalco A, Lucchesi M. No tension beam-columns with bounded compressive strength and deformability undergoing eccentric vertical loads. IJMS. 2007;49:54-74.[9] Hansen L, Nielsen MP. Stability of masonry columns. orbitdtudk. Lyngby: Technical University of Denmark, Department of Civil Engineering, Section for Structural Engineering; 2003. p. 147.[10] Mura I. Stability of nonlinear masonry members under combined load. Comput Struct. 2008;86:1579-93.[11] Romano F, Ganduscio S, Zingone G. Cracked nonlinear masonry stability under vertical and lateral loads. J Struct Eng. 1993;119:69-87.[12] Schultz A, Mueffelman J, Ojard N. Critical axial loads for transversely loaded masonry walls. 12 th Int Brick/Block Masonry Conf Proc2000. p. 1633-46.[13] Yokel FY. Strength of load bearing masonry walls. J Struct Div. 1971;97:1593-609.[14] Orduña A. Seismic assessment of ancient masonry structures by rigid blocks limit analysis. at www civil uminho pt/masonry: PhD Thesis 2003. University of Minho, Portugal. Available at www. civil. uminho. pt/masonry; 2003. p. 171.[15] Sacco E. A nonlinear homogenization procedure for periodic masonry. Eur J Mechs - A/Sol. 2009;28:209-22.[16] Zucchini A, Lourenço PB. Mechanics of masonry in compression: Results from a homogenisation approach. Comput Struct. 2007;85:193-204.[17] Ainsworth M, Mihai LA. An adaptive multi-scale approach to the modelling of masonry structures. Int J Numer Method Eng. 2009;78:1135-63.[18] Chen S, Moon F, Yi T. A macroelement for the nonlinear analysis of in-plane unreinforced masonry piers. Eng Struct. 2008;30:2242-52.[19] Mistler M, Anthoine a, Butenweg C. In-plane and out-of-plane homogenisation of masonry. Comput Struct. 2007;85:1321-30.
18
[20] Ramalho M, Taliercio A, Anzani A, Binda L, Papa E. A numerical model for the description of the nonlinear behaviour of multi-leaf masonry walls. Adv Eng Softw. 2008;39:249-57.[21] da Porto F, Mosele F, Modena C. Experimental testing of tall reinforced masonry walls under out-of-plane actions. Constr Build Mater. 2010;24:2559-71.[22] Cavaleri L, Failla A, La Mendola L, Papia M. Experimental and analytical response of masonry elements under eccentric vertical loads. Eng Struct. 2005;27:1175-84.[23] Roca P. Simplified methods for assessment of masonry shear-walls. 6º Congresso Nacional de Sismologia e Engenharia Sísmica2004. p. 101-18.[24] Charry J. Estudio experimental del comportamiento de paredes de obra de fábrica de ladrillo ante la acción de cargas laerales. 2010.[25] Murthy C, Hendry a. Model experiments in load bearing brickwork. Build Sci. 1966;1:289-98.[26] Watstein D, Allen MH. Structural performance of clay masonry assemblages built with high-bond organic-modified mortars. Second International Brick Masonry Conference: Structural Clay Products Institute; 1970. p. 99-112.[27] Kirtschig K, Asntötz W. Buckling tests on masonry. Proceedings of the 9th International Brick/Block Masonry Conference. Berlin: IBMAC; 1991. p. 202-9.[28] Knutsson H. Vertical load bearing masonry - The danish approach. Mason Int. 1991;5:23-6.[29] Maurenbrecher AHP. Effect of the test procedures on compressive strength of masonry prisms. 2nd Canadian Masonry Symposium. Ottawa: National Research Council Canada; 1980. p. 119-32.[30] Maurenbrecher AHP. Compressive Strength of eccentrally loaded masonry prisms. In: NRCC, editor. Third Canadian Masonry Symposium. Edmonton: National Research Council Canada; 1983.[31] Maurenbrecher AHP. Axial Compression Tests on Masonry Walls and Prisms. Third North American Masonry Conference. Arlington, Texas: National Research Council Canada; 1985. p. 17.[32] Maurenbrecher AHP. Compressive strength of hollow concrete blockwork. Proceedings of the Fourth Canadian Masonry Symposium. New Brunswick: Institute for Research in Construction of National Research Council Canada; 1986. p. 997-1009.[33] Gazzola EA, Drysdale RG, Essawy AS. Bending of concrete masonry wallettes at different angles to the bed joints. Proceedings of the Third North American Masonry COnference. Arlington, Texas: Construction Research Center Civile Engineering Department University of Texas; 1985. p. 15.[34] Sinha B, Ng C, Pedreschi R. Failure criterion and behavior of brickwork in biaxial bending. J Mat Civil Eng. 1997;9:70-5.[35] Yokel FY. Stability and load capacity of members with no tensile strength. J Struct Div. 1971;97:1913-26.[36] Dawe JL, Liu Y. Analytical modeling of masonry load-bearing walls. Can J Civil Eng. 2003;30:795-806.[37] Lourenço PB. Analysis of masonry structures with interface elements. Theory and applications. TU-DELFT report no 03-21-22-0-011994. p. 34.[38] Salerno G, de Felice G. Continuum modeling of periodic brickwork. Int J Solids Struct. 2009;46:1251-67.[39] Martini K. Finite element studies in the two-way out-of-plane failure of unreinforced masonry. In: Institute EER, editor. Proceedings of the 6th National Conference on Earthquake Engineering. Seattle1998. p. 1-12.[40] Cecchi A, Sab K. A homogenized Reissner–Mindlin model for orthotropic periodic plates: Application to brickwork panels. Int J Solids Struct. 2007;44:6055-79.[41] Mercatoris BCN, Bouillard P, Massart TJ. Multi-scale detection of failure in planar masonry thin shells using computational homogenisation. Eng Fract Mech. 2009;76:479-99.
19
[42] Milani G, Lourenço PB, Tralli A. Homogenised limit analysis of masonry walls, Part II: Structural examples. Comput Struct. 2006;84:181-95.[43] Milani G, Lourenço PB, Tralli A. Homogenised limit analysis of masonry walls, Part I: Failure surfaces. Comput Struct. 2006;84:166-80.[44] Zucchini A, Lourenço PB. Homogenization of masonry using a micro-mechanical model: Compressive behaviour. In: Soares CAM, editor. III European Conference on Computational Mechanics Solids, Structures and Coupled Problems in Engineering. Lisbon, Portugal: ECCOMAS; 2006.[45] Reyes E, Casati M, Gálvez J. Experimental scale model study of cracking in brick masonry under tensile and shear stress. Mater Construcc. 2008;58:69-83.[46] Jager W, Bergander H. Comparison of buckling safety of masonry walls according to EC6 and German standards. Proc Br Mason Soc. 1998:279-83.[47] Lijdens A, Villegas L. Aspectos del diseño de muros portantes de fábrica simple según diferentes normas: excentricidades, reducción de la capacidad portante, e hipótesis de cargas a considerar. Rev Obras Pub. 1994;141:43-53.[48] 83 CAC. UNE-EN 1015-11:2000/A1:2007. Métodos de ensayo de los morteros para albañilería. Parte 11: Determinación de la resistencia a flexión y a compresión del mortero endurecido. Madrid: AENOR; 2007.[49] 41 CAC. UNE-EN 772-1:2002. Métodos de ensayo de piezas para fábrica de albañilería. Parte 1: Determinación de la resistencia a compresión. Madrid: AENOR; 2002.[50] 41 CAC. UNE-EN 772-11:2001/A1:2006. Métodos de ensayo de piezas para fábrica de albañilería. Parte 11: Determinación de la absorción de agua por capilaridad de piezas para fábrica de albañilería, en hormigón, piedra natural y artificial, y de la tas. Madrid: AENOR; 2006.[51] Brencich A, Corradi C, Gambarotta L. Eccentrically loaded brickwork: Theoretical and experimental results. Eng Struct. 2008;30:3629-43.[52] Brencich A, Felice GD. Brickwork under eccentric compression: Experimental results and macroscopic models. Constr Build Mater. 2009;23:1935-46.[53] Brencich A, Gambarotta L. Mechanical response of solid clay brickwork under eccentric loading. Part I: Unreinforced masonry. Mater Struct. 2005;38:257-66.[54] Attard M, Nappi A, Tin-Loi F. Modeling Fracture in Masonry. J Struct Eng. 2007;133:1385.[55] Brasile S, Casciaro R, Formica G. Multilevel approach for brick masonry walls – Part I: A numerical strategy for the nonlinear analysis. Comput Method Appl M. 2007;196:4934-51.[56] Brasile S, Casciaro R, Formica G. Multilevel approach for brick masonry walls – Part II: On the use of equivalent continua. Comput Method Appl M. 2007;196:4801-10.[57] Lourenço PB, Rots JG. Multisurface interface model for analysis of masonry structures. J Eng Mech. 1997;123:660-8.[58] Milani G, Lourenço PB, Tralli A. 3D homogenized limit analysis of masonry buildings under horizontal loads. Eng Struct. 2007;29:3134-48.[59] Alfano G, Crisfield MA. Finite Element Interface Models for the Delamination Anaylsis of Laminated Composites: Mechanical and Computational Issues. Int J Numer Method Eng. 2001;50:1701-36.[60] Pluijm R. Material properties of masonry and its components under tension and shear. In: Neis VV, editor. 6th Canadian Masonry Symposium. Saskatoon, Saskatchewan, Canada1992. p. 675-86.[61] Oliveira D. Mechanical characterization of stone and brick masonry. report 00-Dec/E-4, Universidade do Minho, Departamento de Engenharia Civil, Guimarães, Portugal. Guimarães, Portugal2000. p. 1-77.[62] Rosas Rodríguez JG, Villegas L, Lorenzo Esperante D. The numerical models front to the behaviour of masonry elements tested in laboratory. Informes Construcc. 2008;53.
20
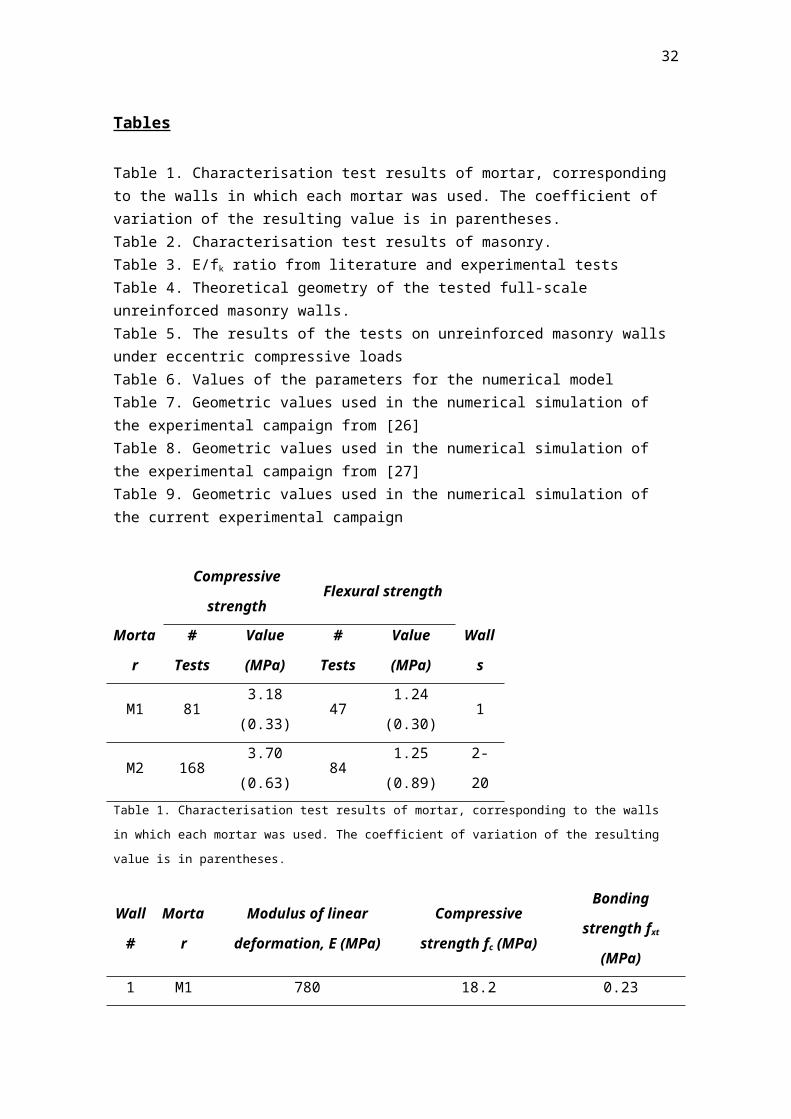
Tables
Table 1. Characterisation test results of mortar, corresponding to the walls in which each mortar was used. The coefficient of variation of the resulting value is in parentheses.Table 2. Characterisation test results of masonry.Table 3. E/fk ratio from literature and experimental testsTable 4. Theoretical geometry of the tested full-scale unreinforced masonry walls.Table 5. The results of the tests on unreinforced masonry walls under eccentric compressive loadsTable 6. Values of the parameters for the numerical modelTable 7. Geometric values used in the numerical simulation of the experimental campaign from [26]Table 8. Geometric values used in the numerical simulation of the experimental campaign from [27]Table 9. Geometric values used in the numerical simulation of the current experimental campaign
Compressive strength Flexural strength
Morta
r# Tests
Value
(MPa)# Tests
Value
(MPa)Walls
M1 81 3.18 (0.33) 47 1.24 (0.30) 1
M2 168 3.70 (0.63) 84 1.25 (0.89) 2-20
Table 1. Characterisation test results of mortar, corresponding to the walls in which each mortar was used. The
coefficient of variation of the resulting value is in parentheses.
Wall
#Mortar
Modulus of linear
deformation, E (MPa)
Compressive strength
fc (MPa)
Bonding strength
fxt (MPa)
1 M1
780
18.2 0.23
2-5
M2
12.9
0.366-9 13.7
10-20 10.8
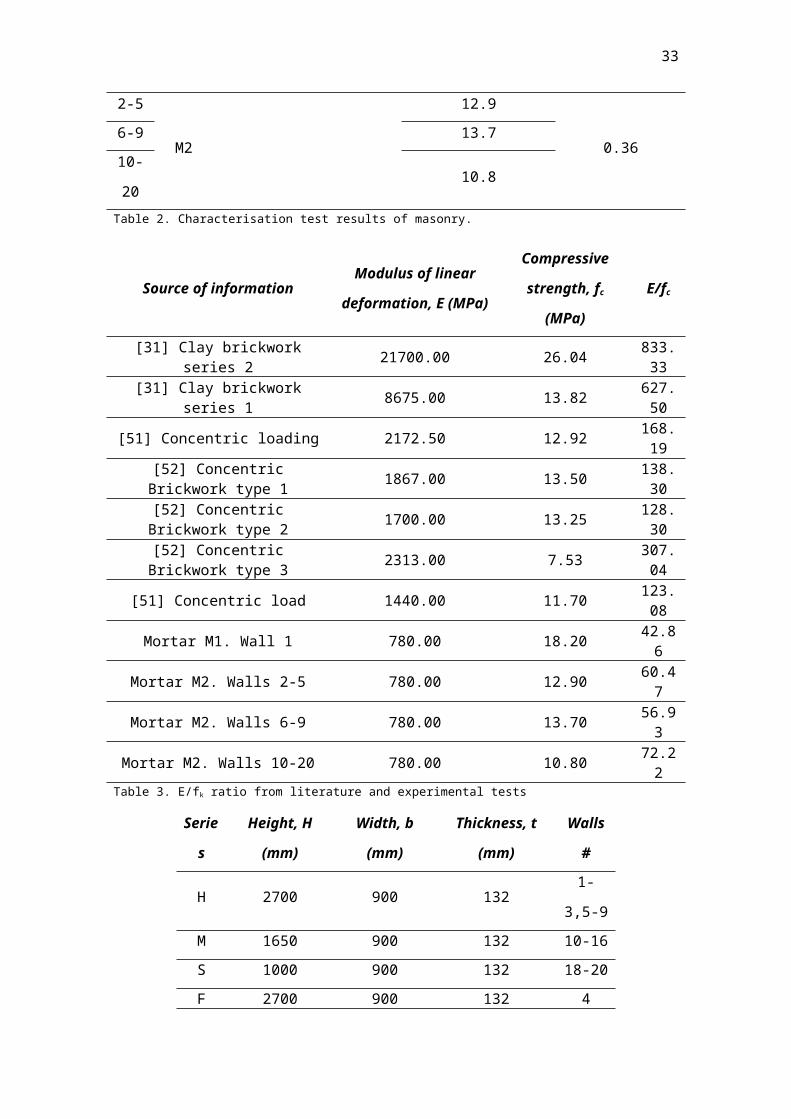
Table 2. Characterisation test results of masonry.
Source of informationModulus of linear
deformation, E (MPa)
Compressive
strength, fc (MPa)E/fc
[31] Clay brickwork series 2 21700.00 26.04 833.33[31] Clay brickwork series 1 8675.00 13.82 627.50
[51] Concentric loading 2172.50 12.92 168.19[52] Concentric Brickwork type 1 1867.00 13.50 138.30[52] Concentric Brickwork type 2 1700.00 13.25 128.30
Table 5. The results of the tests on unreinforced masonry walls under eccentric compressive loads
Case et (mm) eb (mm) em (mm) d (mm) Hef (m) t (mm) hrow aprox. (mm)
HB-10-0
0
0 0
0
1.15
93 73
HB-20-0 2.12
HB-30-0 2.98
HB-40-0 3.95
HB-10-1/6
15.5 -15.5
1.15
HB-20-1/6 2.12
HB-30-1/6 2.98
HB-40-1/6 3.95
HB-10-1/3
31.0 -31.0
1.15
HB-20-1/3 2.12
HB-30-1/3 2.98
HB-40-1/3 3.95Table 6. Geometric values used in the numerical simulation of the experimental campaign from [26]
Case et (mm) eb (mm) em (mm) d (mm) Hef (m) t (mm) hrow aprox. (mm)
5.6-0
0 0 0
0
0.635
115 105
11.1-0 1.25
18.8-0 2.12
27.7-0 3.12
5.6-1/8
14.4 14.4 14.4
0.63511.1-1/8 1.25
18.8-1/8 2.12
27.7-1/8 3.12
5.6-1/4
28.8 28.8 28.8
0.63511.1-1/4 1.25
18.8-1/4 2.12
27.7-1/4 3.12
5.6-1/3
38.3 38.3 38.3
0.63511.1-1/3
1.25
18.8- 2.12
23
1/327.7-1/3 3.12
Table 7. Geometric values used in the numerical simulation of the experimental campaign from [27]
Case et (mm) eb (mm) em (mm) d (mm) Hef (m) t (mm) hrow aprox. (mm)
W#1 20 20 5.6 0.0 2.95
132
60
W#2 20 20 19.6 0.0 2.93
W#3 10 10 1.2 10.0 2.92
W#4 0 0 0 6.5 1.98
W#5 5 5 7.0 7.0 2.92
W#6 25 25 33.7 -12.5 2.86
W#7 10 10 13.1 -6.0 2.87
W#8 10 10 -7.6 8.0 2.94
W#9 5 5 21.5 -8.5 2.89W#1
0 10 10 0.2 10.5 1.87
W#11 20 20 13.9 10.0 1.89
W#12 10 10 1.6 5.0 1.84
W#13 30 30 31.8 2.0 1.86
W#14 20 20 21.2 0.0 1.86
W#15 30 30 29.0 3.0 1.85
W#16 20 20 19.5 -3.0 1.86
W#17 80 80 88.0 12.0 1.91 282
W#18 20 20 20.8 3.0 1.20
132W#19 30 30 30.3 0.0 1.22
W#20 30 30 33.0 3.0 1.22
Table 8. Geometric values used in the numerical simulation of the current experimental campaign
Experimental reference E (MPa) fc (MPa) υ fxt (MPa) GfI (N/m)
[26] 25400 44.810.3
2.98 110
[27] 8540 12.2 0.3 7
W#1 780 18.2 0.35 0.23 8
W#2, W#3 and W#5 12.9 0.36 13W#6-W#9 13.7
24
W#10-W#16 and W#18-W#20 10.8
Table 9. Values of the parameters for the numerical model
25
Figures
Figure 1. Test setup a) for walls from series S, b) for walls from series M and c) for walls from series HFigure 2. Detail of the connection between the wall and the test system at the lower end (left) and the upper end (right)Figure 3. Test configuration for the presented campaign (a), the campaign from [27] (b) and the campaign from [26] (c); geometric definition for the presented campaign (d), the campaign from [27] (e) and the campaign from [26] (f); model used for the simulation of the walls from for the presented campaign (g), the campaign from [27] (h) and the campaign from [26] (i).Figure 4. Failure mode of wall W#10. Opening of a joint and mechanism formationFigure 5. Failure mode of wall W#14. Crushing of the compressed side mixed with the tensile opening of two joints to form a mechanismFigure 6. Experimental relationship between eccentricity and load-bearing capacity for three different theoretical values of slenderness corresponding to wall geometries H, M and S.Figure 7. Experimental relationship between downward displacement at maximum load and load-bearing capacity for three different theoretical values of slenderness corresponding to wall geometries H, M and S.Figure 8. Experimental relationship between actual eccentricity (not taking into account hinge alignment) and the descending vertical displacement at maximum load for three different theoretical values of slenderness corresponding to wall geometries H, M and S.Figure 9. Comparison of the experimental results of [26] with the numerical simulation and application of the standard codesFigure 10. Comparison of the experimental results of [27] with the numerical simulation and application of the standard codesFigure 11. Comparison of the experimental results of H-series walls with the numerical simulation and application of the standard codesFigure 12. Comparison of the experimental results of M-series walls with the numerical simulation and application of the standard codesFigure 13. Comparison of the experimental results of S-series walls with the numerical simulation and application of the standard codes
26
Figure 1. Test setup a) for walls from series S, b) for walls from series M and c) for walls from series H
Figure 2. Detail of the connection between the wall and the test system at the lower end (left) and the upper end (right)
27
Figure 3. Test configuration for the presented campaign (a), the campaign from [27] (b) and the campaign from [26] (c); geometric definition for the presented campaign (d), the campaign from [27] (e) and the campaign from [26] (f); model used for the simulation of the walls from for the presented campaign (g), the campaign from [27] (h) and the campaign from [26] (i).
28
Figure 4. Failure mode of wall W#10. Opening of a joint and mechanism formation
Figure 5. Failure mode of wall W#14. Crushing of the compressed side mixed with the tensile opening of two joints
to form a mechanism
29
Figure 6. Experimental relationship between eccentricity and load-bearing capacity for three different theoretical
values of slenderness corresponding to wall geometries H, M and S.
Figure 7. Experimental relationship between downward displacement at maximum load and load-bearing capacity
for three different theoretical values of slenderness corresponding to wall geometries H, M and S.
30
Figure 8. Experimental relationship between actual eccentricity (not taking into account hinge alignment) and the
descending vertical displacement at maximum load for three different theoretical values of slenderness
corresponding to wall geometries H, M and S.
31
Figure 9. Comparison of the experimental results of [26] with the numerical simulation and application of the
standard codes
Figure 10. Comparison of the experimental results of [27] with the numerical simulation and application of the
standard codes
32
Figure 11. Comparison of the experimental results of H-series walls with the numerical simulation and application of
the standard codes
Figure 12. Comparison of the experimental results of M-series walls with the numerical simulation and application
of the standard codes
33
Figure 13. Comparison of the experimental results of S-series walls with the numerical simulation and application of