A Paper-Based Multiplexed Resonance Energy Transfer Nucleic Acid Hybridization Assay Using a Single Form of Upconversion Nanoparticle as Donor and Three Quantum Dots as Acceptors Samer Doughan, Uvaraj Uddayasankar, Aparna Peri, Ulrich J. Krull* Chemical Sensors Group, Department of Chemical and Physical Sciences, University of Toronto Mississauga, 3359 Mississauga Road, Mississauga, ON L5L 1C6, Canada *Author to whom correspondence should be addressed Email: [email protected]Tel: 1-905-828-5437 Abstract Monodisperse aqueous upconverting nanoparticles (UCNPs) were covalently immobilized on aldehyde modified cellulose paper via reductive amination to evaluate the multiplexing capacity of luminescence resonance energy transfer (LRET) between UCNPs and quantum dots (QDs). This is the first account of a multiplexed bioassay strategy that demonstrates the principle of use of a Abbreviations: Base Pair Mismatch (BPM), Cy3 (Indocarbocyanine), Fluorescence Resonance Energy Transfer (FRET), Fully complementary (FC), reduced L-glutathione (GSH), Luminescence Resonance Energy Transfer (LRET), Nanoparticle (NP), Oleic Acid (OA), o-phosphorylethanolamine (PEA), photomultiplier tube (PMT), tetramethylammonium hydroxide (TMAH), Upconverting Nanoparticle (UCNP). 1
Transcript
A Paper-Based Multiplexed Resonance Energy Transfer Nucleic Acid Hybridization Assay Using a Single Form of Upconversion Nanoparticle as Donor and Three Quantum Dots as Acceptors
Samer Doughan, Uvaraj Uddayasankar, Aparna Peri, Ulrich J. Krull*
Chemical Sensors Group, Department of Chemical and Physical Sciences, University of Toronto Mississauga, 3359 Mississauga Road, Mississauga, ON L5L 1C6, Canada
*Author to whom correspondence should be addressedEmail: [email protected]: 1-905-828-5437
Abstract
Monodisperse aqueous upconverting nanoparticles (UCNPs) were covalently immobilized on
aldehyde modified cellulose paper via reductive amination to evaluate the multiplexing capacity
of luminescence resonance energy transfer (LRET) between UCNPs and quantum dots (QDs).
This is the first account of a multiplexed bioassay strategy that demonstrates the principle of use
of a single form of UCNP as donor and three different color emitting QDs as acceptors to
concurrently determine three analytes. Broad absorbance profiles of green, orange and red QDs
that spanned from the first exciton absorption peak to the UV region were in overlap with a blue
emission band from UCNPs composed of NaYF4 that was doped with 30% Yb3+, 0.5% Tm3+,
allowing for LRET that was stimulated using 980 nm near-infrared radiation. The characteristic
narrow and well-defined emission peaks of UCNPs and QDs allowed for the collection of
luminescence from each nanoparticle using a band-pass optical filter and an epi-fluorescence
microscope. The LRET system was used for the concurrent detection of uidA, Stx1A and tetA
Abbreviations: Base Pair Mismatch (BPM), Cy3 (Indocarbocyanine), Fluorescence Resonance Energy Transfer (FRET), Fully complementary (FC), reduced L-glutathione (GSH), Luminescence Resonance Energy Transfer (LRET), Nanoparticle (NP), Oleic Acid (OA), o-phosphorylethanolamine (PEA), photomultiplier tube (PMT), tetramethylammonium hydroxide (TMAH), Upconverting Nanoparticle (UCNP). 1
3.1 UCNP Synthesis, Ligand Exchange and Immobilization
11
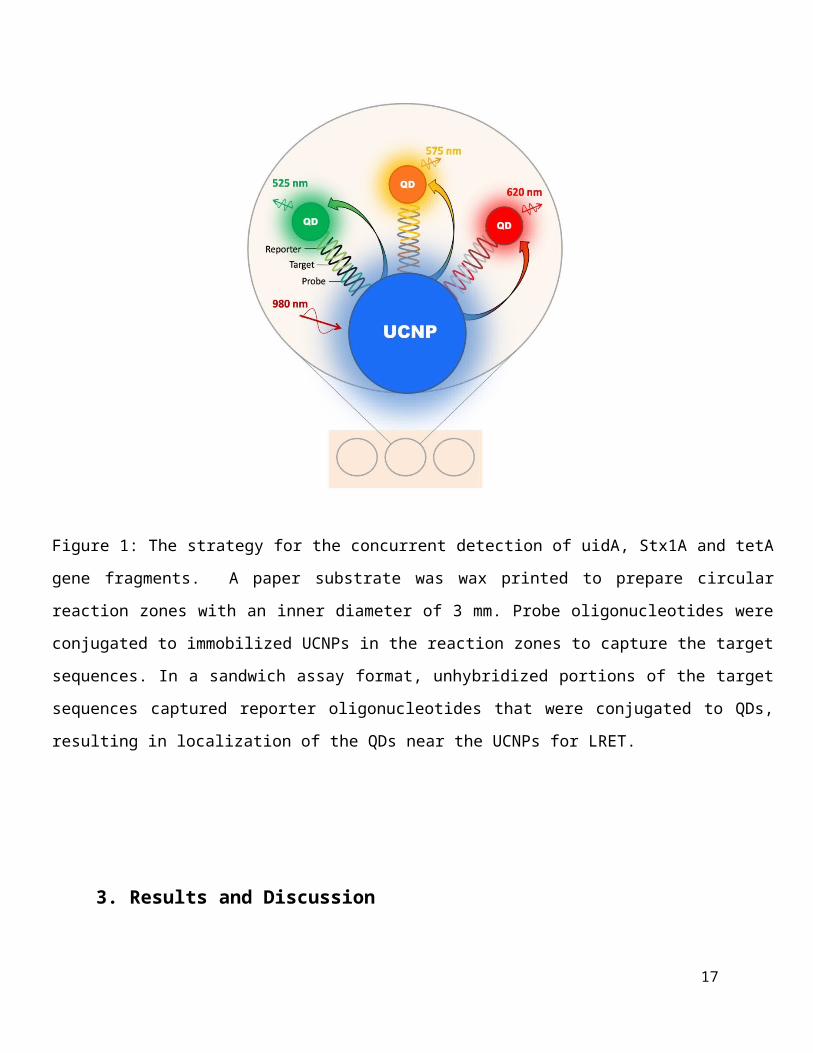
Figure 1: The strategy for the concurrent detection of uidA, Stx1A and tetA gene fragments. A paper substrate
was wax printed to prepare circular reaction zones with an inner diameter of 3 mm. Probe oligonucleotides were
conjugated to immobilized UCNPs in the reaction zones to capture the target sequences. In a sandwich assay
format, unhybridized portions of the target sequences captured reporter oligonucleotides that were conjugated to
QDs, resulting in localization of the QDs near the UCNPs for LRET.
NaYF4: 0.5% Tm3+, 30% Yb3+/NaYF4 core/shell UCNPs were synthesized using the seeded
growth method [29]. An inert shell was added to minimize quenching of dopant ions near the
surface of the core. The TEM image in Figure S1 shows monodisperse OA capped core UCNPs
that are hexagonal in shape, with an average diameter of 20.5 ± 5.6 nm based on 181
nanoparticles. Dynamic Light Scattering results shown in Figures S2 andS3 indicate a 2.3 ± 0.9
nm increase in diameter upon the addition an inert NaYF4 shell. The OA capped UCNPs were
made water soluble via ligand exchange with PEA. The TEM image in Figure S4 shows
monodisperse PEA-UCNPs. The phosphate groups of PEA coordinate strongly to the UCNP
surface leaving amine groups available for conjugation [30, 34].
The PEA capped UCNPs were covalently immobilized on aldehyde functionalized paper via
reductive amination with sodium cyanoborohydride in situ. We have previously reported the
reproducibility of this immobilization technique, which had a standard deviation based on
luminescence measurements of about 8% for 5 interaction zones [18]. Biotin-PEG4-NHS was
used to decorate the immobilized UCNPs for subsequent modification with avidin. The avidin
served to capture the biotinylated uidA, Stx1A and tetA probes. While the distance separation
between a donor NP and an acceptor is typically measured from the center of the NP, it is
measured from the surface of UCNPs due to the presence of lanthanides throughout the host
lattice. This minimizes the decrease in the LRET efficiency as the use of avidin increases the
separation distance between the donor and acceptor. The paper was then treated with a
concentrated solution of non-complementary DNA to minimize any subsequent non-specific
adsorption of oligonucleotides onto the paper and the UCNPs.
3.2 Characterization of QD-DNA Conjugates
12
Previous studies have shown that the hybridization kinetics of reporter nucleic acids that are
conjugated to QDs with target nucleic acids are independent of the number of immobilized
reporters on the QDs[18]. Herein, we incubate the QDs with only 5-fold molar excess of reporter
DNA. Hexahistidine functionalized uidA, Stx1A and tetA reporter DNA sequences were
conjugated to 525 nm, 575 nm and 620 nm GSH coated QDs, respectively. The QDs were then
incubated with excess hexahistidine-modified PEG to prevent non-specific adsorption of QDs on
the paper [18].
The gel image in Figure S6 compares the electrophoretic mobility of GSH QDs, PEG coated
QDs and DNA conjugated PEG stabilized QDs for 525, 575 and 620 nm QDs. The high
electrophoretic mobility of the GSH QDs is attributed to the carboxylate anions present on the
surface of the QDs. Neutral PEG molecules provide no mechanism for migration of QDs, while
the PEG stabilized QDs that are conjugated to reporter oligonucleotides show a slight
electrophoretic mobility due to negative charges associated with the phosphate backbone of
nucleic acids.
3.3 Enhancement in LRET Ratio in Dry Paper
Noor et. al reported up to a 10 fold enhancement in FRET ratio between green QD donors and
Cy3 acceptors in dry paper compared to hydrated paper [25]. The enhancement was attributed to
the contraction of wet paper upon drying that brings donors and acceptors in closer proximity.
Herein, dried paper offered a maximum 12-fold enhancement in LRET ratio between blue
emitting UCNP donors and green emitting QD acceptors, and an order of magnitude
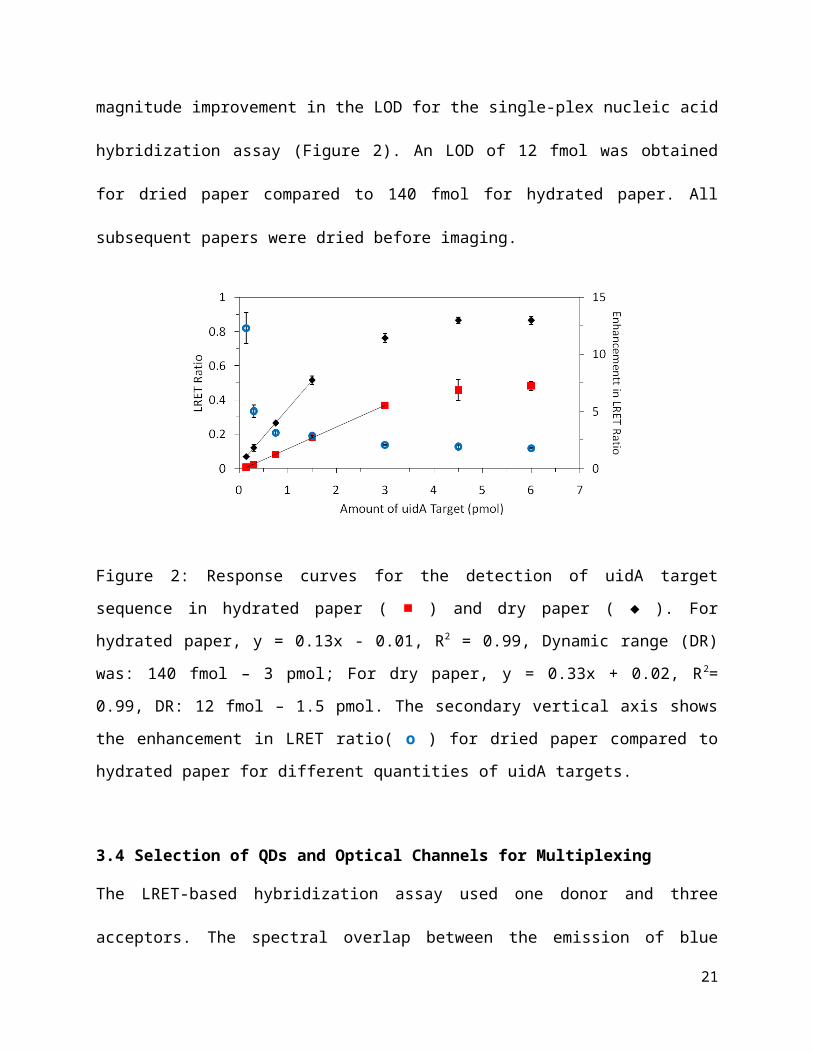
improvement in the LOD for the single-plex nucleic acid hybridization assay (Figure 2). An
13
LOD of 12 fmol was obtained for dried paper compared to 140 fmol for hydrated paper. All
subsequent papers were dried before imaging.
Figure 2: Response curves for the detection of uidA target sequence in hydrated paper ( ■ ) and
dry paper ( ♦ ). For hydrated paper, y = 0.13x - 0.01, R2 = 0.99, Dynamic range (DR) was: 140
fmol – 3 pmol; For dry paper, y = 0.33x + 0.02, R2= 0.99, DR: 12 fmol – 1.5 pmol. The
secondary vertical axis shows the enhancement in LRET ratio( o ) for dried paper compared to
hydrated paper for different quantities of uidA targets.
3.4 Selection of QDs and Optical Channels for Multiplexing
The LRET-based hybridization assay used one donor and three acceptors. The spectral overlap
between the emission of blue emitting UCNPs and the absorbance of different color emitting
QDs is shown in Figure 3. Four independent optical channels were created using band pass filters
in an epi-fluorescence microscope, and were used to collect the luminescence from the UCNPs,
and the green, orange and red QDs. Filters with band pass of 420-490, 535-545, 565-585 and
615-625 nm were used to define the blue, green, orange and red optical channels, respectively.
Figure 4 shows an overlay of the normalized transmittance profiles of all the bandpass filters and
the normalized emission profiles of the QDs and UCNP.
14
Figure 3: Spectral overlap between the emission of NaYF4: 0.5% Tm3+, 30% Yb3+/NaYF4 core/shell UCNPs and absorbance of green, orange and red emitting QDs.
Figure 4: An overlay of UCNP emission (full blue) and green (full green), orange (full orange) and red (full red) QD emission. The dotted lines of respective colours show the transmittance of the band-pass filters used to collect luminescence from each NP.
15
The photomultiplier tube (PMT) gain was adjusted to improve contrast of the different optical
channels. For example, the gain in the orange channel was reduced to minimize background
signals from the green QDs, as seen in Figure S7. Figure 5 shows the LRET ratios obtained for
the independent detection of each target sequence with concentrations ranging from 30 fmol to 6
pmol. The LRET ratio is defined as the ratio of the signal of one colour QD to that of the UCNP
in the same spot. A definitive response curve in an optical channel was observed only when the
16
Figure 5: Response curves from the (a) green, (b) orange and (c) red optical channels for the
independent detection of uidA (i), Stx1A (ii) and tetA (iii) target sequence. For the selective
hybridization reactions: a(i) had a linear response described by y = 0.54x + 0.04, R2 = 0.99, DR: 10
fmol – 1.5 pmol; the b(ii) response was y = 0.27x + 0.04, R2= 0.99, DR: 50 fmol – 1.5 pmol; the
c(iii) response was y = 0.14x + 0.03, R2 = 0.99, DR: 65 fmol – 1.5 pmol
overhang of the DNA target was complementary to the reporter nucleic acids on the
corresponding QD. The reporter labelled QDs that did not correspond to the target were not
retained and the signals obtained in the respective optical channels were within the noise. The
limit of detection of uidA, Stx1A, and tetA gene fragments were 10 fmol, 50 fmol and 65 fmol,
respectively, calculated as three standard deviations above the LRET ratio in the presence of
non-complementary target and QD reporters. We note that the three target gene fragments used
to demonstrate the principles of operation of the detection strategy are relatively short
oligonucleotides. The question as to whether longer oligonucleotide targets can be quantitatively
determined by resonance energy transfer using hybridization of probes on nanoparticles was
previously investigated by our team, and functionality with sequences of lengths that are relevant
to PCR products (~150mer lengths) was achieved using quantum dots [35].
3.5 Multiplexed Hybridization Assays
Calibration curves were obtained for the simultaneous detection of equimolar amounts of uidA,
Stx1A and tetA targets. We previously reported the use of 2 µM QD-reporter conjugates for the
detection of HPRT1 target and demonstrated that the response curve is governed by the QD
concentration [18]. The limit of linearity was constrained by the concentration of QDs. Since our
previously reported single-plex assay showed an increase in LRET ratio with an increasing
concentration of QD reporter solution up to 2 µM, each QD reporter concentration herein was
kept at 0.5 µM, with a total concentration of 1.5 µM to ensure ample space for the QD reporter to
hybridize to target strands on the surface of UCNPs. The response curves obtained for each
target in the multiplexed assay were compared to their respective response curves in the single-
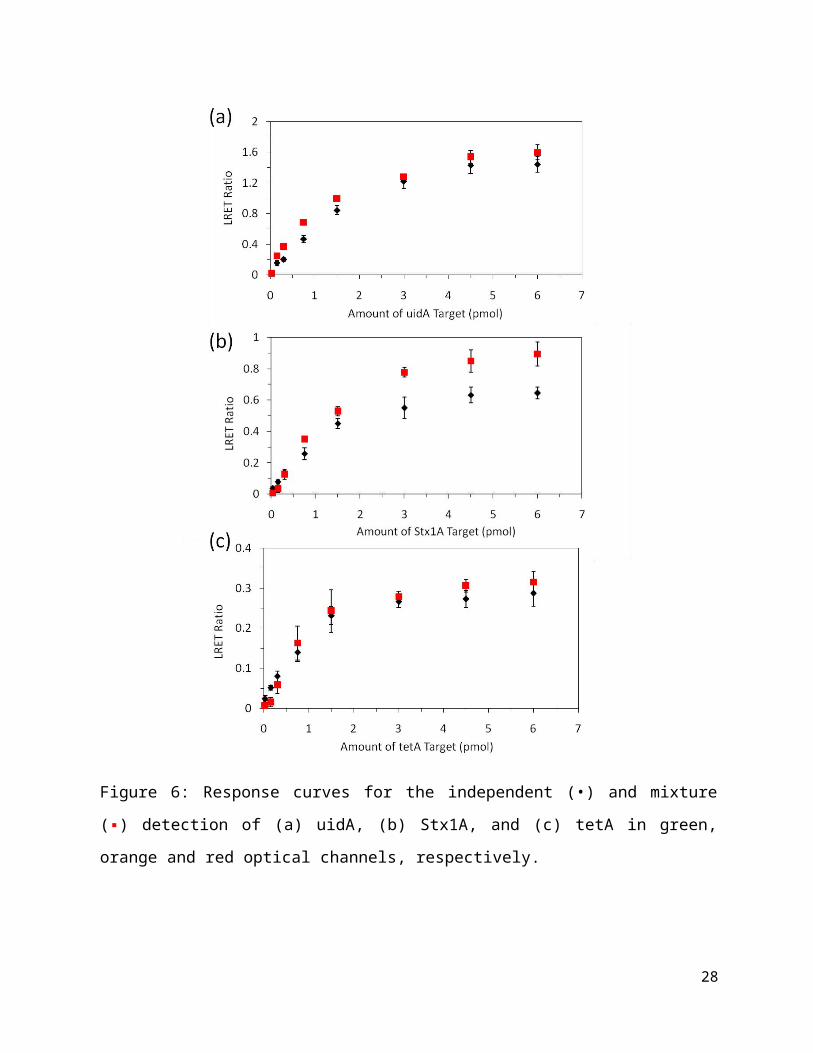
plex assay. Figure 6 shows a slight increase in the LRET ratio in the multiplexing format
compared to single-plex detection. The increase in the LRET response is due to the decrease in
17
UCNP luminescence in the presence of more QD acceptors in the multiplex format, as shown in
Figure S8. Limits of detection for uidA, Stx1A and tetA gene fragments were calculated to be 26
fmol, 62 fmol and 78 fmol, respectively. To avoid the change in LRET response in the multiplex
format, large UCNPs can be used to provide constant background reference emission as there
will always be a substantial amount of signal in the core of the UCNPs that cannot participate in
LRET. Figure 7 compares the kinetics of hybridization for each QD reporter in the single-plex
and the three-plex format showing no change in kinetics within one standard deviation. By
immobilizing a large number of DNA probes and maintaining a low QD concentration, no
change in kinetics was observed. Only 0.5 µM of each colour QD was used herein, whereas 8-10
µM of reporter is typically used in bioassays that rely on organic fluorophores as acceptors [17,
33].
18
19
Figure 6: Response curves for the independent (•) and mixture (▪) detection of (a) uidA, (b)
Stx1A, and (c) tetA in green, orange and red optical channels, respectively.
3.6 Hybridization Assays in a Complex Matrix:
The sensitivity of the triplex assay in 10% goat serum was minimally impacted by this more
complex matrix (Figure 8). Assays in 10% serum achieved limits of detection of 52, 56 and 76
fmol for uidA, Stx1A and tetA targets, respectively. This compares to limits of detection of 26,
62 and 78 fmol, respectively, in buffer. The differences in the limits of detection are within a
factor of 2 or less, and this similarity in performance is attributed to the use of NHS-PEG4-biotin
and random DNA as antifouling agents to passivate the surface of the immobilized UCNPs. The
selectivity of the assay was evaluated in 10% goat serum (Figure 9), and contrast ratios of the
20
Figure 7: Kinetic curves for the hybridization of (a) green, (b) orange and (c) red QD reporters, collected
for independent targets(•) and for targets in mixture (▪). Figure (d) shows an overlay of the kinetic curves
for all three reporters in concurrent detection, green QD (•), orange QD (◊) and red QD (▪).
LRET ratios for the FC uidA target to 1 BPM uidA target in the presence of FC Stx1A and tetA
targets were 3.5:1 and 40:1 with 0% and 5% formamide in the wash buffer, respectively. There
was no difference in the detection of FC Stx1A or tetA targets in the presence of FC or 1 BPM
uidA target. This selectivity is superior to a previously reported two-plex assay using UCNPs as
donors and molecular dyes as acceptor in a direct hybridization assay, where a contrast ratio of
only 2.16 was achieved with 20% formamide [13]. In a similar single-plex sandwhich format
hybridization assay, a contrast ratio of only 1.81 was achieved with 20% formamide in buffer.
The improvement in selectivity is attributed to the decoration of the QDs with PEG to minimize
non-specific adsorption on the surface of the paper[18].
Figure 8: Response curves for the simultaneous detection of (a) uidA, y = 0.33x + 0.02, R2 =
(c) tetA, y = 0.08x + 0.02, R2 = 0.98, DR: 76 fmol – 3 pmol, in 10% goat serum.
21
Figure 9: Assays demonstrating the selectivity response.(i) 6 pmol FC uidA (dark) and 1 BPM
uidA (light);(ii) 6 pmol FC Stx1A,and (iii) 6 pmol FC tetA, in (a) 0% and (b) 5% formamide.
22
4. Conclusion:
We have demonstrated a LRET-based assay for the concurrent determination of three nucleic
acid targets using a single form of UCNP as donor and QDs as acceptors. All three of the
different color QDs had broad absorption profiles in the blue region of the spectrum and their
fluorescence was excited by blue emitting UCNPs. Both UCNPs and QDs have narrow and well
defined emission profiles, allowing for QD emission peaks to be resolved for multiplexing.
Independent optical channels were established using band pass filters to collect fluorescence
from green, orange and red emitting QDs, as well as the blue emission band of the UCNPs. The
assays had limits of detection of 26 fmol, 62 fmol and 78 fmol in buffer for the concurrent
detection of uidA, Stx1A and tetA targets, respectively. The limits of detection were comparable
in 10% goat serum. A contrast ratio derived from the signal for fully complementary FC uidA in
comparison to 1 BPM target was 40:1 when stringency was controlled using formamide,
demonstrating the selectivity of the assay. The triplexed assay demonstrated an order of
magnitude improvement in LOD and superior selectivity compared to the duplex detection of
DNA using UCNPs as donors and dyes as acceptors. This was achieved by coating the QDs with
PEG to annihilate non-specific adsorption on paper.
Supporting Information. Reagents, instrumentation, characterization of upconverting
nanoparticles and quantum dot-DNA conjugates, and additional results.
23
Acknowledgements:
We thank Dr. Sreekumari Nair for obtaining TEM images. We gratefully acknowledge the
Natural Sciences and Engineering Research Council of Canada (NSERC) for financial support of
this research. S.D. and U. U are thankful to NSERC for graduate fellowships.
References:
[1] M.V. DaCosta, S. Doughan, Y. Han, U.J. Krull, Lanthanide upconversion nanoparticles and applications in bioassays and bioimaging: A review, Anal. Chim. Acta, 832 (2014) 1-33.[2] M. Wang, G. Abbineni, A. Clevenger, C.B. Mao, S.K. Xu, Upconversion nanoparticles: synthesis, surface modification and biological applications, Nanomed. Nanotech. Biol. Med., 7 (2011) 710-729.[3] A. Sedlmeier, H.H. Gorris, Surface modification and characterization of photon-upconverting nanoparticles for bioanalytical applications, Chem. Soc. Rev., 44 (2015) 1526-1560.[4] H.H. Gorris, O.S. Wolfbeis, Photon-Upconverting Nanoparticles for Optical Encoding and Multiplexing of Cells, Biomolecules, and Microspheres, Angew. Chem. Int. Ed., 52 (2013) 3584-3600.[5] N. Duan, S.J. Wu, C.Q. Zhu, X.Y. Ma, Z.P. Wang, Y. Yu, Y. Jiang, Dual-color upconversion fluorescence and aptamer-functionalized magnetic nanoparticles-based bioassay for the simultaneous detection of Salmonella Typhimurium and Staphylococcus aureus, Anal. Chim. Acta, 723 (2012) 1-6.[6] Q.Q. Dou, N.M. Idris, Y. Zhang, Sandwich-structured upconversion nanoparticles with tunable color for multiplexed cell labeling, Biomaterials, 34 (2013) 1722-1731.[7] S.J. Wu, N. Duan, X.Y. Ma, Y. Xia, Y. Yu, Z.P. Wang, H.X. Wang, Simultaneous detection of enterovirus 71 and coxsackievirus A16 using dual-colour upconversion luminescent nanoparticles as labels, Chem. Comm., 48 (2012) 4866-4868.[8] M.Z. Zhang, W.J. Chen, X. Chen, Y.J. Zhang, X.J. Lin, Z.Y. Wu, M.F. Li, Multiplex Immunoassays of Plant Viruses Based on Functionalized Upconversion Nanoparticles Coupled with Immunomagnetic Separation, J. Nanomater., (2013) 317437.[9] O. Ehlert, R. Thomann, M. Darbandi, T. Nann, A four-color colloidal multiplexing nanoparticle system, ACS Nano, 2 (2008) 120-124.[10] S.J. Wu, N. Duan, Z. Shi, C.C. Fang, Z.P. Wang, Simultaneous Aptasensor for Multiplex Pathogenic Bacteria Detection Based on Multicolor Upconversion Nanoparticles Labels, Anal. Chem., 86 (2014) 3100-3107.[11] S.J. Wu, N. Duan, Z. Shi, C.C. Fang, Z.P. Wang, Dual fluorescence resonance energy transfer assay between tunable upconversion nanoparticles and controlled gold nanoparticles for the simultaneous detection of Pb2+ and Hg2+, Talanta, 128 (2014) 327-336.
24
[12] T. Rantanen, M.L. Jarvenpaa, J. Vuojola, R. Arppe, K. Kuningas, T. Soukka, Upconverting phosphors in a dual-parameter LRET-based hybridization assay, Analyst, 134 (2009) 1713-1716.[13] F. Zhou, U.J. Krull, Spectrally Matched Duplexed Nucleic Acid Bioassay Using Two-Colors from a Single Form of Upconversion Nanoparticle, Anal. Chem., 86 (2014) 10932-10939.[14] M.O. Noor, E. Petryayeva, A.J. Tavares, U. Uddayasankar, W.R. Algar, U.J. Krull, Building from the "Ground" Up: Developing interfacial chemistry for solid-phase nucleic acid hybridization assays based on quantum dots and fluorescence resonance energy transfer, Coord. Chem. Rev., 263 (2014) 25-52.[15] M.Y. He, Z.H. Liu, Paper-Based Microfluidic Device with Upconversion Fluorescence Assay, Anal. Chem., 85 (2013) 11691-11694.[16] M.Y. He, Z. Li, Y.Y. Ge, Z.H. Liu, Portable Upconversion Nanoparticles-Based Paper Device for Field Testing of Drug Abuse, Anal. Chem., 88 (2016) 1530-1534.[17] F. Zhou, M.O. Noor, U.J. Krull, A Paper-Based Sandwich Format Hybridization Assay for Unlabeled Nucleic Acid Detection Using Upconversion Nanoparticles as Energy Donors in Luminescence Resonance Energy Transfer, Nanomaterials, 5 (2015) 1556-1570.[18] S. Doughan, U. Uddayasankar, U.J. Krull, A paper-based resonance energy transfer nucleic acid hybridization assay using upconversion nanoparticles as donors and quantum dots as acceptors, Anal. Chim. Acta, 878 (2015) 1-8.[19] W.R. Algar, U.J. Krull, Developing Mixed Films of Immobilized Oligonucleotides and Quantum Dots for the Multiplexed Detection of Nucleic Acid Hybridization Using a Combination of Fluorescence Resonance Energy Transfer and Direct Excitation of Fluorescence, Langmuir, 26 (2010) 6041-6047.[20] W.R. Algar, U.J. Krull, FRET-Based Solid-Phase Three-Color and Four Color Hybridization Assays Using Mixed Films and Quantum Dots and Oligonucleotides, Mater. Res. Soc. Symp. P., (2010) 45-55.[21] L. Mattsson, K.D. Wegner, N. Hildebrandt, T. Soukka, Upconverting nanoparticle to quantum dot FRET for homogeneous double-nano biosensors, RSC Adv., 5 (2015) 13270-13277.[22] A. Bednarkiewicz, M. Nyk, M. Samoc, W. Strek, Up-conversion FRET from Er3+/Yb3+:NaYF4 Nanophosphor to CdSe Quantum Dots, J. Phys. Chem. C, 114 (2010) 17535-17541.[23] L.J. Charbonniere, N. Hildebrandt, R.F. Ziessel, H.G. Loehmannsroeben, Lanthanides to quantum dots resonance energy transfer in time-resolved fluoro-immunoassays and luminescence microscopy, J. Am. Chem. Soc., 128 (2006) 12800-12809.[24] D. Geissler, S. Linden, K. Liermann, K.D. Wegner, L.J. Charbonniere, N. Hildebrandt, Lanthanides and Quantum Dots as Forster Resonance Energy Transfer Agents for Diagnostics and Cellular Imaging, Inorg. Chem., 53 (2014) 1824-1838.[25] M.O. Noor, U.J. Krull, Camera-Based Ratiometric Fluorescence Transduction of Nucleic Acid Hybridization with Reagentless Signal Amplification on a Paper-Based Platform Using Immobilized Quantum Dots as Donors, Anal. Chem., 86 (2014) 10331-10339.[26] J.L. Alonso, K. Soriano, I. Amoros, M.A. Ferrus, Quantitative determination of E-coli and fecal coliforms in water using a chromogenic medium, J. Environ. Sci. Health A Tox. Hazard Subst. Environ. Eng., 33 (1998) 1229-1248.[27] M.D. Gray, K.A. Lampel, N.A. Strockbine, R.E. Fernandez, A.R. Melton-Celsa, A.T. Maurelli, Clinical Isolates of Shiga Toxin 1a-Producing Shigella flexneri with an Epidemiological Link to Recent Travel to Hispaniola, Emerg. Infect. Dis., 20 (2014) 1669-1677.
25
[28] W. Hillen, C. Berens, Mechanisms Underlying Expression Of Tn10 Encoded Tetracycline Resistance, Annu. Rev. Microbiol., 48 (1994) 345-369.[29] H.S. Qian, Y. Zhang, Synthesis of Hexagonal-Phase Core-Shell NaYF4 Nanocrystals with Tunable Upconversion Fluorescence, Langmuir, 24 (2008) 12123-12125.[30] S. Doughan, Y. Han, U. Uddayasankar, U.J. Krull, Solid-Phase Covalent Immobilization of Upconverting Nanoparticles for Biosensing by Luminescence Resonance Energy Transfer, ACS Appl. Mater. Interfaces, 6 (2014) 14061-14068.[31] I.L. Medintz, L. Berti, T. Pons, A.F. Grimes, D.S. English, A. Alessandrini, P. Facci, H. Mattoussi, A reactive peptidic linker for self-assembling hybrid quantum dot-DNA bioconjugates, Nano Lett., 7 (2007) 1741-1748.[32] U. Uddayasankar, Z.F. Zhang, R.T. Shergill, C.C. Gradinaru, U.J. Krull, Isolation of Monovalent Quantum Dot-Nucleic Acid Conjugates Using Magnetic Beads, Bioconjug. Chem., 25 (2014) 1342-1350.[33] M.O. Noor, U.J. Krull, Paper-Based Solid-Phase Multiplexed Nucleic Acid Hybridization Assay with Tunable Dynamic Range Using Immobilized Quantum Dots As Donors in Fluorescence Resonance Energy Transfer, Anal. Chem., 85 (2013) 7502-7511.[34] J.C. Boyer, M.P. Manseau, J.I. Murray, F. van Veggel, Surface Modification of Upconverting NaYF4 Nanoparticles with PEG-Phosphate Ligands for NIR (800 nm) Biolabeling within the Biological Window, Langmuir, 26 (2010) 1157-1164.[35] M.O. Noor, D. Hrovat, M. Moazami-Goudarzi, G.S. Espie and U.J. Krull, Ratiometric fluorescence transduction by hybridization after isothermal amplification for determination of zeptomole quantities of oligonucleotide biomarkers with a paper-based platform and camera-based detection, Anal. Chim. Acta, 885 (2015) 156–165.
26
Figure Captions:
Figure 1: The strategy for the concurrent detection of uidA, Stx1A and tetA gene fragments. A
paper substrate was wax printed to prepare circular reaction zones with an inner diameter of 3
mm. Probe oligonucleotides were conjugated to immobilized UCNPs in the reaction zones to
capture the target sequences. In a sandwich assay format, unhybridized portions of the target
sequences captured reporter oligonucleotides that were conjugated to QDs, resulting in
localization of the QDs near the UCNPs for LRET.
Figure 2: Response curves for the detection of uidA target sequence in hydrated paper ( ■ ) and
dry paper ( ♦ ). For hydrated paper, y = 0.13x - 0.01, R2 = 0.99, Dynamic range (DR) was: 140
fmol – 3 pmol; For dry paper, y = 0.33x + 0.02, R2= 0.99, DR: 12 fmol – 1.5 pmol. The
secondary vertical axis shows the enhancement in LRET ratio( o ) for dried paper compared to
hydrated paper for different quantities of uidA targets.
Figure 3: Spectral overlap between the emission of NaYF4: 0.5% Tm3+, 30% Yb3+/NaYF4
core/shell UCNPs and absorbance of green, orange and red emitting QDs.
Figure 4: An overlay of UCNP emission (full blue) and green (full green), orange (full orange)
and red (full red) QD emission. The dotted lines of respective colours show the transmittance of
the band-pass filters used to collect luminescence from each NP.
Figure 5: Response curves from the (a) green, (b) orange and (c) red optical channels for the
independent detection of uidA (i), Stx1A (ii) and tetA (iii) target sequence. For the selective
hybridization reactions:a(i) had a linear response described by y = 0.54x + 0.04, R2 = 0.99, DR:
10 fmol – 1.5 pmol; the b(ii)response was y = 0.27x + 0.04, R2= 0.99, DR: 50 fmol – 1.5 pmol;
the c(iii) response was y = 0.14x + 0.03, R2 = 0.99, DR: 65 fmol – 1.5 pmol
Figure 6: Response curves for the independent (•) and mixture (▪) detection of (a) uidA, (b)
Stx1A, and (c) tetA in green, orange and red optical channels, respectively.
27
Figure 7: Kinetic curves for the hybridization of (a) green, (b) orange and (c) red QD reporters,
collected for independent targets(•) and for targets in mixture (▪). Figure (d) shows an overlay of
the kinetic curves for all three reporters in concurrent detection, green QD (•), orange QD (◊) and
red QD (▪).
Figure 8: Response curves for the simultaneous detection of (a) uidA, y = 0.33x + 0.02, R2 =