VISCOELASTICITY EVOLUTION OF ETHYLENE-VINYL-ACETATE COPOLYMERS DURING CRYSTALLIZATION
Claudia Carotenuto, Liana P. Paduano, Luigi Grassia, Mario MinaleUniversity of Campania “Luigi Vanvitelli”, Via Roma 29, 81031 Aversa (Caserta), [email protected]
In polymer processing as fibre spinning, injection moulding, film casting and so on, the forming phase of the melt is followed by its solidification due to cooling. This implies the crystallization of the polymer during the processing. Typically, crystallites are formed and an ordered structure can be detected, if the cooling rate is not too high. As a consequence, during processing the rheological response of the material significantly changes from a liquid-like to a solid-like behaviour. The knowledge of the mechanical response of the material during crystallization is therefore of seminal importance for process control and modelling. We here focus on a random copolymer, the Ethylene vinyl acetate (EVA), made of ethylene and varying amounts of vinyl acetate that interfere with poly-ethylene chain packing reducing the crystallinity, improving the transparency and lowering the melting temperature. This allows studying the crystallization kinetics at relatively low temperatures so to avoid all the experimental issues related to thermal degradation. The crystallization process is rheologically studied in non-isothermal conditions and the frequency spectra are measured at different temperatures to investigate the viscoelasticity of EVA during the change of phase. Coupling the crystallization kinetics and the viscoelastic spectra at different temperatures, i.e. at different degree of crystallinity, we determine two independent shift factors, one for the time-crystallinity shift, the other for the time-temperature shift, so to propose a new time-temperature-crystallinity superposition to reconcile all the data on a single master curve. In this way, the experimentally observable frequency range has been widen significantly so to detect all the relaxation times of the material from the shortest to the largest ones.
1. IntroductionThe process technologies of semi-crystalline polymers require a deep understanding of crystallization kinetics that determine performances and quality of the final products. Depending on the processing techniques (e.g., fiber spinning, injection moulding, film blowing, automated tape lay-up of thermoplastic based composites) semi-crystalline polymers are subjected to complex thermo-mechanical histories to obtain products where the crystalline content may vary from zero (a truly amorphous polymer) up to the maximum value of the used polymer (typically about 50-70%). The crystallization degree regulates not only the mechanical response of the material, but also the transport properties like the resistance to aggressive solvents and water sorption. In addition, crystallization significantly affects the process and, at the same time, processing conditions influence the crystallization kinetics (Haidin and Boyer, 2017). The knowledge of the mechanical response of the material during crystallization is therefore of seminal importance for process control and modelling. Attention was paid in the literature on this topic focusing on the isothermal crystallization of homopolymers, like, Pogodina and Winter (1998) and Coppola et al. (2006) who studied the polybutadiene (PB), or Lamberti et al. (2007) who focused on i-polypropilene (iPP). Coppola et al. (2006) argued that the strength of the solidified polymer is dictated by some intrinsic feature of the system, rather than by the chosen, specific physical crystallization conditions, such as temperature or polymer molecular weight. On the same line, Lamberti et al. (2007) proved a sort of crsytallinity-rheological simplicity showing that for iPP the same amount of crystallinity induces the same rheological hardening, regardless the crystallization was due to the formation of few large
crystallites or many small ones. The crystallinity-rheological simplicity can be stated assuming that a generic relaxation time, τ , scales with the degree of crystallinity, ξ , as follows
τ (ξ )=aξ (ξ0 , ξ ) τ (ξ0 ) (1)
where ξ0 is a reference degree of crystallization and aξ is a horizontal shift factor accounting for the degree of crystallization. The crystallinity-rheological simplicity resembles very much to the well known thermo-rheological one (Ferry, 1980). More recently, Pantani et al. (2015) slightly modified the time-crystallinity superposition principle, Eq(1), as they also applied vertical shifts to the storage and loss moduli, interpolated with a six modes Maxwell model (Ferry, 1980), by independently vertically shifting each mode. In this work, we show some preliminary results on a more general Time-Temperature-Crystallinity-Superposition (TTCS) for a polyethylene-vinyl-acetate copolymer. It states that the effects of temperature and crystallinity superimpose in such a way that a generic relaxation time scales with the temperature and crystallinity obeying the following rule
where T0 is a reference temperature and aT is a horizontal thermal shift factor. The postulated time-temperature-crystallinity-superposition, Eq.(2), is very promising and its general validity needs to be assessed.Polymer crystallization is typically investigated with DSC measurements (Martone et al., 2012) and in the literature (e.g., Pogodina and Winter, 1998), it is affirmed that the characteristic crystallization time estimated with DSC may be significantly different from that rheologically estimated, though a clear explanation for this is still lacking.We here focus on the study of the crystallization of a copolymer, Ethylene Vinyl Acetate (EVA) in non-isothermal conditions, which resemble the real processing conditions. We use an experimental procedure where the crystallization process is followed rheologically (Coppola et al., 2006). We extend the “use” and “advantage” of TTS to the case of a non-constant degree of crystallinity. To this end, we measured the frequency spectra of the EVA sample, in linear regime, at different temperatures, varying from 100 to 40°C, i.e. during the crystallization process. Coupling the crystallization kinetics and the viscoelastic spectra at different temperatures, i.e. at different degree of crystallinity, we here determine two independent shift factors, one for the time-crystallinity shift, the other for the time-temperature shift, that confirm the validity of the new time-temperature-crystallinity-superposition expressed by Eq.(2).
2. Materials and Experimental ProcedureEthylene vinyl acetate (EVA) is a copolymer of ethylene and varying amounts of vinyl acetate (VA). The similar reactivity ratios of ethylene and vinyl-acetate allow the monomers to polymerize over a wide range of compositions and, typically, the VA content varies between 1 wt.% and 42 wt.% (Behbahani et al., 2011). In addition, due to the similar reactivity, the obtained EVA can be considered to be statistically random copolymers whose composition is equal to the monomer feed composition (Arsac et al., 1999). Crystallinity, melting point, stiffness and polarity of the EVA is determined predominantly by the VA content and vary from crystallinity of about 50 - 60% and melting temperature range of 110–120 °C, at zero VA content, to a completely amorphous material with a broader melting point of approximately 40–60 °C, at 40 wt.% of VA (Zhang et al., 2002). The glass transition temperature occurs between −35 to −25 °C and it is essentially independent of the vinyl acetate content (Arsac et al., 2000).The copolymer EVA used in this work has a nominal VA content of 28wt.%. According to the manufacturer, the melting flow index (ISO 1133) is equal to 800 g/10min.Rheological tests are used to follow the crystallization kinetics of the copolymer, as rheology proved to be a very sensitive tool to investigate the evolution of the fluid microstructure, both in static (e.g., Carotenuto et al., 2015a, Minale et al., 2018) and dynamic conditions (e.g., Merola et al., 2016). All rheological tests are conducted with the rotational rheometer AR2000 (TA Instruments) equipped with a 25 mm diameter stainless steel plate/plate geometry and an electrical oven that controls the temperature with a precision of 0.1 °C. The crystallization is followed in oscillatory mode in the linear viscoelastic regime checking that no thermal degradation (Rosa et al. 2016), no flow instabilities (Carotenuto et al., 2012) and no wall slip occur (Carotenuto et al. 2015b, Minale 2016a,b).Three types of tests are run: a) cooling and heating ramps; b) frequency sweeps; c) time sweeps. The cooling/heating ramp are run at ±2.5°C/min and an imposed oscillation frequency of 5 rad/s. The frequency sweeps tests, from 100 rad/s to 0.4 rad/s, are run to monitor the microstructure at different stages of the crystallization process. To erase all previous crystallization memories the sample is always first heated up to
100°C, it is then cooled down to the set temperature at -2.5°C/min and finally the frequency sweep test, lasting about 3 min, is immediately run. The time sweep tests are run similarly to the frequency sweep ones by heating the sample to 100 °C and the cooling it till the set temperature at -2.5°C/min where the microstructure evolution is followed at 5 rad/s for 1 h.
3. ResultsIn Figure 1, the storage (G’) and loss (G’’) moduli are plotted vs. the temperature as measured during the cooling and heating ramps. A hysteresis is clearly observable, reflecting the difference between the fusion and crystallization process. It can be seen that the phase transition occurs between 45 and
85 °C where the moduli measured during the cooling and heating ramps overlap.In Figure 2, the moduli measured during the frequency sweep tests are plotted vs. the frequency at different temperatures. The moduli evolution clearly shows the transition from a liquid-like to a solid-like behaviour. At high temperature, G’’ is larger than G’ at each frequency, with slopes at small frequency approaching the values of -1 and -2, typical of the linear viscoelastic behaviour of melts. At 60 °C, G’ and G’’ are almost parallel, thus suggesting the occurrence of a gelation (Carotenuto and Grizzuti, 2006). At higher temperatures, G’ is larger than G’’, suggesting a solid-like behaviour, and data at small frequencies tend to a horizontal plateau, typical of a three-dimensional polymer network (Grassia and D’Amore, 2005). Notice that G’ and G’’ at 60 °C shows an unusual non-monotonic trend, with a minimum around 0.8 rad/s. This is due to the progress of crystallization during the tests.
Figure 1: Storage (G’) and loss (G’’) moduli vs temperature during cooling/heating ramps at ±2.5°C/min.
Figure 2: Storage (G’) and loss (G’’) moduli vs frequency during frequency sweeps at different temperatures.
Figure 3: Evolution of G’ at different temperatures during the crystallization process in time sweep tests.
In Figure 3, the evolution of the sole storage modulus (G’), which is more sensitive to the microstructure evolution, is plotted vs. time as measured during the time sweep experiments. Let us underline that the copolymer, at each temperature, starts at the beginning of the time sweep test from a finite degree of crystallinity gained during the cooling ramp. The fastest crystallization is recorded at 60°C, in agreement with the non–monotonic trend of the moduli observed in Figure 2
4. Degree of Crystallinity CalculationIn agreement with Coppola et al. (2006), we define:
ξ (T )=G'−G' 0G '∞−G' 0
(3)
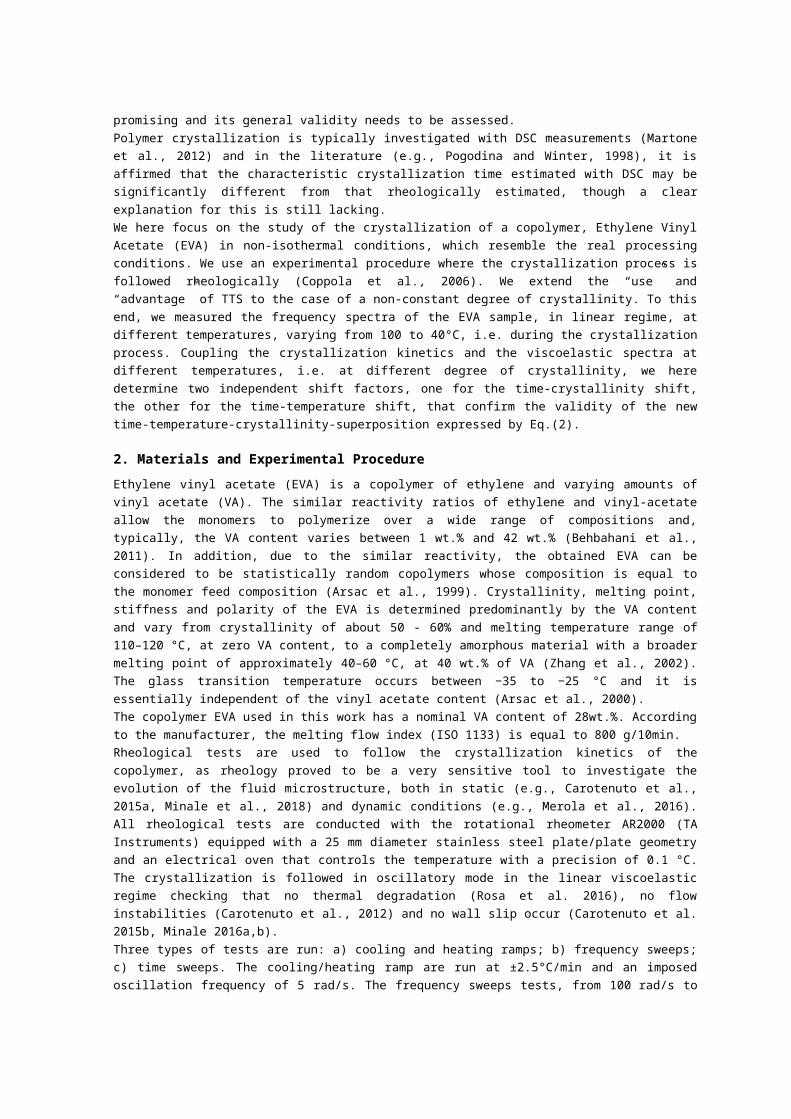
where ξ is the relative crystallinity and G’0 and G’∞ are the storage moduli of the polymer totally molten and that at the end of crystallization at a certain temperature, respectively. G’0(T) and G’∞(T) are estimated from the cooling and heating ramp by fitting an Arrhenius equation, Eq.(4), through the branches where the either the crystallization or the melting is not started yet, respectively.
G '0 (T )=k0 exp( E0RT );G '∞ (T )=k∞exp ( E∞RT ) (4)The fittings of the Arrhenius equation Eq.(4) are plotted in Figure 4a and the estimated parameters are:
k 0=3.98×10⁻⁵ Pa, k∞=1.58×10
−1Pa, E0 /R=1.02×104°K and E∞ /R=5.57×103°K. The
relative crystallinity ξ (T ) calaculated with Eq.(3) during the cooling and heating ramps is shown in Figure 4b.
a) b)
Figure 4: Cooling and heating ramps: a) G’, symbols are data of Figure 1, lines are eq. 4; b) relative crystallinity estimated with eq. 3
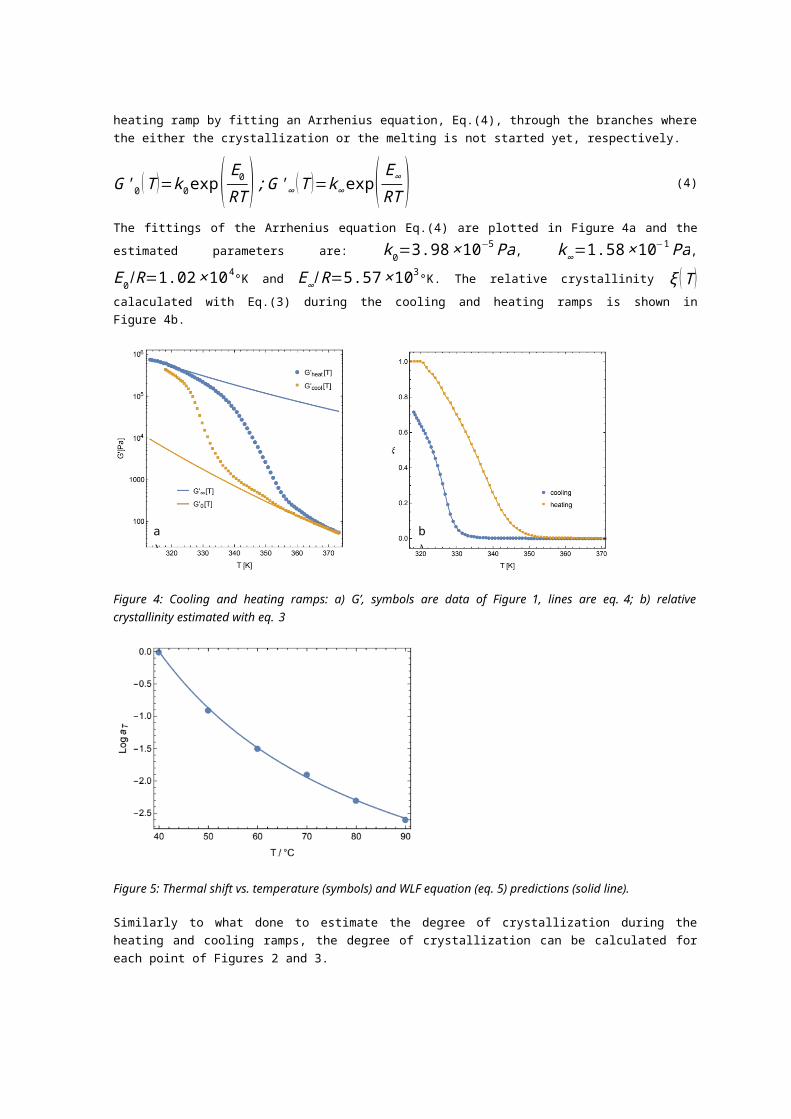
Figure 5: Thermal shift vs. temperature (symbols) and WLF equation (eq. 5) predictions (solid line).
Similarly to what done to estimate the degree of crystallization during the heating and cooling ramps, the degree of crystallization can be calculated for each point of Figures 2 and 3.
5. Time-Temperature-Crystallinity-SuperpositionIn agreement with Eq.(2) the temperature and crystallinity shift factors are considered independent and the overall shift factor is calculated as the product of the two. The determination of the temperature and relative crystallinity shift factors can be thus performed with a two steps procedure. In the first step, the temperature shift factors, aT, can be calculated from data at a constant relative crystallinity; in the second step the relative
crystallinity is taken into account to obtain the overall superposition and aξ is evaluated. The computation of the shift factors is performed using only G’ data and then the same shift factors are utilized to construct the master curves in terms of G’’ and complex viscosity, η*. The thermal shift factors determined in the first step are reported in Figure 5 and are fitted with Williams-Landel-Ferry (WLF) equation:
log10 (aT )=−c1 (T−Tref )c2+(T−T ref )
(5)where Tref is arbitrarily set to 40 °C. The parameters of the WLF equation, c1 = 5.0 and c2 = 48 °K, are evaluated using a best fit procedure. The crystallinity shift factors successively determined are interpolated with Eq.(6), as suggested by Lamberti et al. (2007), obtaining b1 = 6.3 and b2 = 0.68. The resulting master curves of the moduli and of the complex viscosity are shown in Figure 6.
log10 (aξ)=b1 ξb2 (6)
Figure 6: (a) G’ and G’’ and (b) η* master curves vs. reduced frequency. Reference conditions: T ref = 40 °C and ξ = 0. (a) Vertical dashed line corresponds to the crossover at 3 rad/s. (b) dashed line with slope -0.86.
6. ConclusionsThe superposition procedure works well apart from some scatter of data for G’’. The Time-Temperature-Crystallinity-Superposition validity confirms the hypothesized crystallinity-temperature simplicity. TTCS allows having a model applicable in process conditions during the phases of crystallization and melting that can be used to deduce a constitutive equation applicable in all the phases of the process.
References
Arsac A., Carrot C., Guillet J., 1999, Rheological characterization of ethylene vinyl acetate copolymers, Journal of Applied Polymer Science, 74, 2625-2630.
Arsac A., Carrot C., Guillet J., 2000, Determination of Primary Relaxation Temperatures and Melting Points of Ethylene Vinyl Acetate Copolymers, Journal of Thermal Analysis and Calorimetry, 61, 681-685.
Behbahani T.J., Dahaghin A., Kashefi K., 2011, Effect of Solvent on Rheological Behavior of Iranian Waxy Crude Oil, Petroleum Science and Technology, 29, 933-941.
Carotenuto C., Marinello F., Minale M., 2012, A new experimental technique to study the flow in a porous layer via rheological tests, AIP Conference Proceedings, 1453, 29-34.
Carotenuto C., Merola M.C., Álvarez-Romero M., Coppola E., Minale M., 2015a, Rheology of natural slurries involved in a rapid mudflow with different soil organic carbon content, Colloids and Surfaces A: Physicochemical and Engineering Aspects, 466, 57-65.
Carotenuto C., Vananroye A., Vermant J., Minale M., 2015b, Predicting the apparent wall slip when using roughened geometries: A porous medium approach, Journal of Rheology, 59, 1131-1149.
Coppola S., Acierno S., Grizzuti N., Vlassopoulos D., 2006, Viscoelastic Behavior of Semicrystalline Thermoplastic Polymers during the Early Stages of Crystallization, Macromolecules, 39, 1507-1514.
Ferry J.D., 1980, Viscoelastic properties of polymers, John Wiley & Sons.Grassia L., D'Amore A., 2005, Residual Stresses in Amorphous Polymers, Macromolecular Symposia, 228, 1-
16.Haudin J.M., Boyer S.A.E., 2017, Crystallization of Polymers in Processing Conditions: An Overview,
International Polymer Processing, 32, 545-554.Lamberti G., Peters G.W.M., Titomanlio G., 2007, Crystallinity and Linear Rheological Properties of Polymers,
International Polymer Processing, 22, 303-310.Martone A., Grassia L., Zarrelli M., Giordano M., D’Amore A., 2012, Enthalpy relaxation of an epoxy
matrix/carbon nanotubes, AIP Conference Proceedings, 1459, 347-349.Merola M.C., Carotenuto C., Gargiulo V., Stanzione F., Ciajolo A., Minale M., 2016, Chemical–physical
analysis of rheologically different samples of a heavy crude oil, Fuel Processing Technology, 148, 236-247.
Minale M., 2016a, Modelling the flow of a second order fluid through and over a porous medium using the volume averages. I. The generalized Brinkman’s equation, Physics of Fluids, 28, 023102.
a) b)
Minale M., 2016b, Modelling the flow of a second order fluid through and over a porous medium using the volume averages. II. The stress boundary condition, Physics of Fluids, 28, 023103.
Minale M., Merola M.C., Carotenuto C., 2018, Effect of solvents on the microstructure aggregation of a heavy crude oil, Fuel Processing Technology, 177, 299-308.
Pantani R., Speranza V., Titomanlio G., 2015, Simultaneous morphological and rheological measurements on polypropylene: Effect of crystallinity on viscoelastic parameters, Journal of Rheology, 59, 377-390.
Pogodina N.V., Winter H.H., 1998, Polypropylene crystallization as a physical gelation process, Macromolecules, 31, 8164-8172.
Rosa M., Grassia L., D'Amore A., Carotenuto C., Minale M., 2016, Rheology and mechanics of polyether(ether)ketone - Polyetherimide blends for composites in aeronautics, AIP Conference Proceedings, 1736.
Zhang Q., Lin W., Yang G., Chen Q., 2002, Studies on the phase structure of ethylene-vinyl acetate copolymers by solid-state 1H and 13C NMR, Journal of Polymer Science Part B: Polymer Physics, 40, 2199-2207.


![Solidification · 2017-09-12 · solidification. 0.2 kBTm for homogenous nucleation in pure metals [4]. The addition of foreign substrates in the melt provides nucleation sites with](https://static.documents.pub/doc/80x56/5ec892b94b6bd71ac95ffd98/solidification-2017-09-12-solidification-02-kbtm-for-homogenous-nucleation-in.jpg)


