+ All Categories
Home > Documents > spiral.imperial.ac.uk · Web viewPhthalic anhydride (Sigma) was purified by dissolution and...

spiral.imperial.ac.uk · Web viewPhthalic anhydride (Sigma) was purified by dissolution and...

Date post: 24-Feb-2020
Category:
Upload: others
View: 2 times
Download: 0 times
Share this document with a friend
36
Chemoselective Polymerizations From Mixtures of Epoxide, Lactone, Anhydride and CO 2 : Charles Romain, * Yunqing. Zhu, Paul Dingwall, Shyeni Paul, Henry Rzepa, Antoine Buchard and Charlotte K. Williams * †: Department of Chemistry, Imperial College London, London SW7 2AZ, UK ‡: Department of Chemistry, University of Bath, Bath BA2 7AY, UK [email protected] Contents Page # Experimental Section S2-S4 Table S1, Figure S1 S5 Figure S2 S6 Figure S3, Figure S4 S7 Figure S5, Figure S6 S8 Table S3 S9 Figure S7 S10 Table S4 S11 Figure S8 S12 Figure S9, Table S5 S13 Figure S10, Figure S11 S14 Figure S12, Figure S13 S15 Figure S14, Figure S15 S16 Figure S16, Figure S17 S17 Table S6, Figure S18 S18 Figure S19 S19 Figure S20 S20 Table S7, Table S8 S21 Data for Table1 (Figure S21- S29) S22-25 Data for Table 2 (Figure S30- S34) S26-28 S1
Transcript

Chemoselective Polymerizations From Mixtures of Epoxide, Lactone, Anhydride and CO2:

Charles Romain,†* Yunqing. Zhu,† Paul Dingwall,† Shyeni Paul,† Henry Rzepa,†

Antoine Buchard‡ and Charlotte K. Williams†*

†: Department of Chemistry, Imperial College London, London SW7 2AZ, UK

‡: Department of Chemistry, University of Bath, Bath BA2 7AY, UK

[email protected]

Contents Page #Experimental Section S2-S4Table S1, Figure S1 S5Figure S2 S6Figure S3, Figure S4 S7Figure S5, Figure S6 S8Table S3 S9Figure S7 S10Table S4 S11Figure S8 S12Figure S9, Table S5 S13Figure S10, Figure S11 S14Figure S12, Figure S13 S15Figure S14, Figure S15 S16Figure S16, Figure S17 S17Table S6, Figure S18 S18Figure S19 S19Figure S20 S20Table S7, Table S8 S21Data for Table1 (Figure S21-S29) S22-25Data for Table 2 (Figure S30-S34) S26-28References S29

Complementary data available at http://doi.org/10.14469/hpc/244.

S1

Experimental Section

General considerations

All polymerizations were performed under inert atmosphere using a Schlenk line and

standard anaerobic techniques or in a dry, solvent-free glove-box. Catalyst 1 was

prepared as described in the literature.1 Toluene and THF were distilled, under an

inert atmosphere, from sodium and were stored over activated 3 Å molecular sieves.

CHO was received from Aldrich, dried over CaH2 for a minimum of 48 h and

fractionally distilled. -CL was dried over CaH2 and fractionally distilled. Phthalic

anhydride (Sigma) was purified by dissolution and filtration in dichloromethane

(HPLC grade) and re-crystallized twice from hot toluene. After purification, both -CL

and PA were stored in the glove-box.

Characterization Methods

NMR spectra were recorded on Bruker AVIII-400 and AVIII-500 spectrometers. All

chemicals shifts were determined using residual signals of the deuterated solvents

and were calibrated vs. SiMe4. DOSY experiments were performed at a steady

temperature of 298K with at least 32 gradient increments using the ledbpgp2s

sequence. Complete diffusion was ensured using the T1/T2 module of Topspin and

DOSY transformations using either mono, bis- or tri-exponential fitting were

performed using the same software after zero filling.

Size Exclusion Chromatography measurements were performed on a Polymer

Laboratories PL-GPC 50 using THF at 1mL/min and 40 C on two PLgel 5um

MIXED-D column sets. Dual RID-MALLS detection was used using a Dawn 8+

MALLS detector (Wyatt) and the internal RID detector of the PL-50 system. Some of

the SEC traces show ‘shoulders’ but in all cases the dispersities are <1.60. It is

noted that the polymers likely feature bothcyclohexyl-acetate, - hydroxyl and

di-hydroxyl end-groups. The end-group characterization has been investigated

in detail previously for catalyst 1.2

In situ ATR-IR reaction monitoring were using a Mettler-Toledo ReactIR 4000

spectrometer equipped with a MCT detector and a silver halide DiComp probe.

S2

Computational Details

DFT calculations were performed using Gaussian 09 (revision C01).3 Calculations

used the ωB97XD density functional and the 6-31G(d) basis set. Self-consistent-

reaction-cavity continuum solvation model was used with dichloromethane as the

solvent to model solvation in cyclohexene oxide. All transition states were

characterized by normal coordinate analysis revealing precisely one imaginary mode

corresponding to the intended reaction. For 8PA’-TS an IRC calculation was

performed which also confirmed the identity of the transition state. Full coordinates

for all the stationary points, together with normal mode animations are available via

the Web-enhanced tables and which also include links to full details for each

calculation found in a digital repository.

Typical Polymerization Procedures

Polymerizations of -CL in CHO (Table 1)

In a glovebox, the zinc catalyst (10.0 mg, 1.25 10-2 mmol), ɛ-CL (296 L, 2.52

mmol) ) and CHO (1.02 mL, 10.1 mmol) were mixed in a screw-capped vial, charged

with a stir bar (loading as described in Table 1). The mixture was then heated to 80 oC and left to react for the desired time (see Table 1).

Polymerizations of -CL in CHO with added CO2 (Table 1)

In a glovebox, the zinc catalyst (10.00 mg, 1.25 x 10⁻² mmol), -CL (1.08 mL, 7.50

mmol) and CHO (2.50 mL, 25.00 mmol) were mixed in Schlenk tube charged with a

stir bar. Under a flow of nitrogen, the React-IR probe was introduced and the

reaction was heated to 80 °C. As soon as the formation of PCL was observed, CO 2

was added to the reaction and the reaction was left at 80 °C for desired time.

Polymerizations of mixtures of -CL, PA and CHO (Table 2):

S3

The zinc catalyst (10.0 mg, 1.25 10-2 mmol), phthalic anhydride (37.0 mg, 0.25

mmol) and ɛ-CL (210.0 μL, 1.88 mmol) were dissolved in CHO (505.0 μL, 5.00

mmol), under N2 protection, in a screw-capped vial, charged with a stir bar. The

mixture was then heated to 100 oC and left to react for 2 h. The block copolymer was

precipitated using cold MeOH.

Polymerizations of -CL in CHO with added phthalic anhydride (Fig. S15)

In a glovebox, the zinc catalyst (20 mg, 2.50 x 10 -2 mmol), -CL (1.78 mL, 15.00

mmol) and CHO (5.1 mL, 50.00 mmol) were mixed in Schlenk tube, charged with a

stir bar. After 5 minutes, an aliquot was taken and phthalic anhydride (74.5 mg, 0..5

mmol) was added. The reaction was left to react and aliquots were taken after 20

minutes and 3 hours. No further formation of PCL was observed by 1H NMR

spectroscopy.

S4

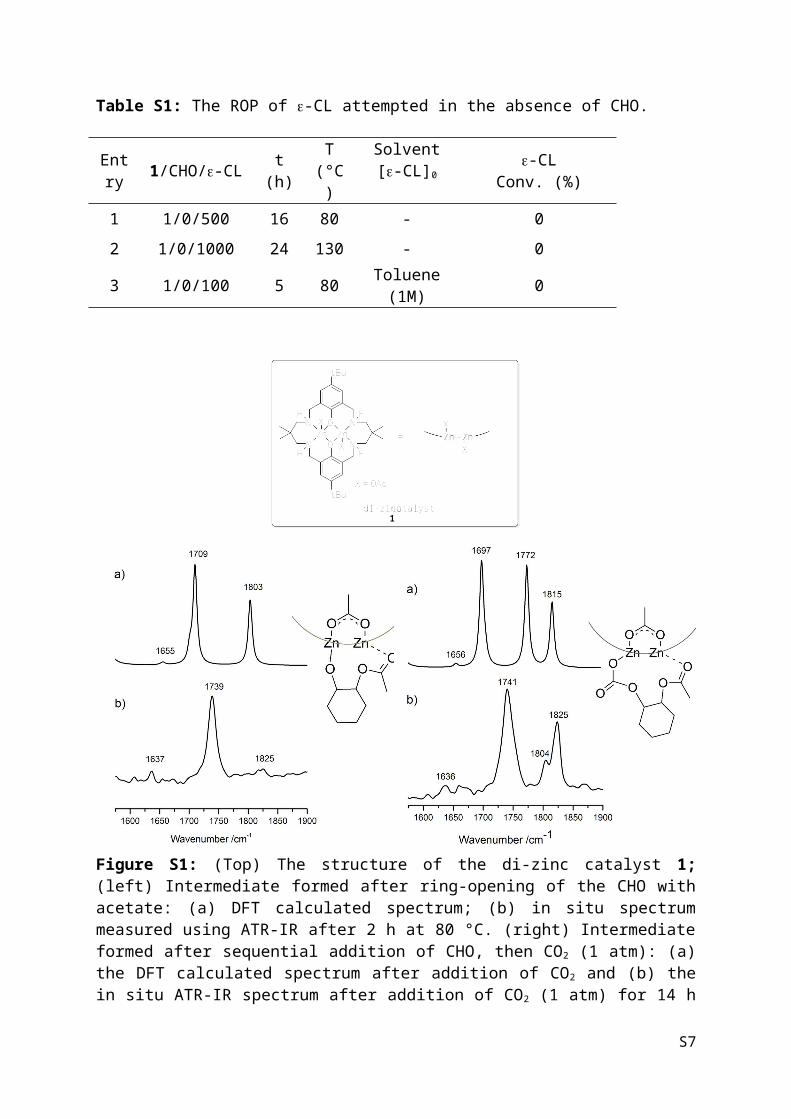
Table S1: The ROP of -CL attempted in the absence of CHO.

Figure S1: (Top) The structure of the di-zinc catalyst 1; (left) Intermediate formed after ring-opening of the CHO with acetate: (a) DFT calculated spectrum; (b) in situ spectrum measured using ATR-IR after 2 h at 80 °C. (right) Intermediate formed after sequential addition of CHO, then CO2 (1 atm): (a) the DFT calculated spectrum after addition of CO2 and (b) the in situ ATR-IR spectrum after addition of CO2 (1 atm) for 14 h at 80 °C. Data reproduced with permission from the reference 4. Copyright 2015 American Chemical Society.

S5

Entry 1/CHO/-CL t

(h)T

(°C)Solvent[-CL]0

-CLConv. (%)

1 1/0/500 16 80 - 0

2 1/0/1000 24 130 - 0

3 1/0/100 5 80 Toluene(1M) 0

Figure S2: Plot showing linear fit between Mn and catalyst loading (Table S2, entries 1 to 4). The values for the Mn (experimental) (♦) were determined by SEC, calibrated with polystyrene standards, and a correction factor of 0.56 was applied as described in the literature.5 The values for the Mn(theoretical) (■) were calculated in the following way: 1 (eq.) x -CL (eq.) x conversion x 114.14 x (1/2).

Entry 1/CHO/-CL

t(min)

-CLConv. (%)

Mn(PS) (Ð)kg.mol-1

Mn(experimental)

kg.mol-1Mn(theoretical)

kg.mol-1

1 1/900/100 40 100 6.0 (1.20) 3.4 5.72 1/800/200 45 100 7.4 (1.90) 4.1 11.43 1/600/400 40 100 22.2 (1.50) 12.4 22.84 1/400/600 35 100 38.0 (1.40) 21.3 34.2

Table S2: The data and conditions for the entries shown in Fig. S2.

S6

0 100 200 300 400 500 600 7000

5

10

15

20

25

30

35

40

Mn (exp.)

eq. of e-CL vs. 1

Mn

(kg/

mol

)

Figure S3: 1H NMR spectrum showing formation of PCHC from a mixture 1/CHO/-CL/CO2, the conditions are described in Table 1, entry 5.

Figure S4: 1H NMR spectrum (CDCl3) of the product from Table 1, entry 7. Note that there is no formation of PCL or PCHC even after 8.5 h at 80 °C, under CO2

atmosphere. Reaction conditions: 1/CHO/-CL/CO2 = 1/400/600/1 atm.

S7

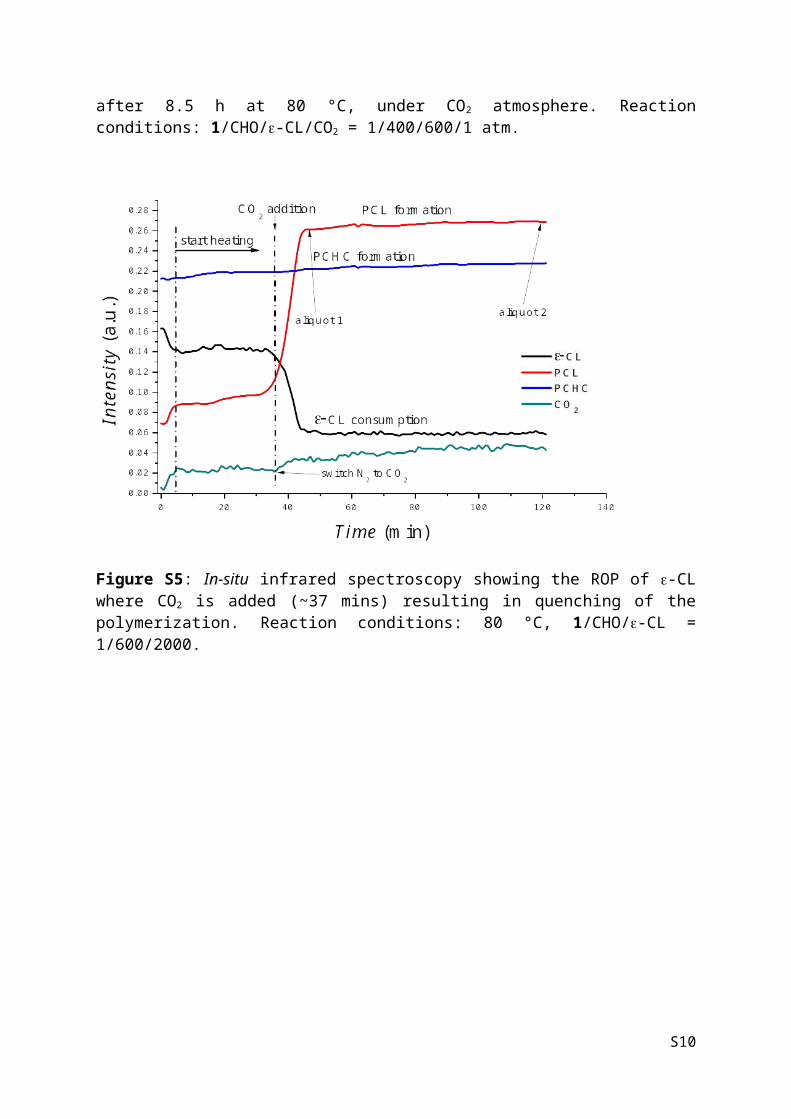
Figure S5: In-situ infrared spectroscopy showing the ROP of -CL where CO2 is added (~37 mins) resulting in quenching of the polymerization. Reaction conditions: 80 °C, 1/CHO/-CL = 1/600/2000.

Figure S6: 1H NMR spectrum of the sample resulting from the polymerization shown in Fig S4. Note that there is no formation of PCHC, even after prolonged time.

S8

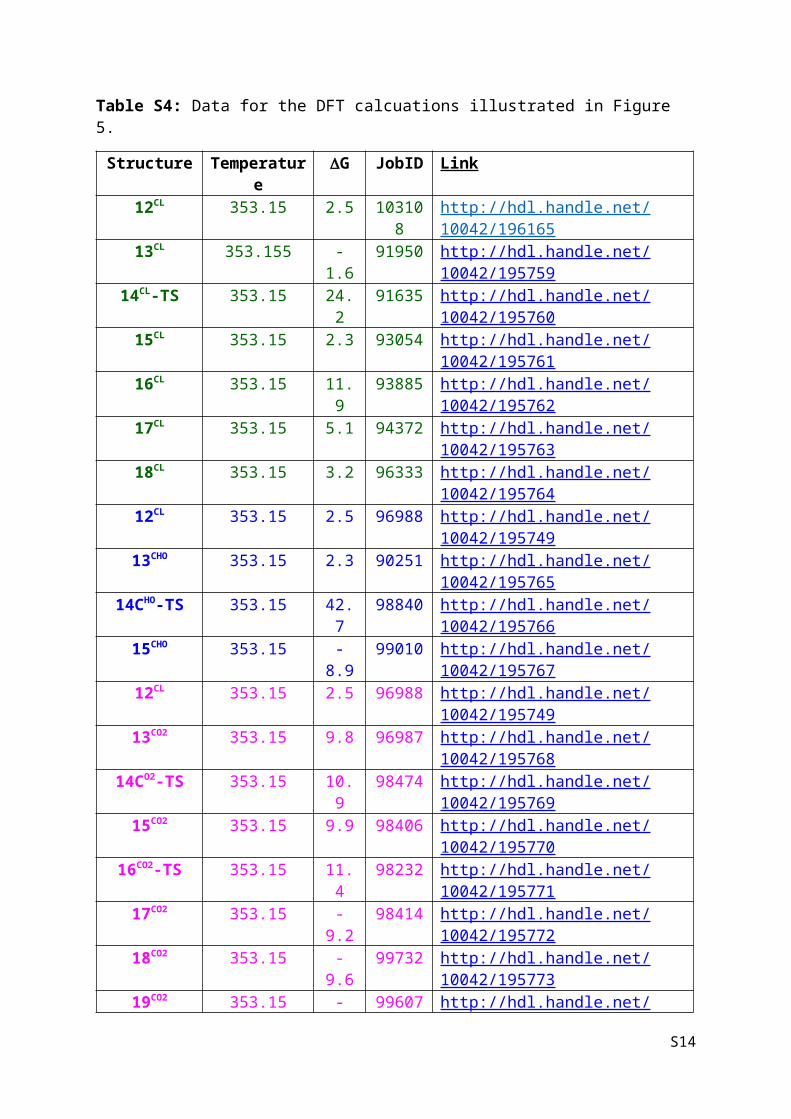
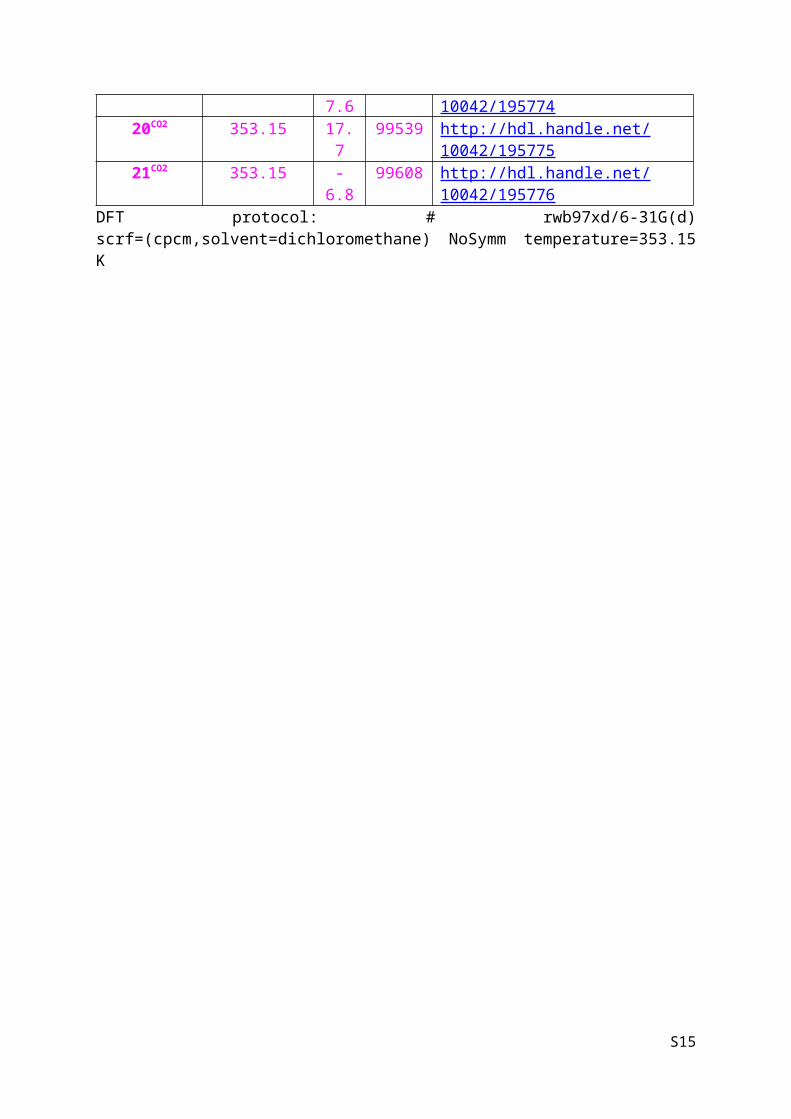
Table S3: Data for the DFT calculations illustrated in Figure 4.

Structure Temperature G JobID Link 1 353.15 0.0 1000501

7http://hdl.handle.net/10042/195777

2 353.15 -6.2 100085 http://hdl.handle.net/10042/195740

3 353.15 -2.7 100146 http://hdl.handle.net/10042/195741

4-TS 353.15 17.1 100086 http://hdl.handle.net/10042/195742

5 353.15 -10.7

100147 http://hdl.handle.net/10042/195743

6 353.15 -5.2 101999 http://hdl.handle.net/10042/195744

7CL 353.15 -2.9 102000 http://hdl.handle.net/10042/195745

8CL-TS 353.15 30.7 89629 http://hdl.handle.net/10042/195746

9CL 353.15 -2.8 87244 http://hdl.handle.net/10042/195747

10CL-TS 353.15 13.1 88875 http://hdl.handle.net/10042/195739

11CL 353.15 9.4 89677 http://hdl.handle.net/10042/19574 8

12CL 353.15 2.5 96988 http://hdl.handle.net/10042/195749

7CHO 353.15 -5.7 103067 http://hdl.handle.net/10042/195750

8CHO-TS 353.15 33.4 102869 http://hdl.handle.net/10042/195751

9CHO 353.15 -22.1

103066 http://hdl.handle.net/10042/195752

7CO2 353.15 -1.5 102925 http://hdl.handle.net/10042/195753

8CO2-TS 353.15 7.5 102870 http://hdl.handle.net/10042/195754

9CO2 353.15 6.1 102927 http://hdl.handle.net/10042/195755

10CO2-TS 353.15 9.9 102871 http://hdl.handle.net/10042/195756

11CO2 353.15 -6.5 103107 http://hdl.handle.net/10042/195757

12CO2 353.15 -12.7

103702 http://hdl.handle.net/10042/195758

DFT protocol: # rwb97xd/6-31g(d) scrf=(cpcm,solvent=dichloromethane) NoSymm temperature=353.15 K

S9

Figure S7: Potential energy surface for activation and initiation in -CL ROP (green); CHO/CO2 ROCOP (purple) or CHO ROP (blue); DFT protocol: # rwb97xd/6-31g(d) scrf=(cpcm,solvent=dichloromethane) NoSymm temperature=353.15 K, as per table S3. Data available here <please insert weblink to 10.14469/hpc/275>.

S10

Table S4: Data for the DFT calcuations illustrated in Figure 5.

Structure Temperature

G JobID Link

12CL 353.15 2.5 103108

http://hdl.handle.net/10042/196165

13CL 353.155 -1.6 91950 http://hdl.handle.net/10042/195759

14CL-TS 353.15 24.2 91635 http://hdl.handle.net/10042/195760

15CL 353.15 2.3 93054 http://hdl.handle.net/10042/19576116CL 353.15 11.9 93885 http://hdl.handle.net/

10042/19576217CL 353.15 5.1 94372 http://hdl.handle.net/

10042/19576318CL 353.15 3.2 96333 http://hdl.handle.net/

10042/19576412CL 353.15 2.5 96988 http://hdl.handle.net/

10042/19574913CHO 353.15 2.3 90251 http://hdl.handle.net/

10042/19576514CHO-TS 353.15 42.7 98840 http://hdl.handle.net/

10042/19576615CHO 353.15 -8.9 99010 http://hdl.handle.net/

10042/19576712CL 353.15 2.5 96988 http://hdl.handle.net/

10042/19574913CO2 353.15 9.8 96987 http://hdl.handle.net/

10042/19576814CO2-TS 353.15 10.9 98474 http://hdl.handle.net/

10042/19576915CO2 353.15 9.9 98406 http://hdl.handle.net/

10042/19577016CO2-TS 353.15 11.4 98232 http://hdl.handle.net/

10042/19577117CO2 353.15 -9.2 98414 http://hdl.handle.net/

10042/19577218CO2 353.15 -9.6 99732 http://hdl.handle.net/

10042/19577319CO2 353.15 -7.6 99607 http://hdl.handle.net/

10042/19577420CO2 353.15 17.7 99539 http://hdl.handle.net/

10042/19577521CO2 353.15 -6.8 99608 http://hdl.handle.net/

10042/195776DFT protocol: # rwb97xd/6-31G(d) scrf=(cpcm,solvent=dichloromethane) NoSymm temperature=353.15 K

S11

Figure S8: Potential energy surface for -CL propagation (green); CHO/CO2 ROCOP (purple) or CHO ROP (blue); DFT protocol: # rwb97xd/6-31g(d) scrf=(cpcm,solvent=dichloromethane) NoSymm temperature=353.15 K, as per Table S4. Data available here <please insert link to10.14469/hpc/278>

S12

Figure S9: 1H NMR spectrum of PCL before the 2nd addition of ε-CL (upper) and 6.0 h after the 2nd addition of ε-CL (lower) at room temperature. The signal of CHO is used as the internal reference.

Table S5: Data and conditions for the polymerizations monitored in Fig. S9. Full conversion of -CL was observed in all cases.

S13

# [cat.]/[ε-CL]/[CHO] Temp. (oC)

t (h) Mn (kDa) Đ

a 1/100/900 80 2.0 8.8 1.43b 1/(100+100)/900 25 6.0 18.1 1.49

Figure S10: Plots showing the SEC outputs for the analysis of the PCL, synthesised as per the conditions above. Curve a is the first ε-CL polymerization (100 eq) and curve b shows the polymer after the second addition (100 eq) and polymerization of ε-CL.

Figure S11: 1H NMR spectrum showing selective formation of PCHPE with no polymerization of PCL. Reaction conditions from Table 2, entry 4.

S14

Figure S12: 1H NMR spectra of the PCHPE block and, subsequently, the PCHPE-b-PCL block copolyester. Conditions as per Table 2, entry 2.

Figure S13: The SEC plots for polyesters (PCHPE-b-PCL and PCHPE). The chromatograms correspond to the relevant entries in Table 2.

S15

Figure S14. The SEC plots for polyesters, PCHPE (Table 2, entry 1) and PCHPE-b-PCL (Table 2, entry 3), recorded using a UV detector at 254 nm.

Figure S15: The DOSY spectrum of the block copolyester (PCHPE-b-PCL) prepared according to the conditions described in Table 2, entry 2.

S16

PCL signal

PCHPE signals

Figure S16: The DOSY spectrum of a mixture of PCHPE and PCL.

Figure S17: 1H NMR spectra showing -CL ROP inhibition by the addition of PA. Reaction conditions: 1 CHO/-CL = 1/2000/600, at 80 °C, 5 min; then the addition of 20 eq. (vs. 1) of PA.

S17

PCHPE signals

PCL signal

Table S6: Data for the DFT calculations illustrated in Figures 9-11.

Structure T (K) G JobID Link6'' 373.15 104128 http://dx.doi.org/10.6084/

m9.figshare.1506861eCL'' 373.15 104285 http://dx.doi.org/10.6084/

m9.figshare.15075586''+eCL'' 373.15 0

7'' 373.15 3.3 104129 http://dx.doi.org/10.6084/m9.figshare.1507553

8CL''-TS 373.15 37 104264 http://dx.doi.org/10.6084/m9.figshare.1507559

9CL'' 373.15 3.4 104131 http://dx.doi.org/10.6084/m9.figshare.1507557

10CL''-TS 373.15 19.4 104136 http://dx.doi.org/10.6084/m9.figshare.1507556

11CL'' 373.15 15.2 104133 http://dx.doi.org/10.6084/m9.figshare.1507554

12CL'' 373.15 10.7 104134 http://dx.doi.org/10.6084/m9.figshare.1507555

PA'' 373.15 104337 http://dx.doi.org/10.6084/m9.figshare.1507562

6'' + PA'' 373.15 07PA'' 373.15 3.3 104293 http://dx.doi.org/10.6084/

m9.figshare.15075638PA''-TS 373.15 18.8 104291 http://dx.doi.org/10.6084/

m9.figshare.150756411PA'' 373.15 -23.2 104292 http://dx.doi.org/10.6084/

m9.figshare.1507565DFT protocol: # rwb97xd/6-31g(d) scrf=(cpcm,solvent=dichloromethane) NoSymm

temperature=373.15 K

S18

Figure S18: Illustrates the calculated potential energy surface for ROCOP of CHO/PA that includes two hidden intermediates between 8PA’-TS and 11PA’. DFT protocol: # rwb97xd/6-31g(d) scrf=(cpcm,solvent=dichloromethane) NoSymm temperature=373.15K integral=grid=ultrafine. Data available here <please inert link to http://doi.org/10.14469/hpc/281>

Figure S19: IRC calculations from 8PA’-TS. DFT protocol: # IRC = (reverse, maxpoints=150, recalc=10, calcfc, maxcycle=40, tight,cartesian, lqa ,stepsize=15) wb97xd/6-31g(d); integral=grid=ultrafine; temperature = 373.15 K scrf=(cpcm,solvent=dichloromethane). Data available here <please inert link to http://doi.org/10.14469/hpc/281>

S19

S20

0 100 200 300 400 500 600 700 8000.0

0.2

0.4

0.6

0.8A

bsor

banc

e / a

.u.

Time / min

1720-1740 PE 1860 PA 1239-1176 PCHC

Figure S20: Shows the changes in the intensity of the ATR-FTIR resonances observed during ROCOP of PA, CHO and CO2 using complex 1. Polymerization conditions: 1:PA:CHO = 1:10:800, under 1 bar CO2 at 100 °C. The baseline ‘noise’ observed after 400 minutes results from an increase in sample viscosity due to polymerization reaching relatively higher conversions. The slight increase in PA concentration at very start is due to the time required for PA to fully dissolve in the CHO. Reproduced with permission from reference 6.

S21

Table S7: Comparison of two different basis sets for selected intermediates for CHO/CO2 ROCOP, an interactive online version of this table can be found here <please inert link to index.html in TableS7-WEO.zip submitted along with this manuscript>

StructureGa

[6-311G(d,p)] for C,H, O, NZn: [6-311G(2df)]

StructureGb

[6-31G(d)] for all atoms

6’* 0 6’ 0

7CO2’* +6.8 7CO2’ +3.0

8TS-CO2’* +11.9 8TS-CO2’ +12.8

10TS-CO2’* +12.81 10TS-CO2’ +14.5a) DFT protocol: # rwb97xd/ C,H,O,N:6-311G(d,p), Zn:6-311G(2df) scrf=(cpcm,solvent=dichloromethane) NoSymm temperature=353.15 K; b) # rwb97xd/6-31g(d) scrf=(cpcm,solvent=dichloromethane) NoSymm temperature=353.15 K

Table S8: Comparison of two different basis sets for selected intermediates for CHO/PA ROCOP, an interactive online version of this table can be found here <please inert link to index.html in TableS8-WEO.zip submitted along with this manuscript>

StructureGa

[[6-311G(d,p)] for C,H, O, NZn: [6-311G(2df)]

StructureGb

[6-31G(d)] for all atoms

6’* 0 6’* 0

7PA’* +1.9 7PA’* +3.4

8TS-PA’* +16.5 8TS-PA’* +16.7

11TS-PA’* -25.5 11TS-PA’* -23.9a) DFT protocol: # rwb97xd/ C,H,O,N:6-311G(d,p), Zn:6-311G(2df) scrf=(cpcm,solvent=dichloromethane) NoSymm temperature=373.15 K; b) # rwb97xd/6-31g(d) scrf=(cpcm,solvent=dichloromethane) NoSymm temperature=373.15 K

S22

NMR data and SEC data for entries in Table 1

Table1,Entry 1:

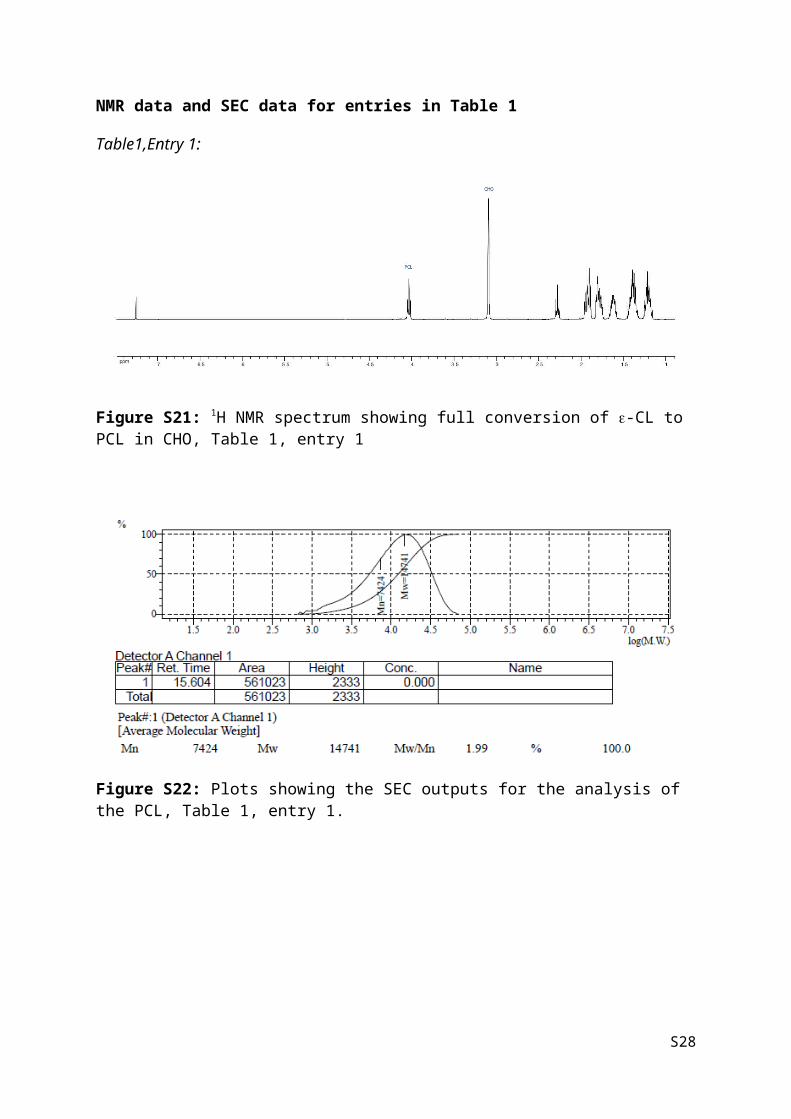
Figure S21: 1H NMR spectrum showing full conversion of -CL to PCL in CHO, Table 1, entry 1

Figure S22: Plots showing the SEC outputs for the analysis of the PCL, Table 1, entry 1.

S23

Table 1, Entry 2

Figure S23: 1H NMR spectrum showing full conversion of e-CL to PCL in CHO, Table 1, entry 2

Figure S24: Plots showing the SEC outputs for the analysis of the PCL, Table 1, entry 2.

S24

Table 1, Entry 3

Figure S25 1H NMR spectrum showing full conversion of -CL to PCL in CHO, Table 1, entry 3

Figure S26: Plots showing the SEC outputs for the analysis of the PCL, Table 1, entry 3.

S25

Table1, Entry 4

Figure S27: 1H NMR spectrum showing 58% conversion of -CL to PCL in CHO, Table 1, entry 4

Figure S28: Plots showing the SEC outputs for the analysis of the PCL, Table 1, entry 4.

S26

NMR data for Table 2

Figure S29: 1H NMR spectrum of Table 2, entry 1 in CDCl3

Figure S30: 1H NMR spectrum of Table 2, entry 2 in CDCl3

S27

Figure S31: 1H NMR spectrum of Table 2, entry 3 in CDCl3

Figure S32: 1H NMR spectrum of Table 2, entry 4 in DMSO-d6

S28

Figure S33: 1H NMR spectrum of Table 2, entry 5 in CDCl3

S29

REFERENCES

1. Romain, C.; Williams, C. K. Angew. Chem. Int. Ed. 2014, 53, 1607-1610.2. Jutz, F.; Buchard, A.; Kember, M. R.; Fredrickson, S. B.; Williams, C. K. J. Am. Chem. Soc. 2011, 133, 17395–17405.3. Gaussian 09, Revision A.1, Frisch, M. J.; Trucks, G. W.; Schlegel, H. B.; Scuseria, G. E.; Robb, M. A.; Cheeseman, J. R.; Scalmani, G.; Barone, V.; Mennucci, B.; Petersson, G. A.; Nakatsuji, H.; Caricato, M.; Li, X.; Hratchian, H. P.; Izmaylov, A. F.; Bloino, J.; Zheng, G.; Sonnenberg, J. L.; Hada, M.; Ehara, M.; Toyota, K.; Fukuda, R.; Hasegawa, J.; Ishida, M.; Nakajima, T.; Honda, Y.; Kitao, O.; Nakai, H.; Vreven, T.; Montgomery, Jr., J. A.; Peralta, J. E.; Ogliaro, F.; Bearpark, M.; Heyd, J. J.; Brothers, E.; Kudin, K. N.; Staroverov, V. N.; Kobayashi, R.; Normand, J.; Raghavachari, K.; Rendell, A.; Burant, J. C.; Iyengar, S. S.; Tomasi, J.; Cossi, M.; Rega, N.; Millam, N. J.; Klene, M.; Knox, J. E.; Cross, J. B.; Bakken, V.; Adamo, C.; Jaramillo, J.; Gomperts, R.; Stratmann, R. E.; Yazyev, O.; Austin, A. J.; Cammi, R.; Pomelli, C.; Ochterski, J. W.; Martin, R. L.; Morokuma, K.; Zakrzewski, V. G.; Voth, G. A.; Salvador, P.; Dannenberg, J. J.; Dapprich, S.; Daniels, A. D.; Farkas, Ö.; Foresman, J. B.; Ortiz, J. V.; Cioslowski, J.; Fox, D. J. Gaussian, Inc., Wallingford CT, 2009.4. Buchard, A.; Jutz, F.; Kember, M. R.; White, A. J. P.; Rzepa, H. S.; Williams, C. K. Macromolecules 2012, 45, 6781-6795.5. Kowalski, A.; Duda, A.; Penczek, S. Macromolecules 1998, 31, 2114-2122.6. Saini, P. K.; Romain, C.; Zhu, Y.; Williams, C. K. Polym. Chem. 2014, 5, 6068-6075.

S30


Recommended