Page 1
EFFECT OF MOTIVATION ON EMPLOYEES’ PERFORMANCE AT
HAVEN OF PEACE ACADEMY
SIIMA CHRISTIAN KAJURA
A DISSERTATION SUBMITTED IN PARTIAL FULFILLMENT OF THE
REQUIREMENTS FOR THE DEGREE OF MASTERS OF HUMAN
RESOURCE MANAGEMENT OF THE OPEN UNIVERSITY OF TANZANIA
2015
Page 2
ii
CERTIFICATION
The undersigned certifies that has read and hereby recommends for acceptance by the
Open University of Tanzania a Dissertation entitled “Effect of Motivation on
Employee Performance” in partial fulfillment of the requirements for the degree of
masters of Human Resources Management of the Open University of Tanzania.
……………………………………………………………………………….
Dr. Proches Ngatuni
(Supervisor)
Date:......................................................................................
Page 3
iii
COPY RIGHT
No part of this dissertation may be reproduced, stored in any retrieval system or
transmitted in any way for by any means, electronic, mechanical, photocopying,
recording or otherwise without prior written permission of the author or The
Open University of Tanzania in that behalf.
Page 4
iv
DECLARATION
I, Siima Christian Kajura, do hereby declare that this dissertation is my own original
work and that it has not been submitted for a similar degree in any other university.
___________________________
Signature
___________________________
Date
Page 5
v
DEDICATION
I would like to dedicate this work to my beloved young brother Chrispinus Christian
and my young sister Fortunata Christian and the entire Kajura family.
Page 6
vi
ACKNOWLEDGEMENTS
I would like to extend my thanks to the Almighty God for His mercy and
empowerment to me during the entire period of my studies at the Open University of
Tanzania, His grace has been huge that I remain wordless, may all the glory be to
Him. My sincere gratitude to my supervisor Dr. Proches Ngatuni for his tireless
guidance and patience throughout the research period may God bless him. Special
thanks go to my mother and my pastor for their prayers and encouragement
throughout this work.
The success of this study is a result of the contribution of many people and
organizations. I also express my thanks to the management of Haven of Peace
Academy for their collaboration during my studies and dissertation in general.
Page 7
vii
ABSTRACT
The main objective of this study was to assess the effect of motivation on employees’
performance. A descriptive cross sectional survey was carried out by administering a
questionnaire to teaching and non-teaching staff at Haven of Peace Academy
(HOPAC). Both motivation and employee performance were captured using
attitudinal scales with Likert type of rating. Scores were used to measure the extent to
which employees are motivated and their performance. Comparison was carried out of
both motivation and performance across gender, department and job tenure groups.
Linear regression analysis was used to assess the effect of employee motivation on
their performance. Teaching staff were found to be intrinsically more motivated than
their non-teaching counter parts. No significant differences in intrinsic motivation
across gender, and length of service categories. Insignificant differences were found
in extrinsic motivation and employee performance across gender, teaching department
and length of service categories. Finally, employee performance was found to be
significantly positively affected by both intrinsic and extrinsic motivation where the
effect of intrinsic motivation was more pronounced than that of extrinsic motivation.
It is therefore recommended that HOPAC should balance practices which enhance
intrinsic motivation between teaching and non-teaching staff. It is also recommended
that HOPAC should engage in activities which boost motivation, but more specifically
intrinsic motivation if it wants to maximize employees’ performance.
Key words: Motivation, intrinsic motivation, extrinsic motivation, employees’
performance, job performance, teachers, non teaching staff.
Page 8
viii
TABLE OF CONTENTS
CERTIFICATION............................................................................................………ii
COPYRIGHT...............................................................................................................iii
DECLARATION..........................................................................................................iv
DEDICATION...............................................................................................................v
ACKNOWLEDGEMENT...........................................................................................vi
ABSTRACT.................................................................................................................vii
TABLE OF CONTENTS ………………………………………………………….viii
LIST OF TABLES ……………………………………………………………..…...xii
LIST OF FIGURES ………………………………………………………………..xiii
ABBREVIATIONS AND ACRONYMS …………………………………………xiv
CHAPTER ONE ………………………………………………….…………….……1
1.0 INTRODUCTION .……………………………………………………………...1
1.1 Background to the Research Problem ……………………………………….…….1
1.2 Statement of the Research Problem ………………………………………….……3
1.3 Research Objective …………………………………………………………..……3
1.1.3 General Research Objectives ……………………………………………………3
1.3.2 Specific Research Objectives ………………………………………………...…3
1.4 Research Questions…………………………………………………………...……4
1.4.1 General Research Question …………………………………………...….……4
1.4.2 Specific Research Questions ……………………………………….…….……4
1.5 Significance of the Study …………………………………………………….……4
1.6 Organization of the Study …………………………………………………………5
Page 9
ix
CHAPTER TWO
……………………………………………………………………….6
2.0 LITERATURE REVIEW ……………………………………………………….6
2.1 Overview …………………………………………………………………….……6
2.2 Conceptual Definition ……………………………………………………….……6
2.2.1 Employee Motivation …………………………………………………………...6
2.2.2 Employees Performance ………………………………………………………...8
2.3 Theoretical Literature Review …………………………………………………….8
2.3.1 Maslow’s Hierarchy of Needs …………………………………………………..8
2.3.2 Herzberg Two Factor Theory ………………………………………………….10
2.4 Empirical Literature Review …………………………………………………….10
2.4.1General Studies …………………………………………………………………11
2.4.2 Studies in African Countries …………………………………………………..15
2.4.3 Empirical Studies in Tanzania …………………………………………………17
2.5 Research Gap …………………………………………………………………….20
2.6 Conceptual and Theoretical Framework ………………………………………...21
2.7 Statement of Hypotheses ………………………………………………………...24
CHAPTER THREE …………………………………………………………….…..25
3.0 RESEARCH METHODOLOGY ………………………………………….…..25
3.1 Overview ……………………………………………………………………..….25
3.2 Research Strategies ………………………………………………………...…….25
3.2.1 Study Population ………………………………………………………..……..25
3.2.2. Study Area ………………………………………………………………….....25
3.3 Variables and Measurement Procedures ………………………………………...26
Page 10
x
3.3.1 Variables ………………………………………………………………………26
3.3.2 Measurement Procedure ……………………………………………………....27
3.4. Data Collection Methods ………………………………………………………28
3.4.1 Questionnaire ……………………………………………………………….....28
3.4.2 Validity of Instrument …………………………………………………………28
3.5 Data Processing and Analysis …………………………………………………...29
3.5.1 Data Preparation …………………………………………………………….....29
3.5.2 Reliability Tests ……………………………………………………………......29
3.5.3 Data Analysis ………………………………………………………………......30
CHAPTER FOUR ………………………………………………………………….31
4.0 FINDINGS AND DISCUSSION ………………………………………………31
4.1 Overview ………………………………………………………………………...31
4.2 Description of the Sample …………………………………………………….....31
4.3 Analysis of Motivation…………………………………………………………...32
4.3.1 Intrinsic Motivation by Gender………………………………………………...32
4.3.2 Intrinsic Motivation by Department …………………………………………...33
4.3.3 Intrinsic Motivation by Tenure ……………………………………………..….35
4.3.4 Extrinsic Motivation by Gender ………………………………………….……37
4.3.5 Extrinsic Motivation by Department ……………………………………..……38
4.3.6 Extrinsic Motivation by Tenure …………………………………………..……39
4.4 Analysis Employee Performance …………………………………………..……40
4.4.1 Employee Performance by Gender …………………………………….………40
4.4.2 Employee Performance by Department ………………………………..………40
4.4.3 Employee Performance by Tenure …………………………………….………41
Page 11
xi
4.5 Relationship between Employee Motivation and Employee Performance ...……42
4.6 Discussion of Findings …………………………………..………………………44
CHAPTER FIVE …………………………………………………………………..46
5.0 SUMMARY, CONCLUSION AND RECOMMENDATIONS …………….46
5.1 Introduction ……………………………………………...………………………46
5.2 Summary of Key Findings …………………………….…………………………46
5.3 Conclusion …………………………………………….…………………………47
5.4 Recommendations ……………………………………….………………………47
5.5 Areas for further Studies ……………..………………………………………….48
REFERENCES …………………….……………………………………………….49
APPENDICES……………………………………….………………………………54
LIST OF TABLES
Table 3.1 Reliability Analysis Results.…………………………………………….
…..29
Table 4.1 (a) Sample Description …..…………………………………………….
…….32
Page 12
xii
Table 4.1 (b) Descriptive Statistics
…………………………………………………….32
Table 4.2 Intrinsic Motivation by Gender
……………………………………………...34
Table 4.3 Intrinsic Motivation by Department …………………………………………
35
Table 4.4 Intrinsic Motivation by Tenure …………………………………….
………...36
Table 4.5 Extrinsic Motivation by Gender …………………………….
……………….37
Table 4.6 Extrinsic Motivation by Department ………………………………….
……..38
Table 4.7 Extrinsic Motivation by Tenure
…………………………………………......39
Table 4.8 Employee Performance by Gender …………………………………….
…….40
Table 4.9 Employee Performance by Department
……………………………………..41
Table 4.10 Employee Performance by Tenure …………………………………………
41
Table 4.11 Correlation Results …………………………………………………………
42
Table 4.12 Regression Results …………………………………………………………
43
Page 14
xiv
LIST OF FIGURES
Figure 2.1: Hierarchy of Needs by Maslow …….…………………..………………. …
9
Figure 2.2: Research Framework on the Relationship of Motivation ….…………..
…..21
Page 15
xv
LIST OF ABBREVIATIONS AND ACRONYMS
HOPAC Haven of Peace Academy
HOPT Haven of Peace Trust
HRM Human Resource Management
OUT Open University of Tanzania
FBM Faculty of Business Management
SPSS Statistical Package for Social Sciences
UK United Kingdom
SD Standard Deviation
IB International Baccalaureate
MNH Muhimbili National Hospital
DMO District Medical Officer
Page 16
1
CHAPTER ONE
1.0 INTRODUCTION
1.1 Background to the Research Problem
Motivation is a key factor in the organization’s achievement. In order to obtain better
performance, motivation must be accorded appropriate priority level and employed
properly as a vital ingredient for organizational progress and survival especially in this
competitive era. Motivated employees help an organization to survive in the rapidly
changing markets. It is therefore, important that managers and organizational leaders
learn, understand and deal effectively with motivation. This is because motivated
employees tend to be committed, creative and loyal in such a way that they become
part and parcel to the organization. Kreisman (2002) argues that the most valuable and
volatile asset of any institution is a well-motivated and stable workforce which is
competent, dedicated and productive. Amabile (1993) on other hand, argues that de-
motivated employees are likely to put little effort in their jobs, avoid the workplaces
as much as possible, exit the organisation and produce low quality of work.
Other researchers like, Bonsu & Kusi (2014), Kiruja & Mukuru (2013) and Salleh,
Dzulkifli, Abdullah & Yaakob (2011), conducted studies on effects of motivation on
employees’ performance, and found that lack of employee’s motivation brings high
absenteeism and high cost to the employer. These studies are in agreement that
unmotivated employees underperform at work places.
Ahmad & Shahzad (2011) did a study to investigate the impact of three HR practices
on the perceived performance of the university teachers. Their findings was that the
Page 17
2
compensation practices in relation to the employees’ performance were significantly
positively correlated; whereby the performance evaluation and promotion practices
have insignificant relationship with the performance of university teachers in AJK
Pakistan.
Bonsu & Kusi (2014) for example, argues that employees prefer higher salaries as the
main incentive for higher job performance. They also found that the employees are
de-motivated by poor working conditions in the organization.
Kiruja & Mukuru (2013) using a sample of 315 employees in public middle level
technical training institutions in Kenya reported a statistically significant positive
correlation between employee motivation and their performance. Salleh et al (2011)
using the sample of 150 employees in state government in Malaysia. Reports a
significant positive relationship between motivation levels (achievement motivation,
power motivation, affiliation motivation and salary progression) and job performance.
While the empirical literature seen to be biased towards the Western environment
Cerasoli; Nickelin & Ford (2014) and Eastern environment, Inayatullah and Jehangir
(2012), Saleh, Dzulkifli and Yaakob (2011), Azar & Shafighi (2013), research
evidence is now emerging in Africa, for example, Kiruja and Mukuru (2013) in
Kenya’s public level middle technical institution and Bonsu & Kusi (2014) in Ghana.
In Tanzania little is known about the relationship between motivation and employee
performance. Few studies have looked at motivation in Tanzania for example
Manongi, Marcharoot & Byagbjerg (2006) among primary health care workers and
Page 18
3
Prytherch, Kakoko, Leshabari, Sallerborn and Marx (2012) among maternal and new-
born health care providers.
Haven of Peace Academy is an international missionary school which was established
in 1994 in Dar es Salaam by Haven of Peace Trust (HOPT) for the mission of
providing an excellent, Christ-centred international education that meets western
academic standards and equips students to live in a biblical worldview at all areas of
life to the glory of God.
So this research intends contribute evidence on the effect of motivation on employees’
performance among teaching and non-teaching staff at Haven of Peace Academy.
1.2 Statement of the Research Problem
The need to investigate the effect of motivation on employees’ performance at Haven
of Peace Academy was inevitable. This was forced with the current need of analysing
employees’ motivation across gender, job category and job tenure, analysing
employees’ performance across gender, job category and job tenure and analysing the
relationships between motivation and employee performance. The above pointed out
variables needed an effective investigation on the fact that employees at Haven of
Peace Academy show the symptoms related to absenteeism, de-motivation and
grudges.
Most of the studies conducted on the effects of motivation concentrated on the factors
of motivation, and where this is linked to employees’ performance, the evidence is
Page 19
4
biased towards Western and Eastern economies. Although there is a growing body of
knowledge in Africa, Tanzania is lagging behind. It is this paucity of empirical
evidence on the effect on motivation on employee performance that has motivated this
present study.
1.3 Research Objectives
1.3.1 General Research Objective
Generally, this study examined the effect of motivation on employees’ performance.
1.3.2 Specific Research Objectives
Specifically, the study was designed:
(i) To analyse employee motivation across gender, job category and job tenure
(ii) To analyse employee performance across gender, job category and job tenure
(iii) To assess whether there is a relationships between motivation and employee
performance
1.4 Research Questions
1.4.1 General research question
What is the effect of motivation on employee performance?
1.4.2 Specific research questions
(i) Do motivation levels of employee motivation differ across gender, job
categories or job tenure?
Page 20
5
(ii) Do the level of employee performance differ according to gender, job category
and job
tenure?
(iii) Does employee motivation levels affect their performance?
1.5 Significance of the Study
Haven of Peace Academy is unique school due its multiple characteristics of being a
school organized as Trustee, formed by the missionaries from different parts of the
world who are living in Tanzania, following the Cambridge curriculum controlled by
the UK government and supervised by the Tanzanian Ministry of Education and
Vocation Training. Therefore, the findings of this study would be vital in so many
ways.
First, it has revealed the extent to which employees at the school are motivated, their
performance as well as the relationship between motivation and employees’
performance.
Second, it should provide information to the main stakeholders mentioned as policy
makers and human resource managers of the school to formulate policies according to
motivation level of employees.
The findings send a clear message to school owners and managers that if they want to
improve performance of their employees they should ensure that the employees at all
levels are kept motivated.
Page 21
6
1.6 Organization of the Study
The rest of the dissertation is organized as follows: chapter two presents a view of
related literature, research gap, conceptual framework and statements of hypotheses.
Chapter three presents research methodology, chapter four presents findings and
discussions and chapter five present summary of key findings, implication,
conclusion, recommendation and areas for further studies.
Page 22
7
CHAPTER TWO
LITERATURE REVIEW
2.1. Overview
The purpose of this chapter is to present a review of literature on employee motivation
and performance. This chapter is organized as follows: Section 2.2 presents
conceptual definitions, Section 2.3 presents theoretical literature review, Section 2.4
presents empirical literature review, Section 2.5 present research gap, Section 2.6
present conceptual and theoretical framework and Section 2.7 presents statement of
hypotheses.
2.2 Conceptual Definitions
2.2.1 Employee Motivation
Motivation can be defined as the driving force that makes an individual to take some
actions in order to achieve certain goals. (Mullins, 2005). However, literatures
provided other definition of motivation as follows:
Rue (2003) narrates that motivation comes from the Latin word (movere) meaning to
move. From this estimology numerous definitions are given for the term. These
include words like aim desire, end, impulse, intention, objectives and purpose. The
definitions normally include the three characteristics of motivation. First motivation
is concerned with what activates human behaviour. Second motivation is concerned
Page 23
8
with what directs this behaviour to particular end. Third motivation is concerned with
how this behaviour is sustained.
Huczynski and Buchanan (2007) argued that motivation is a combination of goals
towards which human behaviour is directed; the process through which those goals
are pursued and achieved and the social factors involved. Mitchell (1982) on other
hand, says motivation is the degree to which an individual wants and chooses to
engage in certain specific behaviours.
The various needs and expectation at work can be categorised in a number of ways for
example the simple division into intrinsic and extrinsic motivation.
Extrinsic motivation is related to ‘tangible’ rewards such as salary and fringe benefits,
security, promotion, contract of service, the work environment and conditions of
work. Such tangible rewards are often determined at the organisational level and may
be largely outside the control of individual managers or employee. (Mullins, 2005).
Intrinsic motivation is related to ‘psychological’rewards such as opportunity to use
one’s ability, a sense of challenge and achievement, receiving appreciation, positive
recognition, and being treated in a caring and considerate manner. The psychological
rewards are those that can usually be determined by the actions and behaviour of
individual managers (Mullins, 2005).
Robbins (2010) defines motivation as the process that account for an individual’s
intensity, direction and persistence of effort toward attaining a goal. The three key
elements in the definition are intensity, direction and persistence. Intensity is concern
Page 24
9
with how hard a person tries. This is the element that most of us focus on when we
talk about motivation. However, high intensity is unlikely to lead to favourable job
performance outcome unless the effort is channelled in a direction that benefits the
organization. Therefore, we have to consider the quality of effort as well as its
intensity. Effort that is directed toward and consistent with the organization’s goal is
the kind of effort that we should be seeking. Finally, motivation has a persistence
dimension. This is a measure of how long a person can maintain effort. Motivated
individuals stay with a task long enough to achieve their goal.
2.2.2 Employees Performance:
Employees or job performance refers to behaviours that are relevant to organizational
goals and that are under control of individual employee. Other scholars for example,
Campbell (1990) defines employee performance as a behaviour which consists of
directly observable actions of a worker and also mental actions or products such as
answers or decisions, which result in organizational outcomes in the form of
attainment of set goals. However, Motowidlo (2003) argues that job performance is
“the total expected value to the organization of discrete behavioral episodes that an
individual carries out over a standard period of time”. According to Sturo (2007),
employee performance as the extent of completion of the tasks that make up an
individual’s job.
2.3 Theoretical Literature Review
This section briefly presents a review of motivation theories which include Maslow’s
Hierarchy of Needs and Herzberg Two-factor theory.
Page 25
10
2.3.1 Maslow's Hierarchy of Needs:
Maslow's hierarchy of needs theory posits that behavior at a particular moment is
determined by the strongest need. Maslow hypothesized five levels of needs:
physiological, safety, social, esteem, and self-actualization (Maslow 1954 and Lindner
1998). He placed them in a framework referred to as the hierarchy of needs because of
the different levels of importance. Maslow states that, if all needs are unsatisfied at a
particular time, satisfaction of the predominant need is most pressing. Those that
come first must be satisfied before a higher-level need comes into play.
This theory is related to this study as the employees needs and expectations change
over time to time. The employees’ performance therefore need a clear motivation plan
from general to self-actualization needs of each employee in the organization. Both
intrinsic and extrinsic motivation are affected by the motivation processes in an
organization. The organizations should consider that the needs of employees must be
paned as the employees needs change after time to time so as to maintain the
performance of an organization. The employers must consider employees’ safety,
social, esteem needs in the motivational process so as to make them reach at self-
actualization for the benefit of an organization. When the employees get one stage of
motivation it rise morale of performance but as time goes on that motivation become
no longer a motivator which affect the performance; hence organization should plan
for other motivation to make them increase performance. (Jerome 2013).
Page 26
11
Figure 2.1 Hierarchy of Needs by Maslow
2.3.2 Herzberg Two- factor theory
Herzberg et al (1959) two-factor theory is heavily based on need fulfilment because of
their interest in how best to satisfy workers. They carried out several studies to
explore those things that cause workers in white-collar jobs to be satisfied and
dissatisfied. They classified Hygiene Factors as dissatisfied and motivating factors as
satisfied. The hygiene factors are company policy and administration, technical
supervision, salary, interpersonal relationship with supervisors and work conditions;
they are associated with job content. The motivating factors are those factors that
make workers work harder and classified them as follows: achievements, recognition,
work itself, responsibility and advancement.
Page 27
12
The researcher agree with two factor theory of Herzberg (1959) which assess that for
the employee to be motivated all both motivators and hygiene must be available in the
organization to enhance employees’ performance. The theory is relevance to this
study as an organization should focus on motivators and hygiene as the factors of
motivation.
The employers should identify how to make employees be motivated for the
organization to perform. An organization should realize that if motivators and hygiene
factors of motivation are not well planned and provided in the organization, the
employees will be performing slowly hence lower productivity (Herzberg, 1959).
2.4 Empirical Literature Review
This part of the chapter reviews some of the studies that have been done relating to the
topic and see what they revealed on motivation and employee performance and what
are the gaps to be filled by the current study.
2.4.1. General Studies
Zameer, et al (2014) conducted a study on the impact of the motivation on the
employee’s Performance in the Beverage Industry of Pakistan. Questionnaire method
was used to collect data, five cities were selected and they distributed 150
questionnaire randomly to the beverage industries (Pepsi, Coke and Gorment).
Questionnaire were designed into two sections, the first section was personal profile
of the respondents which included their age, gender, marital status, education level
measured through a nominal scale. The second section was related to the questions
Page 28
13
relevant to variables which were motivation and employee’s performance measured
by a scale with ratings based on a five point Likert scale. The results showed that the
motivation in beverage industries of Pakistan significantly positively influence
performance of employees with beta value 0.537, with p. value of 0.000.
Salleh, et al (2011) did a study on the effect of motivation on employees’ performance
of state government employees in Malaysia. The study aimed at assessing the
relationship between motivation levels (achievement motivation, power motivation,
affiliation motivation and salary progression) and job performance. The research used
about 150 employees who were given questionnaires on job motivation and job
performance. Employees filled out the self-administered questionnaire. Each
statement was rated on a five-point Likert-type-scale. Statistical Package for Social
Science (SPSS) was used to run all statistical procedures. Scale tests were performed
on all scales and Cronbach’s alphas produced. The Cronbach’s alpha coefficient of
four variables ranged from 0.73 to 0.94 (coefficients 0.7 and above). The high alpha
coefficient indicate high internal consistency of all three predictors, with α = 0.84 on
achievement motivation, α = 0.82 on affiliation motivation, and α = 0.73 on power
motivation. These scores were acceptable according to Nunnally (1967) as cited in
Salleh et al (2011), who indicated that the benchmark should be 0.5. The results
suggest that affiliation motivation and job performance are positively related.
Uzonna (2013) conducted study on the impact of motivation on employees’
performance. The study was carried out within the workforce of the Credit West Bank
Cyprus. A centralised human resource department of the bank helped in conveying the
questionnaire to the 13 branches of the bank, and 134 respondents were handled with
Page 29
14
questionnaire. Quota sampling (employees of the Credit West) and simple random
sampling method were used to select target respondents for the study. Open ended
questionnaire was used for the pilot study and the result of the open ended
questionnaire was used to formulate the closed end structured questionnaire. The
questionnaire contained statements used to determine the non-monetary motivation
items: recognition, trainings, authority, and freedom, job autonomy, challenging work
schedules, job security, prestigious job titles and responsibility.
A second part contained statements used to determine monetary items such as fringe
benefits, money, bonuses, pensions, profit sharing and performance pay. Final part on
questions used to determine extraneous variables such as rewards and incentives, team
building activities, participation, and recognition of individual differences,
performance pay, enhanced communication and job enrichment. The statistical tools
used for the analysis of the questionnaire were frequency analysis, descriptive
analysis, ranking method, mean analysis (Attitudinal scale) and one sample T-test.
Cronbach’s alpha was used to assess the reliability of the instrument. The analysis
produced reliability coefficients of 0.8285 which is on the very high side. Total
motivation was statistically significant positively related to job performance.
Ahmad & Shahzad (2011) did a study to investigate the impact of three HR practices
on the perceived performance of the university teachers. 150 questionnaires were
distributed to the teachers, the questionnaires was self- administered. Employee’s
perceived Performance was measured using four items scale. The alpha coefficient
value for this scale was 0.71. Compensation practices was measured using six items
scale. The alpha coefficient value for this scale was 0.77. Promotion practices was
Page 30
15
measured using six items. The alpha coefficient value for this scale was 0.67. Findings
was that the compensation practices in relation to the employees’ performance were
significantly positively correlated; whereby the performance evaluation and
promotion practices have insignificant relationship with the performance of university
teachers in AJK Pakistan.
Inayatullah & Jehangir (2012) examined the effect of motivation on job performance
in public and private schools of Peshawar city in the Province of Khyber
Pakhtunkhwa. The collected data was analyzed through SPSS software. The study was
quantitative in nature and survey was conducted to acquire the view of the
respondents. A sample of ten schools were selected that included five private schools
and five public schools in Peshawar and the sample size of 120 teachers were
randomly selected from both public and private sectors. The research instrument
which was used to measure motivation of teachers contains 12 question items and 5-
point Likert scale was employed to record the responses. High scores indicated the
high level of teachers’ motivation towards job. Teacher’s job performance was
measured by using a self-developed questionnaire that contains 8 question items
which were developed to assess the job performance of respondents, a 5-point Likert
scale was exploited to record the responses. High scores represent the high level of
teachers’ job performance. Cronbach’s alpha was used for checking the reliability of
the research instruments. The scale reliability for scale of motivation was 0.630 that
signifies it is reasonably reliable. Performance was measured by 8 items and the
Cronbach’s alpha reliability of performance was 0.651 which implies acceptable
reliability because the alpha is greater than 0.60.
Page 31
16
The result indicate that motivation was found to be significantly different across
gender with F= .765, t= -2.101, p= .038. It means that motivation of female teachers
are high with Mean = 3.948 as compared to male teachers with Mean= 3.763.
The result indicate that significant difference was found in performance across gender
with F= .543, t= -2.646, p= .009 (p<.05). The job performance of female teachers are
greater with Mean= 3.970 and Standard deviation= .4729 as compared to male
teachers with Mean= 3.719 and Standard deviation= .5651.
The result indicate that significant differences of teacher’s motivation in public and
private schools with F=17.48, t= -2.461 and p= 0.016, p<0.05. It meant that there was
a significant difference in the mean score of motivation between public school
teachers and private school teaches. It was found that private school teachers had high
level of motivation with Mean= 3.968 and standard deviation= .6015 as compared to
public school teachers with Mean = 3.753 and Standard deviation = -.3123. The
analysis revealed that there was a positive relationship between teacher’s motivation
and job performance. As motivation increases, the level of performance also
increases.
The result indicate that significant differences of teacher’s job performance in public
and private schools with F=4.434, t= -3.729 and p= 0.000, p<0.05. It meant that there
was a significant difference from the mean score of job performance between public
school teachers and private school teaches. It was found that private school teachers
had high level of performance with Mean= 4.0229 and standard deviation= .60694 as
compared to public school teachers with Mean = 3.6792 and Standard deviation
= .37632.
Page 32
17
2.4.2. Studies in African Countries
Kiruja & Mukuru (2013) conducted the study seeking to establish the effect of
motivation on employee performance in Public Middle Level Technical Training
Institutions in Kenya. The study adopted a descriptive research design, sample size
was 315 targeting administrators, heads of department, teaching and non-teaching
staff. A structured questionnaire with likert scale ratings was used to collect data from
the respondents. An interview was also conducted with the administrators and heads
of department. The questionnaire was used to collect data on motivation and
employee performance. A Cronbach’s alpha coefficient was used to determine the
reliability of the instrument. Descriptive statistics such as percentage was used.
Correlation analysis was used to determine the effect of motivation on employee
performance. Analysis of variance (ANOVA) test was used to establish whether there
were statistically significant differences in motivation items among employees in
different groups/ job categories. Statistical Package for Social Science (SPSS) version
20 was used for analyzing the data. The findings furthermore found out that there was
a weak positive correlation between motivation and employee performance which was
statistically significant, (r (285) =.205, p<0.05). The positive coefficient means that
there is a direct relationship: when motivation increases, employee performance
increases and therefore motivation is an important predictor of employee performance
in public middle level technical institutions in Kenya.
Bonsu & Kusi (2014) examined the effects of motivation on job performance of local
government workers in Ghana, focused on District Assemblies Workers in Ashanti
Region. The study collected both qualitative and quantitative using case study
Page 33
18
research. The questionnaires were administered on a sample selected through simple
random sampling. The findings shown that employees prefer higher salaries as a main
incentive to higher job performance. The results show that workplace motivation
plays a key role for workplace productivity and quality. The researchers indicated the
lack of employees’ motivation brings high absenteeism and high cost. It was able to
find out that 40% of the employees were de-motivated due to poor working conditions
in the organization. The study also pointed out that currently employees are more
motivated by intrinsic factors rather than extrinsic. However, we cannot overlook both
in motivating employees.
Owusu (2012) examined the effects of motivation on employee performance in Ghana
Commercial Bank, Kumas Zone, whereby 24 branches and 7 division were covered.
The data collected by using questionnaire and interview methods. The author showed
that both intrinsic and extrinsic motivation factors were provided in the bank and
employees enjoyed. It was found most of the clericals prefer more extrinsic
motivation factors and managers preferred intrinsic motivation factors. However,
employees insisted that the quantity of the packages should be increased to enhance
performance hence achievement of the target. It is agreed that the joy of employees in
serving customers is very vital in the banking industry. The office premises must be
conducive for both the customers and the employees to enhance smooth business and
build a good image in the eyes of the public. Management must ensure that most
employees’ needs must be identified and satisfied to enhance performance.
Salleh, et al (2011) did a study on the effect of motivation on employees’ performance
of state government employees in Malaysia. The study aimed at finding the
Page 34
19
relationship between motivation levels (achievement motivation, power motivation,
affiliation motivation and salary progression) and job performance. The research used
about 150 employees who were given questionnaires on job motivation and job
performance. Employees filled out the self-administered questionnaire. Each
statement was measured on a five-point Likert-type-scale. Statistical Package for
Social Science (SPSS) was used for all statistical procedures. Scale test for reliability
were performed on all scales. The Cronbach’s alpha coefficient of four variables
ranged from 0.73 to 0.94 (coefficients 0.7 and above). The alpha coefficient indicate
high internal consistency of all three scales, with α = 0.84 on achievement motivation,
α = 0.82 on affiliation motivation, and α = 0.73 on power motivation. These scores
were acceptable according to Nunnally (1967) who indicated that the benchmark
should be 0.5. The results suggest that affiliation motivation and job performance
were positively related.
2.4.3. Empirical Studies in Tanzania
Lubuva’s (2008), study aimed at examining the effects of motivation on performance
in public organization in Tanzania, concluding the necessary improvement, to advice
on implementation of the changes based on the study and literature of the public
organizations. The study focused on Tanzania Postal corporate to represent public
organization and other three organizations were selected like FEDEX, DHL and
SCANDINAVIA for comparison. The information collected was used to generalize
the quality of services and motivation offered by the remaining organizations in
Tanzania. Managers and frontline employees of the selected firms were involved to
gather the required data.
Page 35
20
The researcher revealed that poor motivation, low pay, non-conducive working
environment, accountability and accumulated arrears are among the major problems
that hinder the public organizations system work efficiently. It leads to a number of
employees quit the public sector and join the private ones causing decline in the
quality of services, customers and hence less income. The study reveal that most of
the well qualified and competent personnel opt for private sectors due to good pay and
conducive working environments.
Manongi, et al (2006) conducted a study on improving motivation among primary
health care workers in Tanzania. The study aimed to explore the experiences of health
workers working in the primary health care facilities in terms of their motivation to
work, satisfaction and frustration, and to identify areas for sustainable improvement to
the services they provide.
The study adopted focus group discussion and interview methods were used to collect
data, sample was selected from each district a list of all health workers employed in
government dispensaries and health centres was obtained. The list was further
stratified to nurses and clinicians using a random table method, 12 nurses and 12
clinicians in each district were sampled and invited to participate in a focus group
discussion. Interview method was also used to collect data from District Medical
Officer (DMO) and management in which were taped-recorded and field notes were
taken. The participants were keen to discuss the issue of motivation and satisfaction
among health workers, division of labor, training, supervision and feedback and
promotion.
Page 36
21
From the main point of service providers identified that main factors which cause
demotivation among health care workers were workload paired with staff shortages,
lack of inter-professional exchange and lack of positive supervision, transparent career
goals, work environment. Physical infrastructure and equipment available to staff in
the primary health centres setting did sometimes affect morale and certainly services.
Overall the findings from these focus-group discussion indicate a need for individual
staff to feel valued and supported to develop in their roles.
Prytherch et al (2012) did a study on Maternal and newborn healthcare providers in
rural Tanzania, the study aimed to exploring influences on motivation, performance
and job satisfaction in Rural and Remote Health providers. The researcher used 25
MNH providers, 8 facility and district managers as well as 2 policy maker, interview
used as a method of collecting data.
The findings of this study was that the influences on MNH provider motivation,
performance and satisfaction were shown to be complex and to span different levels.
Variations in the use of terms and concepts pertaining to motivation were found, and
further clarification is needed. Intrinsic rewards play a role in continued provider
willingness to exert an effort at work. In the critical area of MNH and the rural setting
many providers, particularly auxiliary staff, felt poorly supported. The causes of
discouragement were broadly divided into those requiring renewed policy attention
and those which could be addressed by strengthening the skills of rural facility
managers, enhancing the status of their role, and increasing the support they receive
from higher levels of the health system. Given the increased reliance on staff with
lower-levels of training in rural areas, the importance of the latter has never been
Page 37
22
greater. Motivation was generally referred to as being fair or low. However, all types
of providers derived quite a strong degree of satisfaction, of an intrinsic nature, from
their work.
2.5 Research Gap
From the foregoing literature, researchers shows that there is significant positive
relationship between motivation and employee performance. But little consideration
has been done on studying employee’s motivation and performance in a Tanzanian
environment particularly in education sector. This study was designed to assess the
effect of motivation on employees’ performance where the data was collected and
analysed to generate information to shade more light on the subject in Tanzania.
While the empirical literature is biased towards the western (Cerasoli; Nickelin &
Ford, 2014) and Eastern environment, (Inayatullah and Jehangir, 2012; Salleh, et al
2011, Ahmad & Shahzad 2011), research evidence is now emerging in Africa, for
example, Kiruja and Mukuru (2013) in Kenya’s public level middle technical
institution and Bonsu & Kusi (2014 in Ghana. In Tanzania little is known about the
relationship between motivation and employee performance. Few studies have looked
at motivation in Tanzania for example Manongi, et al (2006) among primary health
care workers and Prytherch, Kakoko et al (2012) among maternal and newborn health
care providers.
On the other hand, HOPAC has multiple characteristics of being a school organized as
a trustee which is formed by the missionaries from different parts of the world who
are living in Tanzania. The school also follows the Cambridge curriculum controlled
Page 38
23
by the UK government and supervised by the Tanzanian Ministry of Education and
Vocation Training. With this number of stakeholders and the multiple factors
involved, it rises the need of studying this school to find out the extent to which
employees are motivated and whether their degree of motivation affect their
performance. Multiple stakeholders may influence motivation and performance of the
organization in such a way that HOPAC being under missionaries from different parts
of the World can support employees by providing some incentives. Also the
Tanzanians government is aware of the existing of such school and there are some
policies which guiding; in that case employees are motivated by being secured.
2.6. Conceptual and Theoretical Framework
Conceptual framework that shows the relationship between independent and
dependent variables also its gives its components.
Figure 2.2 Conceptual framework on the relationship of motivation towards
employees’ performance
Page 39
24
Source: Own Developed Model
i.) Independent Variables:
Motivation is taken as independent variable in this study. It has following
components that will be used to measure motivation which are divided into two
groups monetary and non-monetary. Adapted from Uzonna (2013).
Monetary (Extrinsic) Motivation:
a) Salary or wages
This is one of the most important motivational factors in an organization. Salaries and
wages should be fixed reasonably and paid on time.
b) Bonus
Bonus is an extra payment over and above salary, and it acts as an incentive to
perform better. It is linked to the profitability and productivity of the organization.
c) Financial incentives
The organization provides additional incentives to their employees such as medical
allowance, travelling allowance, house rent allowance, hard duty allowance and
children educational allowance.
d) Promotion (monetary part)
Promotion is attached with increase in pay, and this motivates the employee to
perform better.
Page 40
25
Non-monetary (Intrinsic) Motivation:
a) Status:
An employee is motivated by better status and designation. Organizations should offer
job titles that convey the importance of the position.
b) Appreciation and recognition:
Employees must be appreciated and reasonably compensated for all their
achievements and contributions.
c) Delegation:
Delegation of authority promotes dedication and commitment among employees.
Employees are satisfied that their employer has faith in them and this motivates them
to perform better.
d) Working conditions:
Healthy working conditions such as proper ventilation, proper lighting and proper
sanitation improve the work performance of employees.
e) Job enrichment:
This provides employees more challenging tasks and responsibilities. The job of the
employee becomes more meaningful and satisfying.
Page 41
26
f) Job security:
This promotes employee involvement and better performance. An employee should
not be kept on a temporary basis for a long period.
(g) Training:
This is a learning process in which employees acquire knowledge, skills, experience
and attitudes that enable them to achieve their organizational and individual goals
whereas employees development is a learning process, which is intended to enhance
an employee’s capacity to handle greater responsibilities successfully.
(h) Participation
Involvement of employees in decision making, goals setting, profit sharing, teamwork
and other such measures through which a firm attempts to foster or increase
employees’ commitment to collective objectives hence employee performance
increase.
2.7 Statement of Hypotheses
H1: There are no differences in employees’ motivation levels across gender, job
categories and job tenure groups.
Page 42
27
H2: There are no differences in employee’ performance across gender, job categories
and job tenure groups.
H3: There is no relationship between employees’ motivation levels and their
performance.
Page 43
28
CHAPTER THREE
RESEARCH METHODOLOGY
3.1 Overview
This chapter presents the research methodology used in the study, Section 3.2 presents
research strategies, Section 3.3 presents variables and measurement procedures,
Section 3.4 presents data collection methods, Section 3.5 presents data processing and
analysis and Section 3.6 represent reliability and validity of the data.
3.2. Research Strategies
Saunders et al (2007), defines research design as the general plan of how the research
questions would be answered. This study was of descriptive type and adopted across-
sectional survey questionnaire. A survey is a method of collecting data in which
people are asked to answer a number of questions in form of a questionnaire.
Therefore in this study the researcher prepared a survey questionnaire which was
distributed to the respondents who were required to answer them and treated as a self-
administered questionnaire, then the researcher collected them for data analysis.
3.2.1 Study Population
Heaven of Peace Academy contain about 80 employees from different countries,
among them there are teachers and non-teaching staff like managers and supervisors,
Therefore, the study targeted all employees because the population is very small.
Page 44
29
3.2.2 Study Area
This study was conducted at Haven of Peace Academy which located in Dar es
Salaam at Kinondoni Municipal Kunduchi ward. HOPAC is an international
missionary school which was established in 1994 in Dar es Salaam by Haven of
Peace Trust (HOPT) for the mission of providing an excellent, Christ-centred
international education that meets western academic standards and equips students to
live in a biblical worldview at all areas of life to the glory of God.
The researcher decided to use HOPAC as a study area so as to tap into the
multicultural workforce.
3.3 Variables and Measurement Procedures
3.3.1 Variables
The key variables on this study were motivation and employees’ performance.
Motivation is the driving force that makes an individual to take some actions in order
to achieve certain goals. It is categorized into two namely; extrinsic and intrinsic
motivation.
Extrinsic motivation is related to ‘tangible’ rewards such as salary and fringe benefits,
security, promotion, contract of service, the work environment and conditions of
work. Such tangible rewards are often determined at the organisational level and may
be largely outside the control of individual managers or employee. (Mullins, 2005).
Page 45
30
Intrinsic motivation is related to ‘psychological ‘rewards such as opportunity to use
one’s ability, a sense of challenge and achievement, receiving appreciation, positive
recognition, and being treated in a caring and considerate manner. The psychological
rewards are those that can usually be determined by the actions and behaviour of
individual managers (Mullins, 2005). On the case of intrinsic and extrinsic motivation,
the study found out of which type of motivation was highly influencing the
performance. Also on these variables the study wanted to know which one was
affecting the performance of an organization.
Employee performance is defined as a behaviour which consist of directly observable
actions of a worker and also mental actions or products such as answers or decisions,
which result in organizational outcomes in the form of attainment of set goals,
(Campbell, 1990).
Gender can be defined as culturally, socially and biological difference between men
and women.
Tenure refers to the period of service. Shows how long an employees had stayed at a
work place.
A department is specialized functional area within an organization. The departments
on this variable were two, namely non-teaching and teaching staff.
3.3.2 Measurement Procedure
Employee motivation was measured in two levels, intrinsic motivation and extrinsic
motivation. Intrinsic motivation was measured by 15 items scale with such items as
Page 46
31
“my contribution at work place is being recognized by the employer”. Extrinsic
motivation was measured by a 10 items scale with such items as “I am paid a salary
that is enough to cover my basic needs”.
Employee performance was measured by a 3 items scale with such items as “My
performance is comparable to that of other employees within my department”.
Responses to these items were captured on a 5-point Likert scale ranging from
1=strongly disagree to 5=strongly agree. The items were adapted from various
previous studies for example Tassema and Soeters (2009) for the employees
performance scale. The items for motivation scales were adapted from Aacha (2010).
Gender of respondents was captured by respondents indicating their gender, whether
male and female. Respondents were also asked to indicate their department, that is
whether they belong to teaching or non-teaching department. Job tenure was captured
by respondent ticking a time period to which he or she belongs to indicated range of
years he or she has worked at HOPAC. Time categories were “less than two years”,
“2-5 years”, “6 -10 years” and “above 10 years”
3.4 Data Collection Methods
This study used self-administered questionnaires to collect data.
3.4.1 Questionnaire
The researcher administered a questionnaire into two languages, English and
Kiswahili. Questionnaire with English language was for teaching staff and non-
teaching who understand English language and non-Swahili speakers, the Swahili
questionnaire administered to supporting staff. The questionnaire was divided into
Page 47
32
four sections namely; Section A; back ground information, Section B; intrinsic
motivation, Section C; extrinsic motivation, Section D; employee performance. Total
numbers of eighty questionnaires were distributed to all cadres. Seventy four of the
80 distributed questionnaires were filled and returned which represented a response
rate of 92.5 percent.
3.4.2 Validity of Instrument
Validity refers to the quality that a procedure or an instrument used in the research is
accurate, correct, true and meaningful (Enon, 1998). According to Kothari (1990)
validity is the most critical criterion which indicates the degree to which an instrument
measures what is supposed to measure. After the construction of questionnaire, the
researcher did a pilot on six respondents (three from teaching department and other
three from non-teaching) which was conducted to check whether the questions
constructed would supply the appropriate information, and to check if there were any
confusions in the way the researcher could make necessary amendment to the
questionnaires and remove ambiguities. The findings of the pilot study shown the
same results like those of the final findings. The selected sample of the pilot study did
not show any problem on understanding the questions. Hence the questionnaires were
adopted to the sample of the final findings.
Page 48
33
3.5 Data Processing and Analysis
3.5.1 Data Preparation
Coding was done on each items on the questionnaire. After that the data was entered
into SPSS. Frequency distributions and descriptive statistics were firstly used to
check the correctness of the entries analysis because the techniques are capable of
indicating data that are out of the expected range of possible entries for each statement
or question.
3.5.2 Reliability tests
Reliability refers to how consistent a research instrument was in measuring the
variables of interest where the measurement is scale-based and therefore means the
degree of internal consistency in the instrument of a study. (Saunder 2000). A scale
test was carried out to establish the internal consistency of the instrument. Cronbach’s
alpha coefficients were generated. These are presented in Table 3.1.
Table 3.1 Reliability Analysis Results
Scale No of items Cronbach’s Alpha
Intrinsic Motivation (IM) 15 0.919
Page 49
34
Extrinsic Motivation (EM) 10 0.629
Total Motivation (TM) 25 0.907
Employee Performance
(EP)
3 0.653
Source: Field data.
The results of reliability test in terms of internal consistency implies that the tool was
suitable for measuring the respective variables – intrinsic motivation, extrinsic
motivation, total motivation and employee performance. The total motivation attained
Cronbach’s Alpha of 0.907. This result higher than the comparable to that reported by
Aacha (2010) who used the same instrument and attained Alpha values of 0.753 on
the sample 135 primary school teachers.
3.5.3 Data Analysis
Descriptive statistics was used to determine frequency and to describe the variables
having aggregated the scales. Correlation analysis was used to determine the
relationship between motivation on employees’ performance scores. Analysis of
variance (ANOVA) test was used to establish whether there were statistically
significant differences in motivation items among employees in different groups.
Regression was done to determine the effect of between motivation on employee
performance.
Page 50
35
CHAPTER FOUR
FINDINGS AND DISCUSSION
4.1 Overview
This chapter presents and discusses the findings of the study. The chapter is
organized as follows: Section 4.2 which describes the sample. Section 4.3 presents
results of the analysis of motivation. Section 4.4 presents the results of the analysis of
employee’s performance. Section 4.5 presents the results of the analysis of the
relationship between motivation and employee’s performance. Section 4:6 discusses
the findings.
4.2 Description of the sample
Table 4.1(a) presents frequency and percentages of respondents per gender,
department and tenure. There were more male (51.4%) compared to female (48.6%).
The split represents the nature of employment at the school where there are more male
than female employees. There were more teaching staff (58.1%) than non-teaching
(41.9%). The split represent the nature of the employment at the school where the core
activity is teaching.
Table 4.1(a) also indicates that 36.56% of employees had worked at the school for
between two and five years; while 25.7% employees had worked at the school for less
than two years. Also it shows that 19.7% of employees had worked at the school for
between six and ten years. Employees who had worked at the school for more than ten
years are few; only 8.1%. The split represents the nature of employment at the school
Page 51
36
where most of the employees at this school are missionaries who work under contract
and it renewable after every two years.
Table 4.1(a) Sample description
N %Gender
Male
Female
38
36
51.4
48.6Department
Teaching
Non-teaching
43
31
58.1
41.9
Tenure
Less than 2 years
2– 5 years
6 – 10 years
Above 10 years
19
27
22
6
25.7
36.5
19.7
8.1
Source: Field data
The means (S.D.) intrinsic motivation and extrinsic motivation scores were 49.86
(12.96) and 28.99 (5.35) respectively. Total motivation score returned a mean (S.D)
of 78.58 (16.67); while the employee performance scale returned mean total score
(S.D.) of 9.77 (2.29).
Table 4.1(b) Descriptive Statistics
Page 52
37
N M S.D Min Max
Total Intrinsic Motivation 74 49.86 12.96 19 70
Total Extrinsic Motivation 74 28.99 5.35 16 43
Total Motivation 74 78.58 16.67 37 109
Total Employee Performance 74 9.72 2.29 3 15
Source: Field data
4.3 Analysis of Motivation
4.3.1 Intrinsic Motivation by Gender
Table 4.2 indicates that employee’s motivation level is very high due to the
environment, they feel enjoyable to work at HOPAC where total mean of 4.14 was
scored out of 5. Also employees were motivated by the employers’ recognition of
their contribution total mean of 3.89 was scored, in this results indicated that female
4.11 are more motivated than male 3.67.
However, the results indicates that employees are not motivated by how the school
management make decision as they are not involved. The mean score for this items
was 2.51. Also employees are not given an opportunity for both in house and external
training which de-motivate. See mean score 2.88 for this item. Employees also felt
that their expectations were never met since they joined this school. Mean score for
this item was 2.88.
Table 4.2 also presents results of analysis of intrinsic motivation by gender. Results
show intrinsic motivation did not differ significantly between male and female overall
Page 53
38
but female were significantly more motivated than male employees by the nature of
the job to stay in the profession.
Table 4.2 Intrinsic Motivation by Gender
Statements Total GenderM F T(p)
Overall HOPAC is an enjoyable place to work 4.14 4.00 4.26 -1.187(0.239)
My contribution at work place is being recognized by the employer
3.89 3.67 4.11 -1.865(0.066)
The challenging nature of my job has kept me in the profession
3.23 2.94 3.50 -1.993*(0.050)
Management-work relationship is encouraging enough
3.53 3.47 3.58 -0.385(0.708)
I have a chance for promotion and growth of my carrier
2.92 2.89 2.95 -0.210(0.834)
My job gives me recognition and respect from the community
3.45 3.53 3.37 0.594(0.554)
I have prospects for career development in my profession
3.38 3.22 3.53 -1.172(0.245)
I am given sense of responsibilities at work place
3.85 3.86 3.84 0.076(0.940)
The school clearly describes its goals and strategies
3.55 3.64 3.47 0.496(0.165)
My expectations about task or duty, was fulfilled after joining this school.
2.88 2.94 2.82 0.389(0.698)
There is formal communication system in this school
3.47 3.61 3.34 0.832(0.408)
There is relatively equal treatment of employees depending on their efforts, experience and education in this school
2.95 2.94 2.95 -0.008(0.993)
I am given opportunities to express myself about work related issues to top management
3.24 3.31 3.18 0.353(0.723)
I do participate in decision making in this school.
2.51 2.44 2.58 -0.415(0.680)
I am given an opportunity for both in house and external training by school
2.88 2.94 2.82 0.389(0.698)
Total scale 49.8649
49.4167
50.2895
0.288(0.774)
Source: Field data
* Significant at 0.05 level
Page 54
39
4.3.2 Intrinsic Motivation by Department
Table 4.3 represents results of the comparison of mean scores of intrinsic motivation items by
department. Overall teaching staff were significantly more intrinsically motivated than non-
teaching staff at 0.01 level. Moreover, based on individual items of the scale, teaching staff
were significantly more intrinsically motivated at 0.05 level than non-teaching staff in (i)
recognition of one’s contribution by employer, (ii) one’s expectations about task or duty being
fulfilled after joining the school; and at 0.01 in (i) encouraging management – work
relationship, (ii) clearly described school goals and strategies; (iii) formal communication
system in the school; (iv) presence of opportunities to express oneself; (v) opportunities to
participate in decision making and (vi) opportunities for both in house and external training.
Table 4.3 Intrinsic Motivation by Department
Statements Total Dept.T NT T (p)
Overall HOPAC is an enjoyable place to work 4.14 4.23 4.00 1.033(0.305)
My contribution at work place is being recognized by the employer
3.89 4.09 3.61 2.024*(0.047)
The challenging nature of my job has kept me in the profession
3.23 3.35 3.06 0.987(0.350)
Management-work relationship is encouraging enough
3.53 3.86 3.06 3.004**(0.004)
Page 55
40
I have a chance for promotion and growth of my carrier
2.92 2.98 2.84 0.489(0.626)
My job gives me recognition and respect from the community
3.45 3.60 3.23 1.409(0.163)
I have prospects for career development in my profession
3.38 3.37 3.39 -0.057(0.955)
I am given sense of responsibilities at work place 3.85 4.07 3.55 2.120*(0.037)
The school clearly describes its goals and strategies 3.55 4.00 2.94 3.251**(0.002)
My expectations about task or duty, was fulfilled after joining this school.
2.88 3.19 2.45 2.266*(0.026)
There is formal communication system in this school 3.47 3.88 2.90 3.182**(0.002)
There is relatively equal treatment of employees depending on their efforts, experience and education in this school
2.95 3.21 2.58 1.908(0.062)
I am given opportunities to express myself about work related issues to top management
3.24 3.79 2.48 4.179**(0.000)
I do participate in decision making in this school. 2.51 3.05 1.77 4.343**(0.000)
I am given an opportunity for both in house and external training by school
2.88 3.44 2.10 4.551**(0.000)
Total scale 49.865 54.1163 43.968 3.582**(0.001)
Source: Field data
* Significant at 0.05 level
** Significant at 0.01 level
4.3.3 Intrinsic motivation by Tenure
Table 4:4 shows a comparison of intrinsic motivation according to the period which staff
worked at the school. Overall, there are no significant differences in intrinsic motivation.
However, significant differences were evident in some of the items of the intrinsic motivation
scale. There were contribution recognition and prospects for career developments in one’s
Page 56
41
profession at 0.05 level and in opportunity for expressing oneself and participation in decision
making at 0.01 level.
Table 4.4 Intrinsic Motivation by Tenure
Statements Total Tenure<2 2 -5 6 -10 10 F(p)
Overall HOPAC is an enjoyable place to work
4.14 4.42 3.93 4.32 3.50 2.263(0.089)
My contribution at work place is being recognized by the employer
3.89 4.21 3.78 4.05 2.83 3.286*(0.026)
The challenging nature of my job has kept me in the profession
3.23 3.63 3.00 3.23 3.00 1.076(0.365)
Management-work relationship is encouraging enough
3.53 3.74 3.48 3.45 3.33 0.284(0.837)
I have a chance for promotion and growth of my carrier
2.92 3.16 2.67 3.05 2.83 0.744(0.529)
My job gives me recognition and respect from the community
3.45 3.42 3.33 3.50 3.83 0.324(0.808)
I have prospects for career development in my profession
3.38 3.84 2.93 3.50 3.50 2.875*(0.042)
I am given sense of responsibilities at work place
3.85 4.05 3.85 3.91 3.00 1.550(0.209)
The school clearly describes its goals and strategies
3.55 3.79 3.89 3.05 3.17 1.809(0.153)
My expectations about task or duty, was fulfilled after joining this school.
2.88 2.95 3.07 2.95 1.50 2.215(0.094)
There is formal communication system in this school
3.47 3.58 3.81 3.09 3.00 1.395(0.252)
There is relatively equal treatment of employees depending on their efforts, experience and education in this school
2.95 3.16 3.15 2.86 1.67 2.247(0.090)
I am given opportunities to express myself about work related issues to top management
3.24 3.74 3.74 2.55 2.00 5.781**(0.001)
I do participate in decision making in this school.
2.51 2.79 3.00 2.00 1.33 4.331**(0.007)
I am given an opportunity for both in house and external training by school
2.88 3.26 3.07 2.45 2.33 1.640(0.188)
Total scale 49.8649
53.74 50.7 47.96 40.83 1.789(0.157)
Source: Field data
Page 57
42
* Significant at 0.05 level
** Significant at 0.01 level
4.3.4 Extrinsic Motivation by Gender
Table 4.5 shows the level of extrinsic motivation between male and female. Overall,
there are no significant differences in extrinsic motivation between male and female.
However, significant differences were evident in one item of the extrinsic motivation
scale. This was provision of weekly duty allowance in which female were
significantly more motivated than their male counterparts.
Table 4.5 Extrinsic Motivation by Gender
Statements Total GenderM F T
I am paid a salary that is enough to cover my basic needs 2.35 2.39 2.32 0.277(0.783)
The school provides me with free accommodation 1.76 1.56 1.95 -1.383(0.171)
I get free meals at work 1.61 1.58 1.63 -0.221(0.826)
Salary payments are prompt 4.50 4.69 4.32 1.729(0.087)
The school offers weekly duty allowances 1.84 1.61 2.05 -2.183*(0.032)
In cases of my personal financial difficulties, the school is ready to step in and help.
3.20 3.42 3.00 1.444(0.153)
It is possible to get advance payment from the school in case I have financial problem.
4.03 4.17 3.89 1.296(0.199)
When I meet or exceed the set targets, I receive financial or non-financial reward.
2.31 2.22 2.39 -0.645(0.521)
I am given leave of absence in case I have a reason to justify it 3.82 3.81 3.84 -0.142(0.888)
The school provides me medical insurance that covers my immediate dependents.
3.57 3.81 3.34 1.371(0.175)
Total Scale 28.99 29.25 28.74 0.410(0.683)
Page 58
43
Source: Field data
*Significant at 0.05 level
4.3.5 Extrinsic Motivation by Department
Table 4.6 shows a comparison of extrinsic motivation between teaching and non-
teaching. Overall, there are no significant differences in extrinsic motivation between
teaching and non-teaching. However, significant differences were evident in some
items of the extrinsic motivation scale. These were the school provide free
accommodation and salary is enough to cover basic needs whereby teaching staff
were more extrinsically motivated than non-teaching staff. On the other hand, non-
teaching staff were more extrinsically motivated than teaching staff by the provision
of medical insurance to cover the employee and his or her immediate family.
Table 4.6 Extrinsic Motivation by Department
Statements Total Dept.
T NT T(p)I am paid a salary that is enough to cover my basic needs 2.35 2.60 2.00 2.344*
(0.022)The school provides me with free accommodation 1.76 2.02 1.39 2.265*
(0.027)I get free meals at work 1.61 1.67 1.52 0.717
(0.476)Salary payments are prompt 4.50 4.47 4.55 -0.368
(0.714)The school offers weekly duty allowances 1.84 1.93 1.71 1.050
(0.287)In cases of my personal financial difficulties, the school is ready to step in and help.
3.20 3.40 2.94 1.578(0.119)
It is possible to get advance payment from the school in case I have financial problem.
4.03 4.14 3.87 1.263(0.211)
Page 59
44
When I meet or exceed the set targets, I receive financial or non-financial reward.
2.31 2.35 2.26 0.334(0.739)
I am given leave of absence in case I have a reason to justify it 3.82 3.86 3.77 0.330(0.742)
The school provides me medical insurance that covers my immediate dependents.
3.57 3.28 3.97 -02.041*(0.039)
Total scale 28.99 29.72 27.97 1.401(0.166)
Source: Field data
*Significant at 0.05 level
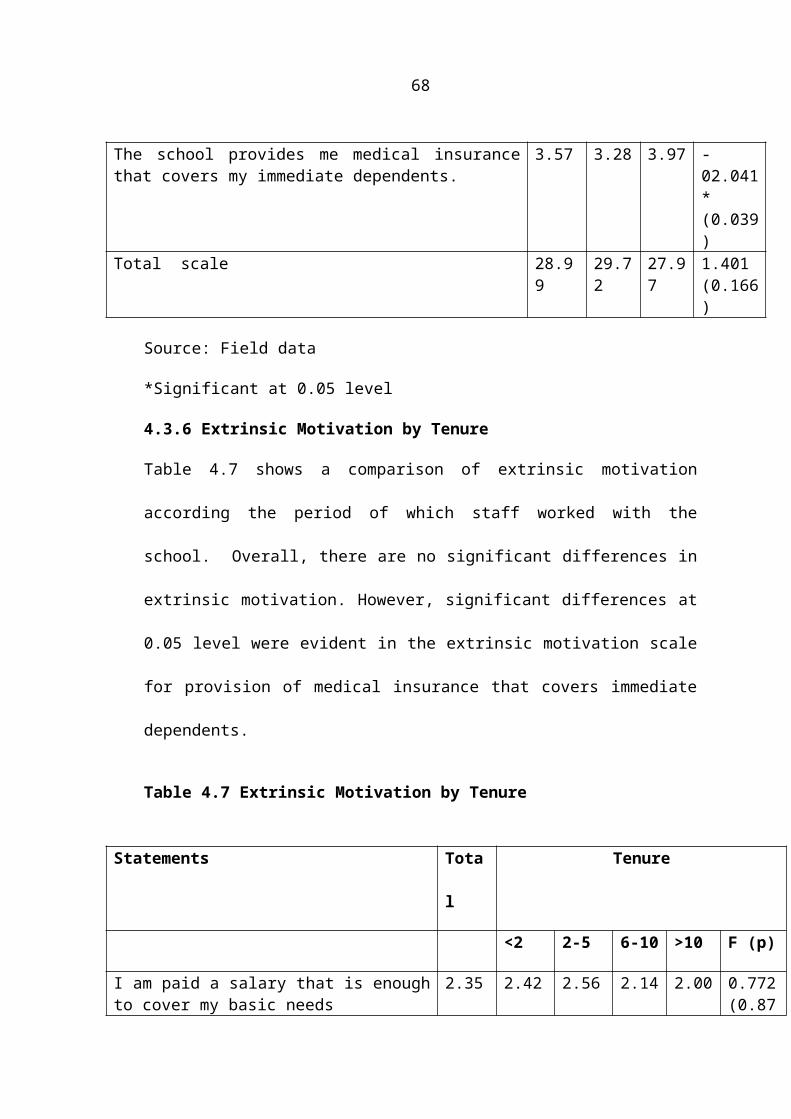
4.3.6 Extrinsic Motivation by Tenure
Table 4.7 shows a comparison of extrinsic motivation according the period of which
staff worked with the school. Overall, there are no significant differences in extrinsic
motivation. However, significant differences at 0.05 level were evident in the extrinsic
motivation scale for provision of medical insurance that covers immediate dependents.
Table 4.7 Extrinsic Motivation by Tenure
Statements Total Tenure
<2 2-5 6-10 >10 F (p)
I am paid a salary that is enough to cover my basic needs
2.35 2.42 2.56 2.14 2.00 0.772(0.876)
The school provides me with free accommodation
1.76 1.89 2.15 1.32 1.17 2.555(0.062)
I get free meals at work 1.61 1.47 1.78 1.64 1.17 0.878(0.457)
Salary payments are prompt 4.50 4.58 4.26 4.64 4.83 1.010(0.394)
The school offers weekly duty allowances 1.84 2.05 1.89 1.68 1.50 0.905(0.443)
In cases of my personal financial difficulties, the school is ready to step in and help.
3.20 3.16 3.30 3.36 2.33 1.156(0.333)
It is possible to get advance payment from the school in case I have financial problem.
4.03 4.00 4.00 4.05 4.17 0.062(0.980)
When I meet or exceed the set targets, I receive financial or non-financial reward.
2.31 2.11 2.48 2.23 2.50 0.486(0.693)
Page 60
45
I am given leave of absence in case I have a reason to justify it
3.82 3.84 3.81 3.91 3.50 0.212(0.888)
The school provides me medical insurance that covers my immediate dependents.
3.57 3.16 3.19 4.18 4.33 3.224*(0.028)
Total scale 28.99 28.68 29.41 29.14 27.5 0.229(0.876)
Source: Field data
*Significant at 0.05 level
4.4 Analysis of Employee Performance
4.4.1 Employee Performance by Gender
Table 4.8 presents results of employee performance. The mean scores of the items of
the scale varied from 3.22 to 3.26 with a total mean score of 9.72. It also shows
results of the comparison of mean scores in performance between male and female.
Overall there are no statistically significant differences in mean performance between
male and female.
Table 4.8 Employee Performance by Gender
Statements Total GenderM F T (p)
My performance is comparable to that of other employees within my department
3.26 3.25 3.26 -0.054(0.408)
My performance is at about the same level as that of employees with similar qualifications in my school.
3.24 3.39 3.11 1.202(0.233)
My performance is better than that of employees with similar qualifications in other schools of same calibre
3.22 3.31 3.13 0.820(0.415)
Total scale 9.72 9.94 9.5 0.832(0.408)
Source: Field data
Page 61
46
4.4.2 Employee Performance by Department
Table 4.9 presents the results of the comparison of mean performance scores between
teaching and non-teaching staff. Although there were no significantly differences in
performance between the two groups of employees. Overall, teaching staff rated
themselves significantly better than the non-teaching staff when comparing their
performance with that of other employees within same department.
Table 4.9 Employee Performance by Department
Statements Total Dept.
T NT T (p)
My performance is comparable to that of other employees within my department
3.26 3.58 2.81 3.352*
(0.003)My performance is at about the same level as that of employees with similar qualifications in my school.
3.24 3.33 3.13 0.818
(0.416)My performance is better than that of employees with similar qualifications in other schools of same calibre
3.22 3.14 3.32 -0.851
(0.397)Total scale 9.72 10.05 9.26 1.473
(0.145)
Source: Field data
Page 62
47
4.4.3 Employee Performance by Tenure
Table 4.10 presents results of the comparison of performance of employees across job
tenure groups. No significant differences in mean performance scores were found
across job tenure groups overall or in the individual scale items.
Table 4.10 Employee Performance by Tenure
Statements Total Tenure
< 2 2-5 6-10 10 F
My performance is comparable to that of other employees within my department
3.26 3.47 3.26 3.23 2.67 0.908(0.441)
My performance is at about the same level as that of employees with similar qualifications in my school.
3.24 3.63 3.07 3.14 3.17 1.277(0.289)
My performance is better than that of employees with similar qualifications in other schools of same calibre
3.22 3.00 3.15 3.59 2.83 2.092(0.109)
Total scale 9.72 10.11 9.48 9.95 8.67 0.769(0.515)
Source: Field data
4.5 Relationship between Employee Motivation and Employee Performance
Table 4:11 indicates that both intrinsic and extrinsic motivation positively correlated
with employees’ performance at the school with significant at 0.01 level. Moreover
total motivation scale was also found to be significantly positively related to employee
performance.
Table 4:11 Correlation Results
Page 63
48
N 1 2 3
1 Employee Performance (EP) 74 1.000
2 Intrinsic Motivation (IM) 74 0.592**(000)
1.000
3 Extrinsic Motivation (EM) 74 0.493**(0.000)
0.600**(0.000) 1.000
4 Total Motivation 73 0.615**(0.000)
0.966**(0.000)
0.790**(0.003)
** Significant at 0.01 level
Source: Field data
Table 4.12 presents regression results where employees’ performance is the dependent
variable and total motivation is the independent variable (panel A). In addition,
intrinsic motivation and extrinsic motivation were treated separately as independent
variables and the model was re-estimated. (See panel B).
From the results in panel A, the model fit results shows that it is capable of predicting
employees’ performance (F statistics = 43.148; p = 0.000) where total motivation is
shown to explain up to 36.9 percent of the variability in employee performance.
The coefficient for total motivation is 0.084 and is statistically significant at 0.01
level. This implies that motivation significantly affects employees’ performance
positively.
From panel B, it is shown that when both intrinsic motivation and extrinsic motivation
are loaded in the regression as separate in dependent variables their respective
coefficients are positive implying that each is positively related to employees’
performance. However, the coefficient for extrinsic motivation is insignificant. This
shows that it is the intrinsic motivation that significantly positively influence
employees’ performance.
Page 64
49
Table 4:12 Regression Results
Parameters Coefficient S.E. T P
Panel A:
Constant 3.079 1.033 2.982** 0.004
Total
Motivation
0.084 0.013 6.569** 0.000
Source: Field data
Adjusted R-squared 0.369
F(1) = 43.148, p = 0.000
Parameters Coefficient S.E. T P
Panel B:
Constant 2.965 1.190 2.491* 0.015
Intrinsic Motivation 0.082 0.021 3.969** 0.000
Extrinsic Motivation 0.092 0.050 1.840 0.070
Adjusted R-squared 0.363
F(2) = 21.8; p = 0.000
* Significant at 0.05
** Significant at 0.01
Source: Field data
Page 65
50
4.6 Discussion of Findings
On the case of gender, the results show intrinsic motivation did not differ significantly
between male and female overall. However, female were significantly more motivated
than male employees by the nature of the job to stay in the professional.
Overall teaching staff was significantly more intrinsically motivated than non-teaching staff at
0.01. Moreover based on individual items of the scale, teaching staff were significantly more
intrinsically motivated at 0.05 level than non-teaching staff. This was due to the fact that the
core activity of the organization was provision of education and teachers were given more
priority by the management rather than non-teaching staff.
On other hand, the comparison of intrinsic motivation according to the period which
staff had worked at the school. Overall, this shows no significant differences in
intrinsic motivation. However, significant differences were evident in some of the
items of the intrinsic motivation especially for employees who stayed at the work
place longer were less motivated than those who stayed for short period of time.
In performance across gender, overall there are no statistically significant differences
in mean performance between female and male. This was due to the mean score
viewed from 3.22 to 3.26 with a total mean score of 9.72.
Performance across department teaching and non-teaching staff. Although there was
no significantly difference between the groups. But overall teaching staff rated
themselves as better performer than non-teaching.
Page 66
51
In job tenure groups, the performance comparison showed that there was no
significant differences or individual.
The study also reports significant positive effect of total motivation on employee
performance. The results on this study agreed with the findings which were reviewed
literature like, Inayatullah and Jehangir (2012) who also found significant relationship
among motivation and performance in public and private school teachers. As well as
Kiruja and Mukuru (2013) who found that there is director relationship between
motivation and employees’ performance. Therefore motivation affect employees’
performance.
Page 67
52
CHAPTER FIVE
SUMMARY, CONCLUSION AND RECOMMENDATIONS
5.1 Introduction
This study aimed at examining the effect of motivation on employee’s performance
whereby 74 employees at HOPAC were subjects of study. A questionnaire was
distributed to 80 employees out of which 74 usable questionnaires were captured
using 15-items (intrinsic motivation), 10-items (extrinsic motivation) and 3-items
(employees’ performance) scales respectively with a Likert scale type of rating
ranging from 1-strongly disagree to 5 strongly agree. Descriptive statistics,
comparison of means (independent sample t-test and ANOVA), correlation and
regression analysis were employed to test the hypotheses. This chapter summarize the
findings and draw conclusions based on the findings and makes some
recommendations as well as suggesting the future areas of research.
5.2 Summary of key findings
Statistically significant differences were found in intrinsic motivation between
teaching and non- teaching staff specifically in recognition, goal clarity, training and
development, decision making, and freedom of expression items.
No statistically significant differences in intrinsic motivation were found across
gender and job tenure categories and in extrinsic motivation and employees’
performance across all demographic categories under study.
Page 68
53
Total motivation statistically significantly affected employee motivation but when
intrinsic and extrinsic motivation were loaded as separate independent variables into
the regression model, only the coefficient of intrinsic motivation was statistically
significant. This suggests that employees’ performance at HOPAC is significantly
influenced by intrinsic rather than extrinsic motivation.
5.3 Conclusion
From the findings, it can be concluded as follows:
Intrinsic motivation differ between teaching and non-teaching staff, extrinsic
motivation does not.
Extrinsic motivation of teaching staff is as good as that of non-teaching staff and does
not differ by gender or by length of service.
Employee performance does not differ by gender, department or length of service.
Motivation significantly affects employees’ performance but the effect comes from
intrinsic motivation.
5.4 Recommendations
The management should have a balance treatment on both groups teaching and non-
teaching because all of them have important to the development of an organization.
Management should therefore involve all employees to brainstorm issues affecting the
school so as to find a lasting solution to such problems. Once all are involved in
Page 69
54
finding a solution, it is expected that all would be motivated to get involve in solving
such problem and hence, encouraging team working and this will increase
productivity.
It is therefore recommended that HOPAC should balance practices which enhance
intrinsic motivation between teaching and non-teaching staff specifically on equal
recognition, management work relationship, creation of sense of responsibility, goal
and task clarity, organizational communication, opportunities to express oneself,
opportunities for training and for participating in decision making. It is also
recommended that HOPAC should engage in activities which boost motivation, but
more specifically intrinsic motivation if it wants to maximize employees’
performance.
5.5 Areas for further studies
The research and therefore its findings are limited to HOPAC with its set up; which is
both religious based and delivers Cambridge- Accelerated Christian Education.
Therefore the findings may be generalized to neither private religious schools nor
private schools. Therefore basic extension are possible. (i) Extension of the sample to
include all schools that deliver Cambridge curriculum this will allow for comparison
between religious and non -religious schools. (ii) Extension to include other private
local curriculum delivering schools. This will allow comparison between the schools
in (i) and other private schools. (iii) Extension to include public schools which will
allow comparison between Cambridge cum religious schools and public schools may
lend on opportunity to unearth some organizational philosophies which may help in
Page 70
55
managing staff in public schools better and contribute to better education for all
Tanzanians.
Page 71
56
REFERENCES
Aacha, M. (2010). Effect of motivation and the performance of primary school
teachers in Uganda: Kimaanya-Kyabakuza Division, Masaka District.
Masters Dissertation, Makerere University Uganda.
Ahmad, S. & Shahzad, K. (2011). HRM and employee performance in Azad Jammu
and Kashmir University Pakistan. African Journal of Business Management.
5(13), 5249-5253.
Akah, N. W. (2010). Employee motivation and performance in Ultimate Companion
Limited, Douala-Cameroon, Master’s Degree Dissertation, Mikkeli University
of Applied Science.
Amabile, T .M. (1993). Motivational synergy: toward new conceptualizations of
intrinsic and extrinsic motivation in the workplace. Human Resource
Management Review, 3(3) 185-201
Campbell, J. P. (1990). Modelling the performance prediction problem in industrial
and organization psychology, in M.D. Dunnette and L.M. Hough (Eds).
Handbook of Industrial and Organizational Psychology, pp 687-732. Palo
Alto, C.A, Psychologists Press, Inc.
Bonsu, C. & Kusi, A. (2014). Effects of motivation on job performance of local
government workers in Ghana: International Journal of Management
Sciences, 2, (8), 337-350
Page 72
57
Fauzilah, S., Zaharah, D., Wan, A & Nur, H. (2011). The effect of motivation on job
performance of state government employees in Malaysia; International
Journal of Humanities and Social Science. 1 (4), 147-154
Guba, E. G, & Lincoln, Y. S. (1994). Competing paradigms in qualitative research.
In N. K. Denzin& Y. S. Lincoln (Eds.), Handbook of qualitative research
(pp. 105-117). London: Sage.
Hashim, Z., Shehzad, A., Waqar, N., & Muhammad, A. (2014). The Impact of
motivation on the employee’s performance in Beverage Industry of Pakistan.
International Journal of Academic Research in Accounting, Finance and
Management Sciences. 4, (4), 293-298
Herzberg, F, Mauser, B. & Snyderman, G. (1959). The motivation to work. New York:
John Wiley
Huczynski, A. & Buchanan, D. (2007). Organisational behaviour, an introductory
text, prentice Hall 6th Ed.
Inayatullah, A. & Jehangir, P. (2012). Teacher’s job performance in public and
private schools, Peshawar city, Khyber Pakhtunkhwa. Abasyn Journal of
Social Sciences 5(2). Pp 78-99.
Jerome, N. (2013). Application of the Maslow’s hierarchy of need theory; impacts and
Page 73
58
implications on organization culture, human resource and employee’s
performance; International of Business and Management Invention, 2(3) pp39-
45.
Kiruja, E. & Mukuru, E. (2013). Effect of motivation on employee performance in
public middle level technical training institutions in Kenya. International
Journal of Advances in Management and Economics. 2, (4) pp 73-82.
Kothari, C. R. (2004). Research methods: methods and techniques. 2nd revised edition.
New Delhi: New Age International (P) Limited.
Kreisman, C. (2002). Insights into employee retention, commitment and motivation.
New York: John Wiley and Sons. Inc.
Lubuva, K. (2008). The effect of motivation on the performance of public and private
organizations in Tanzania: A Comparative Analysis of Tanzania Posts
Corporation, Fedex, Scandinavia and DHL. Masters Dissertation, Open
University of Tanzania.
Malik, M. E., Ghafoor, M. M. & Naseer, S. (2011). Organizational effectiveness. In
telecommunication and banking sector of Pakistan, Far East, Journal of
Psychology and Business. 2 (4) pp 297-333.
Manongi, R., Machant, & Bygbjerg, C. (2006). Improving Motivation among primary
health care workers in Tanzania: Human Resource for Health 4(6.) pp 1-7.
Page 74
59
Maslow, A. (1954). As cited in Cong N. N, VAN D.N., & Huu T. H. (2013). Effects
of motivation on employee’s performance: At Petrovietnam Nghe. An
Construction joint stock corporation 2,(2), 160-164.
McKenna, E. F. (2000). Business psychology and organisational behaviour: A
Student's Handbook. Hove: Psychology Press.
Mitchell, T. R. (1982). Motivation: New directions for theory, research and practice,
The Academy of Management Review, 7, (1),80-88.
Motowidlo, S. J., (2003). Job performance. In Borman, W.C., D.R. Ilgen and R.J.
Klimoski (Eds.), Handbook of psychology: industrial and organizational
psychology. John Wiley, New York, pp: 39-53.
Mullins, L. J (2005). Management and organisational behaviour. 7th Ed. Prentice hall.
UK.
Pettinger, R. (2002). Introduction to management. 3rd Ed. New York. Palgrave
Publishers ltd.
Prytherch, H., Kakoko, D.C.V., Leshabari, M.T., Sauerborn, R. & Marx, M. (2012).
Maternal
and newborn healthcare providers in rural Tanzania: Muhimbili University of
Health and Allied Sciences, Dar es Salaam, Tanzania 12: 2072. (Online) 2012
Page 75
60
Rajput, A., Bakar, A. H. A., & Ahmad, M. S. (2011). Motivators used by foreign and
local banks in Pakistan, A Comparative Analysis; Journal of Academic
Research. 3. (2) pp 23-35.
Rue, M. (2003). Management skills and application, Boston McGrow Hill Irwin.
Salleh, Dzulkifli, Abdullah, & Yaakob (2011). The effect of motivation on job
performance of state government employees in Malaysia; International
journal of humanities and social science. 1 (4)
Saunders, M. N. K., Lewis, P. & Thornhill, A. (2009). Research methods for business
students. 5th edition. Harlow: FT Prentice Hall.
Sweeney, P. D. (1990). Distributive justice and pay satisfaction: A field test of an
equity theory prediction. Journal of Business and Psychology, 4 (3), 329-341.
Owusu, T. (2012).Examined the effects of motivation on employee performance: A
case study of Ghana Commercial Bank, Kumas Zone Ghana.
Uzonna, U. R. (2013). Impact of motivation on employees’ performance: A case study
of Credit West Bank Cyprus, Department of Rural Development and
Management, College of Humanities and Development Studies, China
Agricultural University, Beijing.
Vroom, V. (1966). Organizational choice: A study of pre- and post-decision process.
In Organizational behaviour and human performance. 9th ed. New Delhi:
Prentice- Hall of India.
Page 76
61
APPENDICES
Appendix I: Introduction
Dear Respondent,
I am Kajura, Siima Christian a post graduate student at the Open University of
Tanzania pursuing a Master of Human Resource Management programme. I am
conducting a survey on “Effect of Motivation on Employees Performance” in your
organization as part of the requirement of this course.
You are requested to fill this questionnaire which will benefit the organization, other
stakeholders and all of us. The purpose of this questionnaire is to gather data that will
be used to reach a conclusion and recommend appropriately.
Please note that any information you give will be treated with utmost confidentiality
and will be used solely for the purpose mentioned.
Thank you for your participation.
Kajura, Siima Christian
Page 77
62
Appendix II: Self-Administered Questionnaires which will be used to collect
data
Please do not indicate your name anywhere in this questionnaire
SECTION A: BACKGROUND INFORMATION
(Tick the right option or fill the right answer in the spaces provided)
How long have you been employed in this organization
Less than two years 2 – 5 years 6 – 10 years Above 10 years
Gender and Work Department
Gender Male Female
Department Teaching Non-teaching
SECTION B: INTRINSIC MOTIVATION
Page 78
63
B1. For each of the following statements, please indicate (by ticking) the extent to
which you agree them, using the following scale: (Strongly disagree - 1, disagree -
2, Neutral -3, Agree – 4 and Strongly Agree - 5).
Responses
Strongly
Disagree
Disagree Neutral Agree Strongly agree
1. Overall HOPAC is an enjoyable
place to work
2. My contribution at work place is
being recognized by the employer
3. The challenging nature of my job
has kept me in the profession
4. Management-work relationship is
encouraging enough
5. I have a chance for promotion and
growth of my carrier
6. My job gives me recognition and
respect from the community
7. I have prospects for career
development in my profession
8. I am given sense of responsibilities
at work place
9. The school clearly describes its
goals and strategies
10. My expectations about task or
duty, was fulfilled after joining this
Page 79
64
school.
11. There is formal communication
system in this school
12. There is relatively equal treatment
of employees depending on their
efforts, experience and education in
this school
13. I am given opportunities to express
myself about work related issues to top
management
14. I do participate in decision making
in this school.
15. I am given an opportunity for both
in house and external training by
school
SECTION C: EXTRINSIC MOTIVATION
C1. For each of the following statements about extrinsic motivation, please indicate
(by ticking) the extent to which you agree, using the following scale: (Strongly
disagree - 1, disagree - 2, Neutral -3, Agree – 4 and Strongly Agree - 5).
Statements
Responses
Strongly
disagree
Disagree Neutral Agree Strongly
agree
1. I am paid a salary that is enough to
cover my basic needs
2. The school provides me with free
accommodation.
3. I get free meals at work
4. Salary payments are prompt
Page 80
65
5. The school offers weekly duty
allowances
6. In cases of my personal financial
difficulties, the school is ready to step
in and help.
7. It is possible to get advance
payment from the school in case I
have a financial problem
8. When I meet or exceed the set
targets, I receive financial or non-
financial rewards
9. I am given leave of absence in case
I have a reason to justify it.
10. The school provides me medical
insurance that covers my immediate
dependents.
SECTION D: EMPLOYEES PERFORMANCE
D1. For each of the following statements, please indicate (by ticking) the extent to
which you agree with it, using the following scale: (Strongly disagree, disagree,
neutral, agree and strongly agree).
Statement Strongly
disagree
Disagree Neutral Agree Strongly
agree
1 My performance is comparable
to that of other employees
within my department.
2 My performance is at about the
same level as that of employees
with similar qualifications in my
school.
Page 81
66
3 My performance is better than
that of employees with similar
qualifications and rank in other
schools of same calibre.
THANK YOU FOR YOUR COOPERATION
VIAMBATANISHO
Kiambatanisho I: Utangulizi
Ndugu Mjibuji,
Mimi ni Siima Christian Kajura, mwanafunzi wa shahada ya pili ya Usimamizi wa
Rasilimali Watu katika Chuo Kikuuu Huria cha Tanzania. Kama sehemu ya masomo
yangu ninafanya utafiti juu “Athari ya Motisha katika Utendaji wa Wafanyakazi”.
Unaombwa kujaza dodoso hili ambalo litakuwa faida kwa shule, wadau wengine na
sisi kwa ujumla. Dhumuni la dodoso hili ni kukusanya takwimu ambazo zitatumika
katika kufikia hitimisho na kutoa mapendekezo yapasayo.
Tafadhali kumbuka kuwa taarifa zozote utakazotoa zitachukuliwa kwa Usiri mkubwa
na zitatumika tu kwa dhumuni lililotajwa.
Asante kwa ushirikiano wako.
Kajura, Siima Christian
Page 82
67
Kiambatanisho II: Dodoso la kujaza mtu binafsi ambalo litatumika kukusanya
takwimu.
Tafadhali usionyeshe jina lako sehemu yoyote katika dodoso hili
SECTION A: MAELEZO YA MSINGI
(Weka chaguo sahihi or jaza jibu sahihi katika nafasi iliyotolewa)
Ni kwa muda gani umeajiliwa katika shule hii?
Chini ya miaka miwili Miaka 2-5 Miaka 5-10 Zaidi ya miaka kumi
Jinsia na idara ya kazi
Jinsia Mwanaume Mwanamke
Idara Ualimu Siyo ya ualimu
SECTION B: MOTISHA YA NDANI
B1. Kwa kila moja ya kauli zifuatazo, tafadhali onyesha (kwa kuweka alama ya
vema) ni kwa kiwango gani una kubaliana nayo, kwa kutumia viwango
vifuatavyo: (Sikubaliani kabisa, sikubaliani, siko upande wowote, nakubaliana na
nakubaliana kabisa).
Page 83
68
Majibu
KauliSikubaliani kabisa
Sikubali
ani
Siko
upande
wowote
Nakubali
ana
Nakubali
ana
kabisa
1. Kwa ujumla HOPAC ni mahali
pazuri pa kufanyia kazi
2. Mchango wangu katika kazi
unatambuliwa na mwajiri wangu
3. Changamoto katika kazi yangu
imeniweka katika taaluma
4. Uhusiano na uongozi katika kazi
unatia moyo vya kutosha
5. Nina nafasi kwa ajili ya kuongezwa
cheo na kukua kitaaluma
6. Kazi yangu inanipa kutambuliwa na
kuheshimiwa na jamii
7. Nina matarajio ya kujiendeleza
kitaaluma
8. Ninapewa nafasi ya kuwajibika
sehemu yangu ya kazi
9. Shule inaeleza wazi malengo na
mikakati yake
10. Matarajio yangu kuhusu kazi au
wajibu yametimia baada ya kujiunga
na shule hii.
11. Kuna mfumo rasmi wa
mawasiliano katika shule hii
12. Katika shule hii wafanyakazi
tunachukuliwa kwa usawa kutegemea
Page 84
69
na juhudi na kiwango cha elimu na
ujuzi
13. Ninapewa nafasi ya kujieleza
kuhusiana na masuala ya kikazi katika
uongozi wa juu
14. Ninashirikishwa katika utoaji wa
maamuzi katika shule hii
15. Ninapewa nafasi ya mafunzo ndani
na nje ya shule
SECTION C: MOTISHA YA NJE
C1. Kwa kila moja ya kauli zifuatazo, tafadhali onyesha (kwa kuweka alama ya vema)
ni kwa kiwango gani una kubaliana nayo, kwa kutumia viwango vifuatavyo:
(Sikubaliani kabisa, sikubaliani, siko upande wowote, nakubaliana na nakubaliana
kabisa).
Kauli Majibu
Sikubaliani kabisa
Sikubali
ani
Siko
upande
wowote
Nakubali
ana
Nakubali
ana
kabisa
1. Ninalipwa mshahara unaotosha kugharamia mahitaji yangu ya msingi2. Shule inanipatia makazi bure.
Page 85
70
3. Shule inanipatia chakula cha mchana bure.4. Ninalipwa mshahara wangu kwa wakati 5. Shule inatoa posho ya majukumu kwa wiki 6. Nikiwa na matatizo binafsi ya kifedha shule ipo tayari kuingilia kati na kunisaidia.7. Shule inanipatia malipo ya awali ninapokuwa na matatizo ya kifedha 8. Ninapotimiza au kuvuka malengo yaliyowekwa ninapokea tuzo ya fedha au isiyo ya fedha9. Mimi ninapewa likizo ya kutokuwepo kazini kama ninatoa sababu ya kuridhisha.
10. Shule inanipatia bima ya matibabu mimi na watu wangu wakaribu wanao nitegemea.
SECTION D: UTENDAJI KAZI WA MFANYAKAZI
D1. Kwa kila moja ya kauli zifuatazo, tafadhali onyesha (kwa kuweka alama ya
vema) ni kwa kiwango gani una kubaliana nayo, kwa kutumia viwango
vifuatavyo: (Sikubaliani kabisa, sikubaliani, siko upande wowote, nakubaliana na
nakubaliana kabisa).
Kauli Sikubaliani kabisa
Sikubaliani
Siko upande wowote
Nakubaliana
Sikubaliani kabisa
1 Utendaji wangu unalinganishwa na wafanyakazi wengine katika idara yangu
2 Utendaji wangu ni karibia kiwango sawa na wafanyakazi wengine wenye sifa sawa na mimi katika shule yangu.
Page 86
71
3 Utendaji wangu ni bora zaidi kuliko wa wafanyakazi wengine wenye sifa kama zangu kwenye shule nyingine zilizo sawa na ya kwetu
NAKUSHUKURU KWA USHIRIKIANO WAKO