Stanford University – Facilities Design Guidelines SECTION 25 15 23 GRAPHICS PART 1 - General 1.1 SUMMARY A. Section includes the general requirements for graphic generation. B. Related Sections: 1. 25 12 23.....Client-Server Information/Database Integration 2. 25 15 00.....Building Control Systems Server Software 1.2 REFERENCES A. Refer to 25 00 00 Integrated Automation 1.3 DEFINITIONS A. Refer to 25 06 11 Integrated Automation Definitions 1.4 SYSTEM DESCRIPTION A. Provide software and labor for graphical representation of all systems specified. B. Show all hardware points, setpoints, integrated points as shown in drawings and as needed to properly control and monitor systems. 1.5 SUBMITTALS A. Stanford University has developed campus standards including detailed graphics templates (Px Graphic) contact Stanford University FESO for latest examples. B. Submit for Review: 1. Each graphic page shall be submitted for review and requires approval by Owner. 1.6 QUALITY ASSURANCE A. All graphics shall be rendered as N4 HTML 5 views. Any graphic page that depends on JAVA-based animated widgets, or in any way depends on any browser-side-applet shall not be acceptable. B. All graphic images shall be Scalable Vector Graphic (SVG) format. C. All widgets, overlaid on top of SVG images, shall be compatible with N4 HTML 5 views and shall scale at the same ratio as SVG images. For example, spectrum binding polygons shall scale at the same ratio as the February 2018 Page 1 of 41 2018 FDG Section 25 15 23
Transcript
Stanford University – Facilities Design Guidelines
SECTION 25 15 23
GRAPHICS
PART 1 - General
1.1 SUMMARY
A. Section includes the general requirements for graphic generation.
B. Related Sections:1. 25 12 23 Client-Server Information/Database Integration2. 25 15 00 Building Control Systems Server Software
1.2 REFERENCES
A. Refer to 25 00 00 Integrated Automation
1.3 DEFINITIONS
A. Refer to 25 06 11 Integrated Automation Definitions
1.4 SYSTEM DESCRIPTION
A. Provide software and labor for graphical representation of all systems specified.
B. Show all hardware points, setpoints, integrated points as shown in drawings and as needed to properly control and monitor systems.
1.5 SUBMITTALS
A. Stanford University has developed campus standards including detailed graphics templates (Px Graphic) contact Stanford University FESO for latest examples.
B. Submit for Review:1. Each graphic page shall be submitted for review and requires approval by Owner.
1.6 QUALITY ASSURANCE
A. All graphics shall be rendered as N4 HTML 5 views. Any graphic page that depends on JAVA-based animated widgets, or in any way depends on any browser-side-applet shall not be acceptable.
B. All graphic images shall be Scalable Vector Graphic (SVG) format.
C. All widgets, overlaid on top of SVG images, shall be compatible with N4 HTML 5 views and shall scale at the same ratio as SVG images. For example, spectrum binding polygons shall scale at the same ratio as the floorplan background SVG image. Any graphic page with widgets that do not resize at the same ratio as the SVG image(s), shall not be acceptable.1. Note. Some sample graphics below were created in Niagara 3.x and depict widgets that are
not compatible with N4 HTML 5 views.2. Note: Some N4 HTML 5 graphics features are still in development by Tridium. To fully meet
this specification, graphics for this project may require Contractor modifications to graphics during Warranty Period, upon release of future Niagara builds by Tridium.
D. Text fields, column header labels, button labels, etc. must be a text string. Mapping text strings, from Niagara string objects, is acceptable; mapping Niagara object names to text fields is not acceptable.
February 2018 Page 1 of 37 2018 FDG Section 25 15 23
Stanford University – Facilities Design Guidelines
E. Decimal precision. Unless indicated otherwise, point values shall use the following decimal precision. Temperatures and temperature setpoints: 1 decimal place. Airflow (CFM) and airflow setpoints: no decimal places. Water flow (GPM) and water flow setpoints: 1 decimal place. Duct static pressure (Inches Water Column) and duct static pressure setpoints: 2 decimal places. Building static pressure (Inches Water Column) and building static pressure setpoints: 3 decimal places. Humidity (%RH) and humidity setpoints: 1 decimal place.
F. All valve and damper output positions should be denoted as %OPEN
G. Provide consistency in measurement units.
H. Graphics for identical mechanical systems shall utilize relative ORD’s to minimize number of graphics. Graphics for identical mechanical systems that utilize absolute ORD’s are not acceptable.
I. All graphics shall conform to the Stanford Identity Design Guidelines.
J. All graphics shall conform to the Stanford University N4 standards document
K. Vendor names, logos, hyperlinks to vendor site, or other vendor identification or promotion, are not permitted on graphics.
L. Owner shall furnish sample Stanford Standard Graphics to ensure consistency of look and feel across all Niagara sites. 1. Stanford Standard Graphics, furnished to Contractor, are dynamic with programming code
embedded in the graphics. Contractor may not modify embedded programming code, variable ORD schemes, color schemes, spectrum binding weighting values, BQL queries, etc., in graphics, unless approved by Owner.
2. Screen captures of example Stanford Standard Graphics are depicted below.
PART 2 - PRODUCTS
2.1 NOT USED
PART 3 - EXECUTION
3.1 GRAPHIC GENERATION
A. Each graphic shall include all control points, devices and user adjustable setpoints/parameters associated with the system. All points, as specified in points list table, shall be displayed and adjustable in graphics.
B. User adjustable points, displayed on any graphic page, shall be identifiable by highlighting (turn blue) upon mouse over.
C. Provide links, in a “breadcrumb trail” navigation menu, that allow a user to logically navigate all graphics in a hierarchical manner.
D. There shall be only one graphic header file that shall be used as a “PX Include file” on all graphics required for the project.
E. Graphic Pages Required.1. At a minimum, all the example graphics depicted below, shall be included as part of the
project.2. Additional graphic pages may be required for a specific project.
F. Operator specific password access protection shall be provided for each application to allow the administrator to limit access to point control, display and data base manipulation capabilities as
February 2018 Page 2 of 37 2018 FDG Section 25 15 23
Stanford University – Facilities Design Guidelines
deemed appropriate for each user, based upon an assigned password. There shall be 6 access levels as defined below. 1. Super User – No restriction. Can set or override adjustable setpoints on graphics.2. Administrator – Full WebUI and Workbench access to Station except to files that can
potentially corrupt database. Can set or override adjustable setpoints on graphics. Can set passwords and add users.
3. Integrator - WebUI and Workbench access to Station. Same access level as Administrator except cannot set passwords and add users. Can set or override adjustable setpoints on graphics. Can change own user name, password and email address
4. Programmer – WebUI and Workbench access to Station. Same access level as Administrator except cannot set passwords and add users. Can set or override adjustable setpoints on graphics. Can change own user name, password and email address.
5. Operator – WebUi access only. View all graphics and override points only, no set point access, can acknowledge alarms. Can override adjustable setpoints on graphics. Can change own user name, password and email address.
6. Read Only – Read only WebUI access. Can change own user name, password and email address.
7. Scheduler – Read only WebUI access with ability to modify equipment schedules as required. Can change own user name, password and email address.
8. Owner will furnish a written matrix of Categories, Permissions and Roles that must be followed exactly.
G. All overrides are globally limited to a maximum of 96 hours.
3.2 COMMON FOR ALL GRAPHICS
A. Header:Header is one PX Include file for the entire project that shall appear on every graphic page. For efficiency of graphics maintenance, all links, labels, etc., shall be edited from only one instance of header. With the exception of Building Name, the header and each of the link buttons should appear exactly the same on all campus buildings.
February 2018 Page 3 of 37 2018 FDG Section 25 15 23
Stanford University – Facilities Design Guidelines
9. Label: Campus DDC: Link: ip:campusddc.stanford.edu|fox:|file:^px/DDCHome.px10. Label: (Building Name) Home; Link: Building Home page11. Label: Dashboard; Link: Unique custom Dashboard or Dashboard Selection Page specifically
for currently logged in User.12. Space for Bread Crumb Trail Menu Navigation (details below)13. Building Name14. Stanford Logo15. Note. Some sample graphics below were created in Niagara 3.x and depict Headers that are
missing the Dashboard Button
February 2018 Page 4 of 37 2018 FDG Section 25 15 23
Stanford University – Facilities Design Guidelines
B. Footer:Footer is one PX Include file for the entire project that shall appear on every graphic page. For efficiency of graphics maintenance, all links, labels, etc., shall be edited from only one instance of footer. Footer buttons shall vary by building depending on what mechanical equipment, etc. is being controlled in the building. The following is a typical example:
1. Label: Floor Plans; Link: Floor Plan Selection page2. Label: Main Mechanical; Link: Main Mechanical Equipment page3. Label: FCU Overview; Link: FCU Overview or FCU Overview Selection page (depending on
number of Fan Coil Units in building)4. Label: VAV Overview; Link: VAV Overview or VAV Overview Selection page (depending on
number of Variable Air Volume Terminal Units in building)5. Label: S.O.O; Link: Sequence of Operations (PDF format)6. Additional footer buttons may be required for each specific project
C. Bread Crumb Trail Menu Navigation:The “Bread Crumb Trail” Menu Navigation consists of dynamic buttons and links that appear as required by context to facilitate logical user navigation of the graphics. Graphics examples below shall indicate Bread Crumb Trail menu navigation buttons germane to each specific graphic page.
February 2018 Page 5 of 37 2018 FDG Section 25 15 23
Stanford University – Facilities Design Guidelines
3.3 HOME PAGE
A. The primary purpose of the building home page is to provide an Operator one place to quickly see the status of major equipment in the building and other critical, real-time information. The contents of the home page will vary by building depending on critical systems and mechanical equipment in that building. Typical systems include air handlers; building chilled water; building hot water, etc.
B. Home Page Example:
1. Header (No Bread Crumb Trail Menu buttons on Home Page)2. Preferred Typical System Summary. Air handler discharge air temperature, duct static
pressure, and supply fan status (point value and animated display). The entire box is a link to a more detailed display of system.
3. Alternate Typical System Summary. Air handler discharge air temperature, duct static pressure, and supply fan. The entire box is a link to a more detailed display of system.
4. Footer
February 2018 Page 6 of 37 2018 FDG Section 25 15 23
Stanford University – Facilities Design Guidelines
C. Another Home Page Example.
February 2018 Page 7 of 37 2018 FDG Section 25 15 23
Stanford University – Facilities Design Guidelines
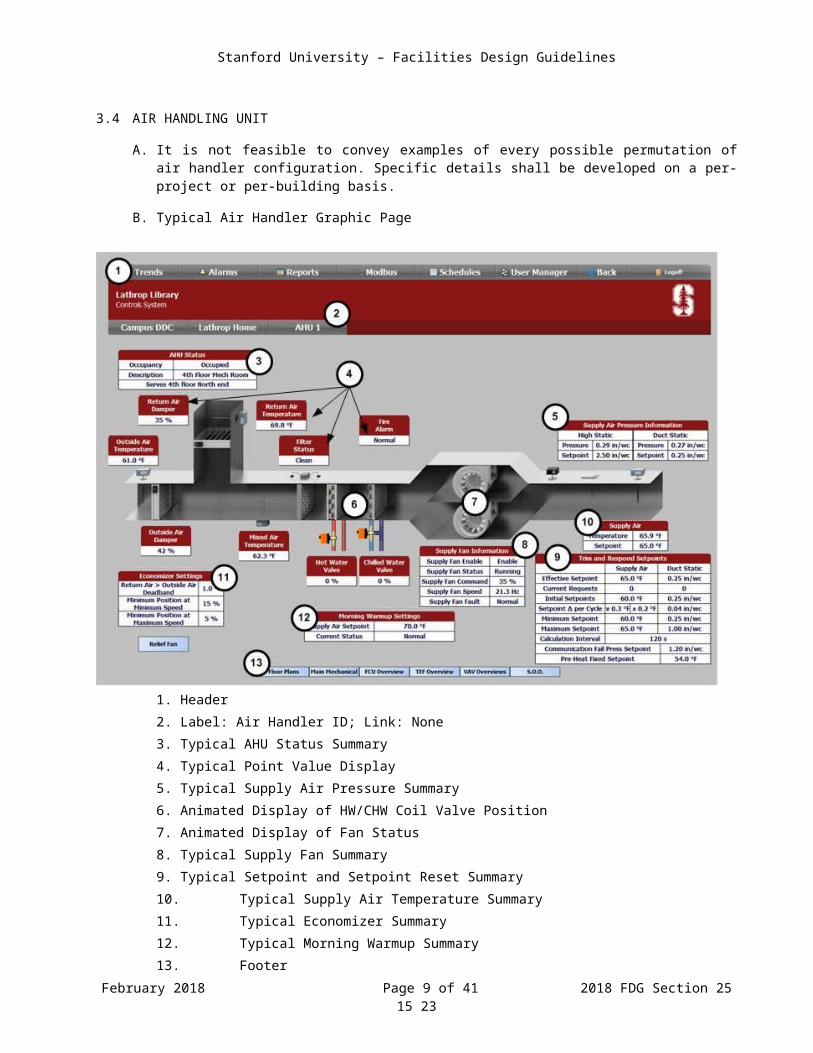
3.4 AIR HANDLING UNIT
A. It is not feasible to convey examples of every possible permutation of air handler configuration. Specific details shall be developed on a per-project or per-building basis.
B. Typical Air Handler Graphic Page
1. Header 2. Label: Air Handler ID; Link: None3. Typical AHU Status Summary4. Typical Point Value Display5. Typical Supply Air Pressure Summary6. Animated Display of HW/CHW Coil Valve Position7. Animated Display of Fan Status8. Typical Supply Fan Summary9. Typical Setpoint and Setpoint Reset Summary10. Typical Supply Air Temperature Summary11. Typical Economizer Summary12. Typical Morning Warmup Summary13. Footer14. Additional Points as required by project
February 2018 Page 8 of 37 2018 FDG Section 25 15 23
Stanford University – Facilities Design Guidelines
3.5 REQUESTS PAGE
A. The purpose of the requests page is to see the relationship of zone data and how that zone data is resetting air handler setpoints. Include graphic table for all Zone Requests for Air Handler Reset, by floor & by air handler.
B. Depending on equipment configuration, other related Trim & Respond (Reset) parameters.
C. The contents of the request page will vary by building depending on critical systems and mechanical equipment in that building.
D. If air handlers are controlled by Delta V, (as in this example) Requests Page may also serve double duty as AHU’s page.
1. Header2. Label: AHU’s (Requests); Link: None3. Typical System Summary. Air handler discharge air temperature, duct static pressure, and
supply fan status (point value and animated display). The entire box is a link to a more detailed display of system.
4. Air handler reset information. Static Pressure Requests, by Air Handler5. Air handler reset information. Cooling Requests, by Air Handler6. Air handler reset information. Heating Requests, by Air Handler7. Air handler reset information. CO2 Requests, by Air Handler8. Footer buttons
February 2018 Page 9 of 37 2018 FDG Section 25 15 23
Stanford University – Facilities Design Guidelines
3.6 VARIABLE AIR VOLUME BOX – NO REHEAT (COOLING ONLY)
A. Example Cooling Only VAV Box Graphic
1. Header2. Label: Floor that VAV box is located on; Link: Floorplan that VAV box is located on3. Label: Air Handler that serves VAV box; Link: Air Handler that serves VAV box or link to Air
Handler page4. Label: VAV box ID – Room Number; Link: None5. VAV status summary.6. Room number or ID of room that VAV thermostat is physically located in.7. Additional rooms served by VAV box.8. Reset Multiplier 9. Space to record notes about zone. See “Zones with Notes” report below10. If no sensor exists at the box (i.e. virtual point) Label: Zone Air Inlet Temp” do not show
sensor. See 1911. Animated display of damper position. 12. Discharge Air Temperature13. Ahu Information Summary Table14. Air Flow Status Summary Table15. Space Conditions Summary Table16. Air Flow Settings Summary Table.17. Footer18. Effective Temperature Setpoints Summary Table19. If sensor exists at the box, Label: Air Inlet Temp; show sensor. See 10
February 2018 Page 10 of 37 2018 FDG Section 25 15 23
Stanford University – Facilities Design Guidelines
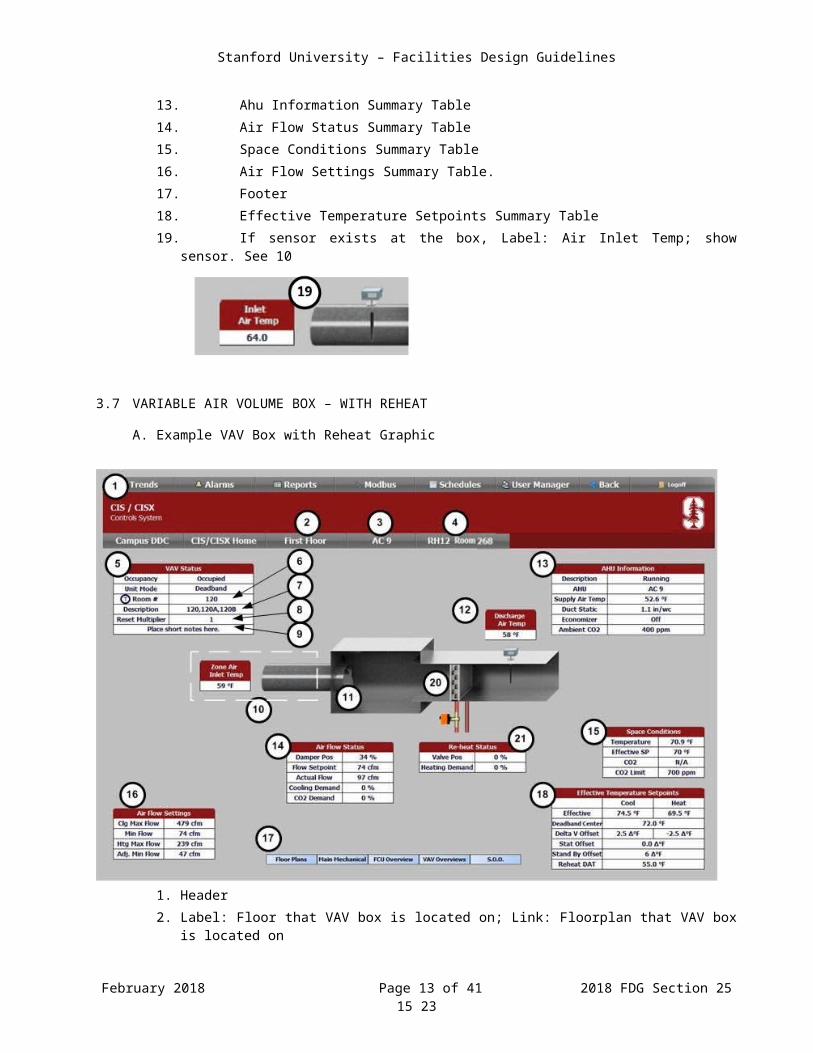
3.7 VARIABLE AIR VOLUME BOX – WITH REHEAT
A. Example VAV Box with Reheat Graphic
1. Header2. Label: Floor that VAV box is located on; Link: Floorplan that VAV box is located on3. Label: Air Handler that serves VAV box; Link: Air Handler that serves VAV box or link to Air
handler page4. Label: VAV box ID - Room Number; Link: None5. VAV status summary.6. Room number that VAV thermostat is physically located in.7. Additional rooms served by VAV box.8. Reset Multiplier 9. Space to record notes about zone. See “Zones with Notes” report below10. If no sensor exists at the box (i.e. virtual point) Label: Zone Air Inlet Temp” do not show
sensor. See 1911. Animated display of damper position. 12. Discharge Air Temperature13. Ahu Information Summary Table14. Air Flow Status Summary Table
February 2018 Page 11 of 37 2018 FDG Section 25 15 23
Stanford University – Facilities Design Guidelines
15. Space Conditions Summary Table16. Air Flow Settings Summary Table.17. Footer18. Effective Temperature Setpoints Summary Table19. If sensor exists at the box, Label: Air Inlet Temp; show sensor. See 10
20. Animated display of reheat coil valve position21. Reheat Status Summary Table
February 2018 Page 12 of 37 2018 FDG Section 25 15 23
Stanford University – Facilities Design Guidelines
3.8 LAB VARIABLE AIR VOLUME BOX – WITH EXHAUST
A. Example Lab VAV Box with Exhaust Graphic
1. Header2. Label: Floor that VAV box is located on; Link: Floorplan that VAV box is located on3. Label: Air Handler that serves VAV box; Link: Air Handler that serves VAV box or link to Air
handler page4. Label: Zone (Room Number); Link: None5. VAV status summary.6. Occupancy Status7. Unit Mode8. Room number that VAV thermostat is physically located in.9. VAV box Device ID.10. Reset Multiplier 11. Space to record notes about zone. See “Zones with Notes” report below12. Inlet Temperature. If no sensor exists at the box (i.e. virtual point) do not show sensor. 13. Animated display of damper position.14. Animated display of reheat coil valve position15. Discharge Air Temperature16. Ahu Information Summary Table17. Exhaust Air Valve18. Air Flow Status Summary Table19. Space Conditions Summary Table20. Reheat Valve Status Summary Table
February 2018 Page 13 of 37 2018 FDG Section 25 15 23
Stanford University – Facilities Design Guidelines
21. Space Conditions Summary Table.22. Effective Temperature Setpoints Summary Table23. Air Flow Settings Summary Table.24. Footer25. Additional Real-time Data Fields, as required by specific project
February 2018 Page 14 of 37 2018 FDG Section 25 15 23
Stanford University – Facilities Design Guidelines
3.9 FLOOR PLAN
A. Example Floorplan Graphic
1. Header2. Label: Floorplans; Link: Floorplan Selection Page3. Label: Specific Floorplan; Link: None4. Embellished Description of Floorplan (optional, as required).5. T-stat location, static but editable from Niagara graphics editor. Shall not require editing of
background image.6. Box level summary table with VAV box identification, space temperature, and identification of
the AHU serving the box. This table includes a navigation link to the specific VAV box.7. Typical animated spectrum binding of entire area served by VAV box to indicate zone
temperature. Zone color shall go from light blue to bright blue with greater deviation below effective setpoint and from light red to bright red with greater deviation above effective setpoint. Zones between heating and cooling setpoint shall be light grey. Each spectrum binding shape shall maintain approximately 10 pixel space to distinguish from adjacent spectrum binding shape to prevent confusion when both shapes are the same color. Entire spectrum binding shape shall be a navigation link to the specific VAV box. Upon mouse over, mouse cursor icon shall change from pointer to hyperlink.
February 2018 Page 15 of 37 2018 FDG Section 25 15 23
Stanford University – Facilities Design Guidelines
8. Room Number, static but editable from Niagara graphics editor. Modifying room number shall not require editing of background image.
9. Include box level summary table with box identification, space temperature, and identification of the AHU serving the box. This table includes a navigation link to the AHU.
10. Key Plan. Required when one level of building layout is split into multiple floor plan sections. Key Plan depicts current floor plan section, relative to entire floor plan. Lightened Key Plan Section(s) indicates additional sections of floorplan on same level and serves as link to those additional sections of floorplan.
11. Darkened Key Plan Section indicates section of floorplan currently being displayed.
February 2018 Page 16 of 37 2018 FDG Section 25 15 23
Stanford University – Facilities Design Guidelines
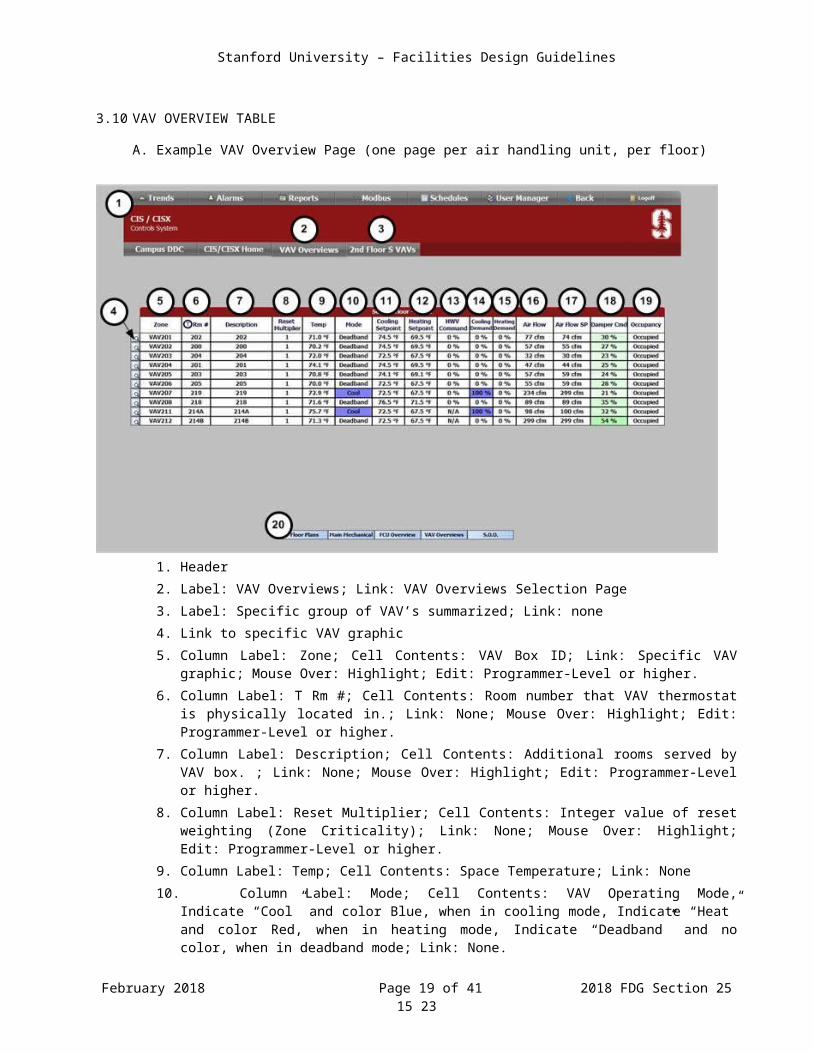
3.10 VAV OVERVIEW TABLE
A. Example VAV Overview Page (one page per air handling unit, per floor)
1. Header2. Label: VAV Overviews; Link: VAV Overviews Selection Page3. Label: Specific group of VAV’s summarized; Link: none4. Link to specific VAV graphic5. Column Label: Zone; Cell Contents: VAV Box ID; Link: Specific VAV graphic; Mouse Over:
Highlight; Edit: Programmer-Level or higher.6. Column Label: T Rm #; Cell Contents: Room number that VAV thermostat is physically located
in.; Link: None; Mouse Over: Highlight; Edit: Programmer-Level or higher.7. Column Label: Description; Cell Contents: Additional rooms served by VAV box. ; Link: None;
Mouse Over: Highlight; Edit: Programmer-Level or higher.8. Column Label: Reset Multiplier; Cell Contents: Integer value of reset weighting (Zone
Criticality); Link: None; Mouse Over: Highlight; Edit: Programmer-Level or higher.9. Column Label: Temp; Cell Contents: Space Temperature; Link: None10. Column Label: Mode; Cell Contents: VAV Operating Mode, Indicate “Cool” and color Blue,
when in cooling mode, Indicate “Heat” and color Red, when in heating mode, Indicate “Deadband” and no color, when in deadband mode; Link: None.
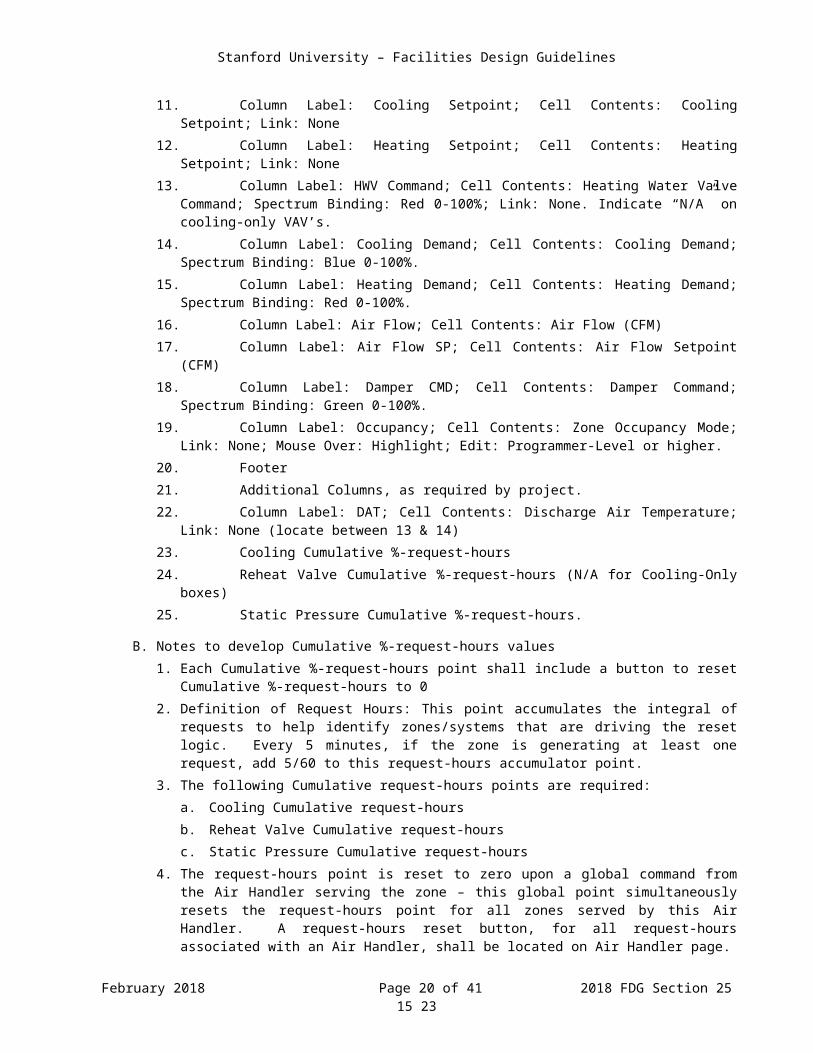
Highlight; Edit: Programmer-Level or higher.20. Footer21. Additional Columns, as required by project.22. Column Label: DAT; Cell Contents: Discharge Air Temperature; Link: None (locate between 13
B. Notes to develop Cumulative %-request-hours values1. Each Cumulative %-request-hours point shall include a button to reset Cumulative %-request-
hours to 02. Definition of Request Hours: This point accumulates the integral of requests to help identify
zones/systems that are driving the reset logic. Every 5 minutes, if the zone is generating at least one request, add 5/60 to this request-hours accumulator point.
3. The following Cumulative request-hours points are required:a. Cooling Cumulative request-hoursb. Reheat Valve Cumulative request-hoursc. Static Pressure Cumulative request-hours
4. The request-hours point is reset to zero upon a global command from the Air Handler serving the zone – this global point simultaneously resets the request-hours point for all zones served by this Air Handler. A request-hours reset button, for all request-hours associated with an Air Handler, shall be located on Air Handler page.
5. Cumulative %-request-hours is the zone request-hours divided by the zone run-hours (the hours that zone is in any Mode other than Unoccupied Mode) since the last reset, expressed as a percentage.
February 2018 Page 18 of 37 2018 FDG Section 25 15 23
Stanford University – Facilities Design Guidelines
3.11 LAB OVERVIEW
A. Example LAB Overview Graphic
1. Header2. Label: Specific Floor; Link: Specific Floor Plan Graphic3. Label: Specific AHU serving Labs; Link: Graphic for Specific AHU serving Labs4. Label: LAB Overview; Link: None5. Column Label: Zone; Cell Contents: Room Number of Zone; Link: Specific Zone graphic;
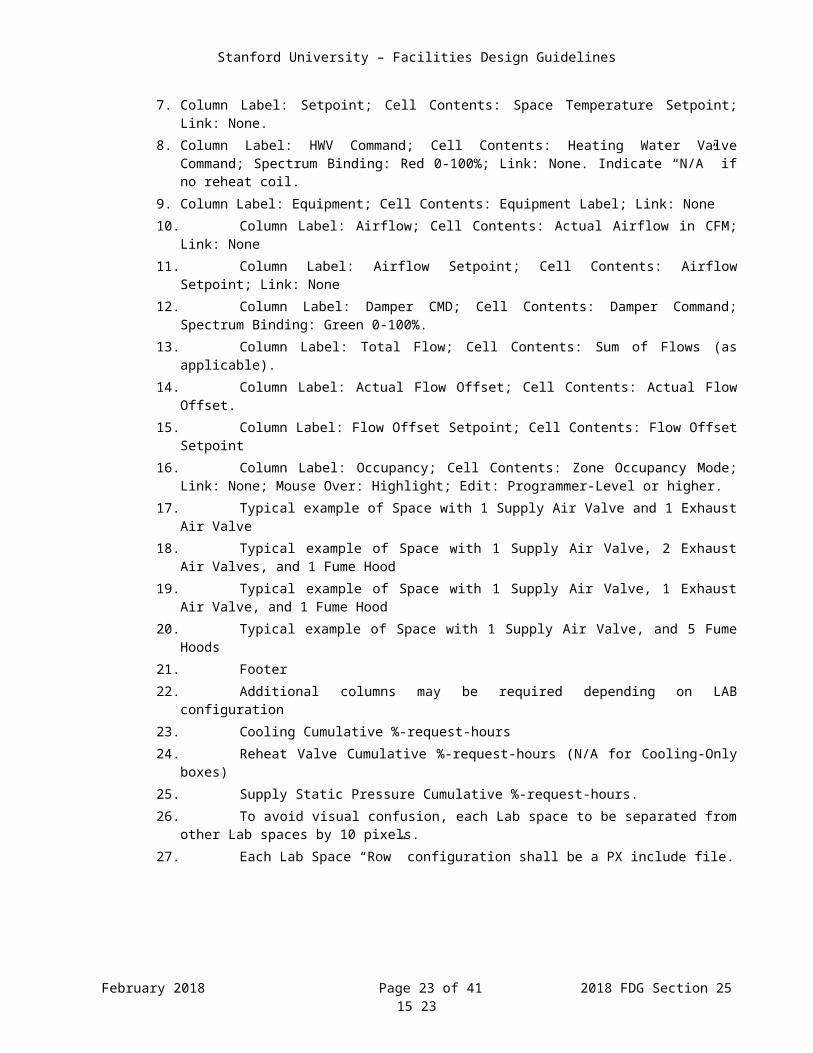
Mouse Over: Highlight; Edit: Programmer-Level or higher.6. Column Label: Actual Temp. Cell Contents: Actual Space Temperature; Link: None.7. Column Label: Setpoint; Cell Contents: Space Temperature Setpoint; Link: None.8. Column Label: HWV Command; Cell Contents: Heating Water Valve Command; Spectrum
Binding: Red 0-100%; Link: None. Indicate “N/A” if no reheat coil. 9. Column Label: Equipment; Cell Contents: Equipment Label; Link: None10. Column Label: Airflow; Cell Contents: Actual Airflow in CFM; Link: None11. Column Label: Airflow Setpoint; Cell Contents: Airflow Setpoint; Link: None
February 2018 Page 19 of 37 2018 FDG Section 25 15 23
Stanford University – Facilities Design Guidelines
13. Column Label: Total Flow; Cell Contents: Sum of Flows (as applicable).14. Column Label: Actual Flow Offset; Cell Contents: Actual Flow Offset.15. Column Label: Flow Offset Setpoint; Cell Contents: Flow Offset Setpoint16. Column Label: Occupancy; Cell Contents: Zone Occupancy Mode; Link: None; Mouse Over:
Highlight; Edit: Programmer-Level or higher.17. Typical example of Space with 1 Supply Air Valve and 1 Exhaust Air Valve 18. Typical example of Space with 1 Supply Air Valve, 2 Exhaust Air Valves, and 1 Fume Hood19. Typical example of Space with 1 Supply Air Valve, 1 Exhaust Air Valve, and 1 Fume Hood20. Typical example of Space with 1 Supply Air Valve, and 5 Fume Hoods21. Footer22. Additional columns may be required depending on LAB configuration23. Cooling Cumulative %-request-hours24. Reheat Valve Cumulative %-request-hours (N/A for Cooling-Only boxes)25. Supply Static Pressure Cumulative %-request-hours.26. To avoid visual confusion, each Lab space to be separated from other Lab spaces by 10
pixels.27. Each Lab Space “Row” configuration shall be a PX include file.
February 2018 Page 20 of 37 2018 FDG Section 25 15 23
Stanford University – Facilities Design Guidelines
3.12 LAB VAV WITH EXHAUST OVERVIEW
A. Example LAB VAV with Exhaust Overview Graphic
1. Header2. Label: Specific Floor; Link: Specific Floor Plan Graphic3. Label: Specific AHU serving Labs; Link: Graphic for Specific AHU serving Labs4. Label: VAVs with EV; Link: None5. Column Label: Zone; Cell Contents: Room Number of Space; Link: Specific Zone graphic;
Mouse Over: Highlight; Edit: Programmer-Level or higher.6. Column Label: T Rm #; Cell Contents: Room number that VAV thermostat is physically located
in.; Link: None; Mouse Over: Highlight; Edit: Programmer-Level or higher.7. Column Label: Actual Temp. Cell Contents: Actual Space Temperature; Link: None.8. Column Label: Equipment; Cell Contents: Equipment Label; Link: None9. Column Label: Mode; Cell Contents: VAV Operating Mode, Indicate “Cool” and color Blue,
when in cooling mode, Indicate “Heat” and color Red, when in heating mode, Indicate “Deadband” and no color, when in deadband mode; Link: None.
Binding: Red 0-100%; Link: None. Indicate “N/A” if no reheat coil. 13. Column Label: Airflow; Cell Contents: Actual Airflow in CFM; Link: None14. Column Label: Airflow Setpoint; Cell Contents: Airflow Setpoint; Link: None15. Column Label: Damper CMD; Cell Contents: Damper Command; Spectrum Binding: Green 0-
100%.
February 2018 Page 21 of 37 2018 FDG Section 25 15 23
Stanford University – Facilities Design Guidelines
16. Column Label: Occupancy; Cell Contents: Zone Occupancy Mode; Link: None; Mouse Over: Highlight; Edit: Programmer-Level or higher.
17. Typical example of Space with 1 VAV and 1 Exhaust Air Valve 18. Typical example of Space with 2 VAV, 2 Exhaust Air Valves, and 1 Fume Hood19. Footer20. Additional columns may be required depending on LAB configuration 21. Cooling Cumulative %-request-hours22. Reheat Valve Cumulative %-request-hours (N/A for Cooling-Only boxes)23. Supply Static Pressure Cumulative %-request-hours.24. Exhaust Static Pressure Cumulative %-request-hours.25. To avoid visual confusion, each Lab space to be separated from other Lab spaces by 10
pixels.
February 2018 Page 22 of 37 2018 FDG Section 25 15 23
Stanford University – Facilities Design Guidelines
3.13 FUME HOOD OVERVIEW
A. Example Fume Hood Overview Graphic
1. Header2. Label: Specific Floor; Link: Specific Floor Plan Graphic3. Label: Specific Exhaust Fan (EF) serving Fume Hoods; Link: Graphic for Specific Exhaust Fan
serving Labs4. Label: FumeHoods; Link: None5. Column Label: Zone; Cell Contents: Room Number of Space; Link: Specific Zone graphic that
fume hood is located in; Mouse Over: Highlight; Edit: Programmer-Level or higher.6. Column Label: Occupied Face Velocity SP Cell Contents: Occupied Face Velocity SP; Link:
None; Mouse Over: Highlight; Edit: Programmer-Level or higher.7. Column Label: Standby Face Velocity SP; Cell Contents: Standby Face Velocity SP; Link:
None.; Edit: Programmer-Level or higher.8. Column Label: Face Velocity; Cell Contents: Face Velocity; Link: None9. Column Label: Sash Position; Cell Contents: Sash Position Link: None.10. Column Label: Damper CMD; Cell Contents: Damper Command; Spectrum Binding: Green 0-
100%.11. Column Label: Airflow; Cell Contents: Actual Airflow in CFM; Link: None12. Column Label: Min Airflow SP; Cell Contents: Minimum Airflow Setpoint; Link: None.; Edit:
Programmer-Level or higher.
February 2018 Page 23 of 37 2018 FDG Section 25 15 23
Stanford University – Facilities Design Guidelines
13. Column Label: Max Airflow SP; Cell Contents: Maximum Airflow Setpoint; Link: None.; Edit: Programmer-Level or higher.
Binding: Red 0-100%; Link: None. Indicate “N/A” on cooling-only VAV’s. 12. Column Label: Discharge Temp; Cell Contents: Discharge Air Temperature13. Column Label: Fan Command; Cell Contents: Fan Command.14. Column Label: Fan Status; Cell Contents: Fan Status15. Footer16. Additional columns may be required depending on FCU configuration
February 2018 Page 25 of 37 2018 FDG Section 25 15 23
Stanford University – Facilities Design Guidelines
3.15 EXHAUST FAN SUMMARY TABLE
1. Header2. Label: EF Overview (TEF Overview); Link: None3. Column Label: Name; Cell Contents: Exhaust Fan ID; Link: None 4. Column Label: Controller Location Cell Contents: Name and Location of controller that controls
Exhaust Fan; Link: None5. Column Label: Fan Enable (Fan Command); Cell Contents: Fan Command6. Column Label: Fan Status; Cell Contents: Fan Status7. Footer8. Additional Columns, as required by project.
February 2018 Page 26 of 37 2018 FDG Section 25 15 23
Stanford University – Facilities Design Guidelines
3.16 MAPPED POINTS SUMMARY
A. Example of Typical Modbus Points Summary
B. Include this summary page if both a DDC system and the Delta V system are being utilized within the building for HVAC control. This illustrates which points are being shared between the two systems.
1. Header2. Label: Modbus; Link: None3. Summary table of Inputs passed from Delta V to DDC 4. Equipment Name5. Point Name or Description (Grouped by Equipment)6. Current Point Value7. Summary table of Outputs passed from DDC to Delta V8. Global Points (Not specific to equipment)9. Footer
February 2018 Page 27 of 37 2018 FDG Section 25 15 23
Stanford University – Facilities Design Guidelines
3.17 TRENDS (VIEW HISTORICAL DATA)
A. The “Trends” Header Button will navigate to the History Px page.
B. History trends will be organized by Hierarchies.
C. Using Hierarchies, navigate to Drag and Drop points onto the History Viewer.
February 2018 Page 28 of 37 2018 FDG Section 25 15 23
Stanford University – Facilities Design Guidelines
3.18 ALARM SCREENS
A. Each building will have a minimum of two alarm pages to display alarm records from the Alarm Console (all alarms) and the Critical Alarms Console (critical alarms only).
B. Example of Alarm Page
1. Header2. Label: Alarms (Critical Alarms); Link: None3. Desired Time Range4. Alarm records via alarm service console recipient5. Buttons for Alarm Acknowledge, etc. (Native Niagara Alarm Console buttons)6. Footer
February 2018 Page 29 of 37 2018 FDG Section 25 15 23
Stanford University – Facilities Design Guidelines
3.19 NAVIGATION PAGES
A. Navigation or Selection pages facilitate logical site navigation with organized link buttons. Typical applications include selection from multiple Floorplans, Overviews, HVAC Equipment, Reports, etc.
B. Example of Typical Floorplan Selection Page
1. Header2. Label: Floorplans; Link: None3. Labels for logical grouping4. Link buttons to facilitate navigation to pages5. Footer
February 2018 Page 30 of 37 2018 FDG Section 25 15 23
Stanford University – Facilities Design Guidelines
C. Example of Typical Report Selection Page
1. Header2. Label: Reports; Link: None3. Labels for logical grouping4. Link buttons to facilitate navigation to report pages. At a minimum, the following reports shall
be provided.a. Offline Controllersb. Points in Overridec. Points in Faultd. Critical Zones Equal to 0e. Critical Zones Equal to 1f. Critical Zones Greater than 1g. Zones with Notesh. Zones with Reheat Valves => 95%i. Zones with Dampers => 95%j. Zones with Cooling Demand => 95%k. FCU with HW Valves => 95%l. Additional reports as required by specific project
5. Footer
February 2018 Page 31 of 37 2018 FDG Section 25 15 23
Stanford University – Facilities Design Guidelines
3.20 REPORTS
A. At a minimum, the following Report Pages shall be provided:1. Offline Controllers2. Points in Override3. Points in Fault4. Critical Zones Equal to 05. Critical Zones Equal to 16. Critical Zones Greater than 17. Zones with Notes8. Zones with Damper >= 95%9. Zones with RH Valve >= 95%10. Zones with Cooling Demand >= 95%
B. Additional Reports may be required by specific project.
C. Example Points in Override Report
1. Header2. Label: Reports; Link: Report Selection Page3. Label: Overridden Points; Link: None 4. Quantity of Overridden Points5. Detailed Records of Overridden Points, including Device Name; Point Name; SlotPath Value
and Status6. Embellished Description of Report7. Button to Refresh Report Data
February 2018 Page 32 of 37 2018 FDG Section 25 15 23
Stanford University – Facilities Design Guidelines
8. Button to Export Report Data9. Footer
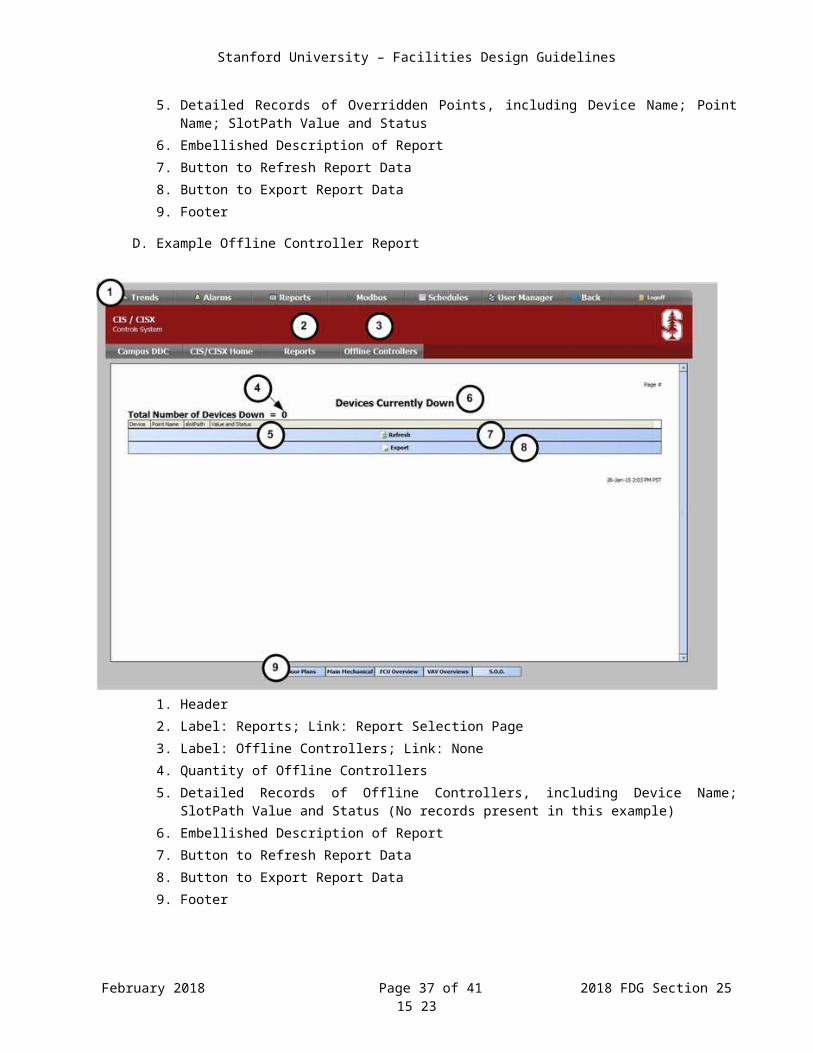
D. Example Offline Controller Report
1. Header2. Label: Reports; Link: Report Selection Page3. Label: Offline Controllers; Link: None 4. Quantity of Offline Controllers5. Detailed Records of Offline Controllers, including Device Name; SlotPath Value and Status
(No records present in this example)6. Embellished Description of Report7. Button to Refresh Report Data8. Button to Export Report Data9. Footer
February 2018 Page 33 of 37 2018 FDG Section 25 15 23
Stanford University – Facilities Design Guidelines
E. Example Points in Fault Report
1. Header2. Label: Reports; Link: Report Selection Page3. Label: Faulted Points; Link: None 4. Quantity of Points in Fault5. Detailed Records of Points in Fault, including Device Name; Point Name; SlotPath Value and
Status (No records present in this example)6. Embellished Description of Report7. Button to Refresh Report Data8. Button to Export Report Data9. Footer
February 2018 Page 34 of 37 2018 FDG Section 25 15 23
Stanford University – Facilities Design Guidelines
F. Example Zone Criticality Report (Reset Weighting)
1. Header2. Label: Reports; Link: Report Selection Page3. Label: Zone Criticality Level; Link: None 4. Quantity of Zones that meet report criteria5. Detailed Records of Zones with a Critical Level of 1, including Device Name; Point Name;
SlotPath Value and Status6. Embellished Description of Report7. Scroll Bar (Appears as Required)8. Footer9. Button to Refresh Report Data (Not Shown)10. Button to Export Report Data (Not Shown)
February 2018 Page 35 of 37 2018 FDG Section 25 15 23
Stanford University – Facilities Design Guidelines
G. Example Zones with Notes Report
1. Header2. Label: Reports; Link: Report Selection Page3. Label: Zone With Notes; Link: None 4. Quantity of Zone With Notes5. Detailed Records of Zones with Notes, including Device Name; Point Name; SlotPath Value
and Status6. Embellished Description of Report7. Button to Refresh Report Data8. Button to Export Report Data9. Footer
3.21 DASHBOARDS
A. The Dashboard button in the Header will navigate to the Dashboard Px page.
February 2018 Page 36 of 37 2018 FDG Section 25 15 23
Stanford University – Facilities Design Guidelines
B. History trends will be organized by Hierarchies.
C. Using Hierarchies, navigate to Drag and Drop points onto the Dashboard.
END OF SECTION
February 2018 Page 37 of 37 2018 FDG Section 25 15 23