MSU Departmental Undergraduate Assessment Report, May 2013 Department: Psychology Department Chair: Colleen F. Moore Assessment Coordinators: Department tenure track faculty members as a ‘committee of the whole’, plus participation by some adjunct faculty (Heiser, Numbers) Degrees/Majors/Options Offered by Department B.S. in Psychology (with options in Psychological Science and Applied Psychology) M.S. in Psychological Science (not addressed in this document) Contents: Rubrics used, pp. 2-9 Assessment Results, May 2013, pp. 10-20. Appendix: Timeline as proposed in Assessment Plan of December 2011, p. 20-21 1
Transcript
MSU Departmental Undergraduate Assessment Report, May 2013
Department: Psychology
Department Chair: Colleen F. Moore
Assessment Coordinators: Department tenure track faculty members as a ‘committee of the whole’, plus participation by some adjunct faculty (Heiser, Numbers)
Degrees/Majors/Options Offered by Department
B.S. in Psychology (with options in Psychological Science and Applied Psychology)
M.S. in Psychological Science (not addressed in this document)
Contents: Rubrics used, pp. 2-9Assessment Results, May 2013, pp. 10-20.Appendix: Timeline as proposed in Assessment Plan of December 2011, p. 20-21
1
Lawrence University Psychology Department Capstone Assessment Rubric
Evaluation of Senior Capstone Presentations Date:__________________Student: _______________ Topic: __________________________________
Critical Thinking1. The presentation demonstrated critical thinking about psychological research.
1 2 3 4 5 6 7 very weak average very strong
2. The presentation demonstrated understanding of the interplay between psychological theory and research.1 2 3 4 5 6 7
very weak average very strong
Oral Communication3. The presentation was well organized.
1 2 3 4 5 6 7 very weak average very strong
4. Important points were clearly explained.1 2 3 4 5 6 7
very weak average very strong
5. The style of the presentation was engaging.1 2 3 4 5 6 7
very weak average very strong
Values & Ethics6. The presentation reflects an understanding of the values and ethics of psychologists.
1 2 3 4 5 6 7 Not Applicable very weak average very strong
Methodology & Research7. Presented research evidence was relevant and accurate.
1 2 3 4 5 6 7 very weak average very strong
8. If an empirical project, the student clearly communicated the methodology.1 2 3 4 5 6 7 Not Applicable
very weak average very strong
9. If an empirical project, the student highlighted and explained key findings.
2
1 2 3 4 5 6 7 Not Applicable very weak average very strong
Diversity10. The presentation reflected understanding of the diversity issues relevant to the student’s topic.
1 2 3 4 5 6 7 Not Applicable very weak average very strong
(from Lawrence University, Appleton, WI)
3
.
ORAL COMMUNICATION VALUE RUBRICfor more information, please contact [email protected]
The VALUE rubrics were developed by teams of faculty experts representing colleges and universities across the United States through a process that examined many existing campus rubrics and related documents for each learning outcome and incorporated additional feedback from faculty. The rubrics articulate fundamental criteria for each learning outcome, with performance descriptors demonstrating progressively more sophisticated levels of attainment. The rubrics are intended for institutional-level use in evaluating and discussing student learning, not for grading. The core expectations articulated in all 15 of the VALUE rubrics can and should be translated into the language of individual campuses, disciplines, and even courses. The utility of the VALUE rubrics is to position learning at all undergraduate levels within a basic framework of expectations such that evidence of learning can by shared nationally through a common dialog and understanding of student success.
The type of oral communication most likely to be included in a collection of student work is an oral presentation and therefore is the focus for the application of this rubric.
DefinitionOral communication is a prepared, purposeful presentation designed to increase knowledge, to foster understanding, or to promote change in the
listeners' attitudes, values, beliefs, or behaviors.
Framing LanguageOral communication takes many forms. This rubric is specifically designed to evaluate oral presentations of a single speaker at a time and is best
applied to live or video-recorded presentations. For panel presentations or group presentations, it is recommended that each speaker be evaluated separately. This rubric best applies to presentations of sufficient length such that a central message is conveyed, supported by one or more forms of supporting materials and includes a purposeful organization. An oral answer to a single question not designed to be structured into a presentation does not readily apply to this rubric.
GlossaryThe definitions that follow were developed to clarify terms and concepts used in this rubric only.
• Central message: The main point/thesis/"bottom line"/"take-away" of a presentation. A clear central message is easy to identify; a compelling central message is also vivid and memorable.
• Delivery techniques: Posture, gestures, eye contact, and use of the voice. Delivery techniques enhance the effectiveness of the presentation when the speaker stands and moves with authority, looks more often at the audience than at his/her speaking materials/notes, uses the voice expressively, and uses few vocal fillers ("um," "uh," "like," "you know," etc.).
• Language: Vocabulary, terminology, and sentence structure. Language that supports the effectiveness of a presentation is appropriate to the topic and audience, grammatical, clear, and free from bias. Language that enhances the effectiveness of a presentation is also vivid, imaginative, and expressive.
4
• Organization: The grouping and sequencing of ideas and supporting material in a presentation. An organizational pattern that supports the effectiveness of a presentation typically includes an introduction, one or more identifiable sections in the body of the speech, and a conclusion. An organizational pattern that enhances the effectiveness of the presentation reflects a purposeful choice among possible alternatives, such as a chronological pattern, a problem-solution pattern, an analysis-of-parts pattern, etc., that makes the content of the presentation easier to follow and more likely to accomplish its purpose.
• Supporting material: Explanations, examples, illustrations, statistics, analogies, quotations from relevant authorities, and other kinds of information or analysis that supports the principal ideas of the presentation. Supporting material is generally credible when it is relevant and derived from reliable and appropriate sources. Supporting material is highly credible when it is also vivid and varied across the types listed above (e.g., a mix of examples, statistics, and references to authorities). Supporting material may also serve the purpose of establishing the speakers credibility. For example, in presenting a creative work such as a dramatic reading of Shakespeare, supporting evidence may not advance the ideas of Shakespeare, but rather serve to establish the speaker as a credible Shakespearean actor.
5
ORAL COMMUNICATION VALUE RUBRICfor more information, please contact [email protected]
DefinitionOral communication is a prepared, purposeful presentation designed to increase knowledge, to foster understanding, or to promote change in the listeners'
attitudes, values, beliefs, or behaviors.
Evaluators are encouraged to assign a zero to any work sample or collection of work that does not meet benchmark (cell one) level performance.
Capstone4
Milestones3 2
Benchmark1
Organization Organizational pattern (specific introduction and conclusion, sequenced material within the body, and transitions) is clearly and consistently observable and is skillful and makes the content of the presentation cohesive.
Organizational pattern (specific introduction and conclusion, sequenced material within the body, and transitions) is clearly and consistently observable within the presentation.
Organizational pattern (specific introduction and conclusion, sequenced material within the body, and transitions) is intermittently observable within the presentation.
Organizational pattern (specific introduction and conclusion, sequenced material within the body, and transitions) is not observable within the presentation.
Language Language choices are imaginative, memorable, and compelling, and enhance the effectiveness of the presentation. Language in presentation is appropriate to audience.
Language choices are thoughtful and generally support the effectiveness of the presentation. Language in presentation is appropriate to audience.
Language choices are mundane and commonplace and partially support the effectiveness of the presentation. Language in presentation is appropriate to audience.
Language choices are unclear and minimally support the effectiveness of the presentation. Language in presentation is not appropriate to audience.
Delivery Delivery techniques (posture, gesture, eye contact, and vocal expressiveness) make the presentation compelling, and speaker appears polished and confident.
Delivery techniques (posture, gesture, eye contact, and vocal expressiveness) make the presentation interesting, and speaker appears comfortable.
Delivery techniques (posture, gesture, eye contact, and vocal expressiveness) make the presentation understandable, and speaker appears tentative.
Delivery techniques (posture, gesture, eye contact, and vocal expressiveness) detract from the understandability of the presentation, and speaker appears uncomfortable.
Supporting Material A variety of types of supporting materials (explanations, examples, illustrations, statistics, analogies, quotations from relevant authorities) make appropriate reference to information or analysis that
Supporting materials (explanations, examples, illustrations, statistics, analogies, quotations from relevant authorities) make appropriate reference to information or analysis that
Supporting materials (explanations, examples, illustrations, statistics, analogies, quotations from relevant authorities) make appropriate reference to information or analysis that
Insufficient supporting materials (explanations, examples, illustrations, statistics, analogies, quotations from relevant authorities) make reference to information or analysis that minimally supports
significantly supports the presentation or establishes the presenter's credibility/authority on the topic.
generally supports the presentation or establishes the presenter's credibility/authority on the topic.
partially supports the presentation or establishes the presenter's credibility/authority on the topic.
the presentation or establishes the presenter's credibility/authority on the topic.
Central Message Central message is compelling (precisely stated, appropriately repeated, memorable, and strongly supported.)
Central message is clear and consistent with the supporting material.
Central message is basically understandable but is not often repeated and is not memorable.
Central message can be deduced, but is not explicitly stated in the presentation.
7
CRITICAL THINKING VALUE RUBRICfor more information, please contact [email protected]
The VALUE rubrics were developed by teams of faculty experts representing colleges and universities across the United States through a process that examined many existing campus rubrics and related documents for each learning outcome and incorporated additional feedback from faculty. The rubrics articulate fundamental criteria for each learning outcome, with performance descriptors demonstrating progressively more sophisticated levels of attainment. The rubrics are intended for institutional-level use in evaluating and discussing student learning, not for grading. The core expectations articulated in all 15 of the VALUE rubrics can and should be translated into the language of individual campuses, disciplines, and even courses. The utility of the VALUE rubrics is to position learning at all undergraduate levels within a basic framework of expectations such that evidence of learning can by shared nationally through a common dialog and understanding of student success.
DefinitionCritical thinking is a habit of mind characterized by the comprehensive exploration of issues, ideas, artifacts, and events before accepting or
formulating an opinion or conclusion.
Framing LanguageThis rubric is designed to be transdisciplinary, reflecting the recognition that success in all disciplines requires habits of inquiry and analysis that
share common attributes. Further, research suggests that successful critical thinkers from all disciplines increasingly need to be able to apply those habits in various and changing situations encountered in all walks of life.
This rubric is designed for use with many different types of assignments and the suggestions here are not an exhaustive list of possibilities. Critical thinking can be demonstrated in assignments that require students to complete analyses of text, data, or issues. Assignments that cut across presentation mode might be especially useful in some fields. If insight into the process components of critical thinking (e.g., how information sources were evaluated regardless of whether they were included in the product) is important, assignments focused on student reflection might be especially illuminating.
GlossaryThe definitions that follow were developed to clarify terms and concepts used in this rubric only.
• Ambiguity: Information that may be interpreted in more than one way.• Assumptions: Ideas, conditions, or beliefs (often implicit or unstated) that are "taken for granted or accepted as true without proof." (quoted from
www.dictionary.reference.com/browse/assumptions)• Context: The historical, ethical. political, cultural, environmental, or circumstantial settings or conditions that influence and complicate the
consideration of any issues, ideas, artifacts, and events.• Literal meaning: Interpretation of information exactly as stated. For example, "she was green with envy" would be interpreted to mean that her
skin was green.
8
• Metaphor: Information that is (intended to be) interpreted in a non-literal way. For example, "she was green with envy" is intended to convey an intensity of emotion, not a skin color.
9
CRITICAL THINKING VALUE RUBRICfor more information, please contact [email protected]
DefinitionCritical thinking is a habit of mind characterized by the comprehensive exploration of issues, ideas, artifacts, and events before accepting or formulating an opinion or
conclusion.Evaluators are encouraged to assign a zero to any work sample or collection of work that does not meet benchmark (cell one) level performance.
Capstone4
Milestones3 2
Benchmark1
Explanation of issues Issue/problem to be considered critically is stated clearly and described comprehensively, delivering all relevant information necessary for full understanding.
Issue/problem to be considered critically is stated, described, and clarified so that understanding is not seriously impeded by omissions.
Issue/problem to be considered critically is stated but description leaves some terms undefined, ambiguities unexplored, boundaries undetermined, and/or backgrounds unknown.
Issue/problem to be considered critically is stated without clarification or description.
EvidenceSelecting and using information to investigate a point of view or conclusion
Information is taken from source(s) with enough interpretation/evaluation to develop a comprehensive analysis or synthesis. Viewpoints of experts are questioned thoroughly.
Information is taken from source(s) with enough interpretation/evaluation to develop a coherent analysis or synthesis.Viewpoints of experts are subject to questioning.
Information is taken from source(s) with some interpretation/evaluation, but not enough to develop a coherent analysis or synthesis.Viewpoints of experts are taken as mostly fact, with little questioning.
Information is taken from source(s) without any interpretation/evaluation.Viewpoints of experts are taken as fact, without question.
Influence of context and assumptions
Thoroughly (systematically and methodically) analyzes own and others' assumptions and carefully evaluates the relevance of contexts when presenting a position.
Identifies own and others' assumptions and several relevant contexts when presenting a position.
Questions some assumptions. Identifies several relevant contexts when presenting a position. May be more aware of others' assumptions than one's own (or vice versa).
Shows an emerging awareness of present assumptions (sometimes labels assertions as assumptions). Begins to identify some contexts when presenting a position.
Student's position (perspective, thesis/hypothesis)
Specific position (perspective, thesis/hypothesis) is imaginative, taking into account the complexities of an issue.Limits of position (perspective, thesis/hypothesis) are acknowledged.
Specific position (perspective, thesis/hypothesis) takes into account the complexities of an issue.Others' points of view are acknowledged within position (perspective, thesis/hypothesis).
Specific position (perspective, thesis/hypothesis) acknowledges different sides of an issue.
Specific position (perspective, thesis/hypothesis) is stated, but is simplistic and obvious.
10
Others' points of view are synthesized within position (perspective, thesis/hypothesis).
Conclusions and related outcomes (implications and consequences)
Conclusions and related outcomes (consequences and implications) are logical and reflect student’s informed evaluation and ability to place evidence and perspectives discussed in priority order.
Conclusion is logically tied to a range of information, including opposing viewpoints; related outcomes (consequences and implications) are identified clearly.
Conclusion is logically tied to information (because information is chosen to fit the desired conclusion); some related outcomes (consequences and implications) are identified clearly.
Conclusion is inconsistently tied to some of the information discussed; related outcomes (consequences and implications) are oversimplified.
QUANTITATIVE LITERACY VALUE RUBRICfor more information, please contact [email protected]
The VALUE rubrics were developed by teams of faculty experts representing colleges and universities across the United States through a process that examined many existing campus rubrics and related documents for each learning outcome and incorporated additional feedback from faculty. The rubrics articulate fundamental criteria for each learning outcome, with performance descriptors demonstrating progressively more sophisticated levels of attainment. The rubrics are intended for institutional-level use in evaluating and discussing student learning, not for grading. The core expectations articulated in all 15 of the VALUE rubrics can and should be translated into the language of individual campuses, disciplines, and even courses. The utility of the VALUE rubrics is to position learning at all undergraduate levels within a basic framework of expectations such that evidence of learning can by shared nationally through a common dialog and understanding of student success.
DefinitionQuantitative Literacy (QL) – also known as Numeracy or Quantitative Reasoning (QR) – is a "habit of mind," competency, and comfort in working with numerical
data. Individuals with strong QL skills possess the ability to reason and solve quantitative problems from a wide array of authentic contexts and everyday life situations. They understand and can create sophisticated arguments supported by quantitative evidence and they can clearly communicate those arguments in a variety of formats (using words, tables, graphs, mathematical equations, etc., as appropriate).
Quantitative Literacy Across the DisciplinesCurrent trends in general education reform demonstrate that faculty are recognizing the steadily growing importance of Quantitative Literacy (QL) in an
increasingly quantitative and data-dense world. AAC&U’s recent survey showed that concerns about QL skills are shared by employers, who recognize that many of today’s students will need a wide range of high level quantitative skills to complete their work responsibilities. Virtually all of today’s students, regardless of career choice, will need basic QL skills such as the ability to draw information from charts, graphs, and geometric figures, and the ability to accurately complete straightforward estimations and calculations.
Preliminary efforts to find student work products which demonstrate QL skills proved a challenge in this rubric creation process. It’s possible to find pages of mathematical problems, but what those problem sets don’t demonstrate is whether the student was able to think about and understand the meaning of her work. It’s possible to find research papers that include quantitative information, but those papers often don’t provide evidence that allows the evaluator to see how much of the thinking was done by the original source (often carefully cited in the paper) and how much was done by the student herself, or whether conclusions drawn from analysis of the source material are even accurate.
11
Given widespread agreement about the importance of QL, it becomes incumbent on faculty to develop new kinds of assignments which give students substantive, contextualized experience in using such skills as analyzing quantitative information, representing quantitative information in appropriate forms, completing calculations to answer meaningful questions, making judgments based on quantitative data and communicating the results of that work for various purposes and audiences. As students gain experience with those skills, faculty must develop assignments that require students to create work products which reveal their thought processes and demonstrate the range of their QL skills.
This rubric provides for faculty a definition for QL and a rubric describing four levels of QL achievement which might be observed in work products within work samples or collections of work. Members of AAC&U’s rubric development team for QL hope that these materials will aid in the assessment of QL – but, equally important, we hope that they will help institutions and individuals in the effort to more thoroughly embed QL across the curriculum of colleges and universities.
Framing LanguageThis rubric has been designed for the evaluation of work that addresses quantitative literacy (QL) in a substantive way. QL is not just computation, not just the
citing of someone else’s data. QL is a habit of mind, a way of thinking about the world that relies on data and on the mathematical analysis of data to make connections and draw conclusions. Teaching QL requires us to design assignments that address authentic, data-based problems. Such assignments may call for the traditional written paper, but we can imagine other alternatives: a video of a PowerPoint presentation, perhaps, or a well designed series of web pages. In any case, a successful demonstration of QL will place the mathematical work in the context of a full and robust discussion of the underlying issues addressed by the assignment.
Finally, QL skills can be applied to a wide array of problems of varying difficulty, confounding the use of this rubric. For example, the same student might demonstrate high levels of QL achievement when working on a simplistic problem and low levels of QL achievement when working on a very complex problem. Thus, to accurately assess a students QL achievement it may be necessary to measure QL achievement within the context of problem complexity, much as is done in diving competitions where two scores are given, one for the difficulty of the dive, and the other for the skill in accomplishing the dive. In this context, that would mean giving one score for the complexity of the problem and another score for the QL achievement in solving the problem.
12
QUANTITATIVE LITERACY VALUE RUBRICfor more information, please contact [email protected]
DefinitionQuantitative Literacy (QL) – also known as Numeracy or Quantitative Reasoning (QR) – is a "habit of mind," competency, and comfort in working with numerical data. Individuals with
strong QL skills possess the ability to reason and solve quantitative problems from a wide array of authentic contexts and everyday life situations. They understand and can create sophisticated arguments supported by quantitative evidence and they can clearly communicate those arguments in a variety of formats (using words, tables, graphs, mathematical equations, etc., as appropriate).
Evaluators are encouraged to assign a zero to any work sample or collection of work that does not meet benchmark (cell one) level performance.
Capstone4
Milestones3 2 1
InterpretationAbility to explain information presented in mathematical forms (e.g., equations, graphs, diagrams, tables, words)
Provides accurate explanations of information presented in mathematical forms. Makes appropriate inferences based on that information. For example, accurately explains the trend data shown in a graph and makes reasonable predictions regarding what the data suggest about future events.
Provides accurate explanations of information presented in mathematical forms. For instance, accurately explains the trend data shown in a graph.
Provides somewhat accurate explanations of information presented in mathematical forms, but occasionally makes minor errors related to computations or units. For instance, accurately explains trend data shown in a graph, but may miscalculate the slope of the trend line.
Attempts to explain information presented in mathematical forms, but draws incorrect conclusions about what the information means. For example, attempts to explain the trend data shown in a graph, but will frequently misinterpret the nature of that trend, perhaps by confusing positive and negative trends.
RepresentationAbility to convert relevant information into various mathematical forms (e.g., equations, graphs, diagrams, tables, words)
Skillfully converts relevant information into an insightful mathematical portrayal in a way that contributes to a further or deeper understanding.
Competently converts relevant information into an appropriate and desired mathematical portrayal.
Completes conversion of information but resulting mathematical portrayal is only partially appropriate or accurate.
Completes conversion of information but resulting mathematical portrayal is inappropriate or inaccurate.
Calculation Calculations attempted are essentially all successful and sufficiently comprehensive to solve the problem. Calculations are also presented elegantly (clearly, concisely, etc.)
Calculations attempted are essentially all successful and sufficiently comprehensive to solve the problem.
Calculations attempted are either unsuccessful orrepresent only a portion of the calculations required to comprehensively solve the problem.
Calculations are attempted but are both unsuccessful and are not comprehensive.
Application / AnalysisAbility to make judgments and draw appropriate conclusions based on the quantitative analysis of data, while recognizing the limits of this analysis
Uses the quantitative analysis of data as the basis for deep and thoughtful judgments, drawing insightful, carefully qualified conclusions from this work.
Uses the quantitative analysis of data as the basis for competent judgments, drawing reasonable and appropriately qualified conclusions from this work.
Uses the quantitative analysis of data as the basis for workmanlike (without inspiration or nuance, ordinary) judgments, drawing plausible conclusions from this work.
Uses the quantitative analysis of data as the basis for tentative, basic judgments, although is hesitant or uncertain about drawing conclusions from this work.
AssumptionsAbility to make and evaluate important assumptions in estimation, modeling, and data analysis
Explicitly describes assumptions and provides compelling rationale for why each assumption is appropriate. Shows awareness that confidence in
Explicitly describes assumptions and provides compelling rationale for why assumptions are appropriate.
Explicitly describes assumptions. Attempts to describe assumptions.
13
final conclusions is limited by the accuracy of the assumptions.
CommunicationExpressing quantitative evidence in support of the argument or purpose of the work (in terms of what evidence is used and how it is formatted, presented, and contextualized)
Uses quantitative information in connection with the argument or purpose of the work, presents it in an effective format, and explicates it with consistently high quality.
Uses quantitative information in connection with the argument or purpose of the work, though data may be presented in a less than completely effective format or some parts of the explication may be uneven.
Uses quantitative information, but does not effectively connect it to the argument or purpose of the work.
Presents an argument for which quantitative evidence is pertinent, but does not provide adequate explicit numerical support. (May use quasi-quantitative words such as "many," "few," "increasing," "small," and the like in place of actual quantities.)
Results of Assessments Administered to Students
I. 499R, Senior Thesis. We assessed several learning goals in the context of 499R, Senior Thesis. First, the Lawrence University Capstone Rubric assesses Values in Psychology (items 6, 10), and Critical Thinking in Psychology (items 1, 2), Research Methods (items 7, 8 9), and Communication Skills (items 3, 4, 5), and overall capstone performance. The LEAP Oral Communication rubric assesses Critical Thinking in item 4, and overall Capstone performance. Finally, the Psychology Department has administered its own ‘Senior Survey’ in Psyx 499R since 2005 (with 2 years omitted) to gauge student satisfaction with different aspects of the major, as well as job/career intentions post-graduation.
a. Lawrence University Capstone rubric. i. For Fall 2011 and Spring 2012 principal components analysis showed that the items loaded on a single factor, and that the smallest loading was .67 for Q10. The single factor
accounted for 72% of variance in the data space. Therefore, we summed each student’s scores across the 10 items to create a composite score representing overall capstone accomplishment.
1. The composite scores ranged from 1.8 to 7.0. The mean was 5.54 and the median was 5.75, on a 7-point scale. These central tendency measures indicate that on average our students are performing well in their senior capstone projects.
2. The frequency distribution (Fig 1) shows a strong mode between 5 and 6, which shows very good performance. The cumulative frequency distribution (Fig 2) shows that 75% of the students score 4.5 or above. The midpoint of the scale is 4.0.
ii. The Values in Psychology assessment includes items 6 and 10 of this rubric. Item #6 had a mode at 7, and 84% of the students scored 5 or above. Item #10 on Diversity had a mode of 6, and 66% of the students scored 5 or above.
iii. The Critical Thinking items are #1 and #2. The means on these items were 5.4 and 5.5 respectively, and the median and mode were 6.0 on both items. This is very good performance on critical thinking. Only 1 student scored below 4 on either of these items.
iv. The Research Methods items (#s 7, 8, 9) had means of 5.3, 5.6, and 5.6 respectively. The modes were 5, 7, and 6, while the medians were 5, 6, and 6. One student scored below 4 on item #7, 2 on item #8, and 2 on item #9.
v. The Communication Skills items (#s 3, 4, 5) showed means of 5.7, 5.7 and 5.4, respectively. The modes and medians were 6 for all three items (on a 7 point scale).
14
Figure 1. Lawrence University rubric frequency distn Figure 2. Lawrence University rubric cumulative frequency
b. LEAP Oral Communication rubric.i. Overall capstone performance. For Fall 2011 and Spring 2012 principal components analysis showed that the 5 items loaded on a single factor, and that the smallest loading
was .71 for Q3. The single factor accounted for 72% of variance in the data space. Therefore, we summed each student’s scores across the 5 items to create a composite score representing capstone accomplishment across the key dimensions. The means of all items except #2, Language, were above 3.0. Figures 3 and 4 plot the histogram and cumulative distribution of the LEAP oral communication rubric.
ii. Critical Thinking on the LEAP rubric is item #4, ‘Supporting Material’. The mean was 3.14 (on a scale of 4), and the median and modes were 3.0. Fours students were rated a ‘2’ on the this item.
iii. Communication Skills are assessed in items 1,2,3, and 5. The means on these items were all above 3 on a 4 point scale (3.3, 3.5, 3.1, 3.3, respectively), and the medians were all 3
15
Figure 3. Frequency dist’n of LEAP Figure 4. Cumulative frequency dist’n of LEAP composite scores composite scores
c. Grade Distributions in Psyx 499R. The grade distributions appear to be consistent with the rubric assessments. Table 1 shows that only occasional students earned grades below a “C”, the minimum grade for fulfilling the Psychology major requirements. The grade distribution is shown in Table 1 for years 2009 to Fall 2012. Approximately 8% of students dropped the course or received a non-passing grade over this time period. To determine whether the individuals who dropped the course eventually re-enrolled and succeeded would require a level of individual tracking for which the department does not have the resources. Figure 5 plots the cumulative grade distribution for the time period in Table 1.
16
Table 1. Percentage of grades in each category in each semester in Psyx 499R Senior Thesis
Semester A B C D F WF 09 75.00 18.75 0.00 0.00 0.00 6.25Sp 10 66.67 23.33 0.00 0.00 0.00 10.00F 10 90.91 0.00 0.00 0.00 0.00 9.09Sp 11 67.50 20.00 2.50 0.00 2.50 7.50F 11 62.50 16.67 8.33 0.00 0.00 12.50Sp 12 73.08 23.08 0.00 0.00 0.00 3.85
Total % 71.52 17.72 1.90 0.00 0.63 8.23
Figure 5. Senior Thesis Cumulative Grade Distribution
17
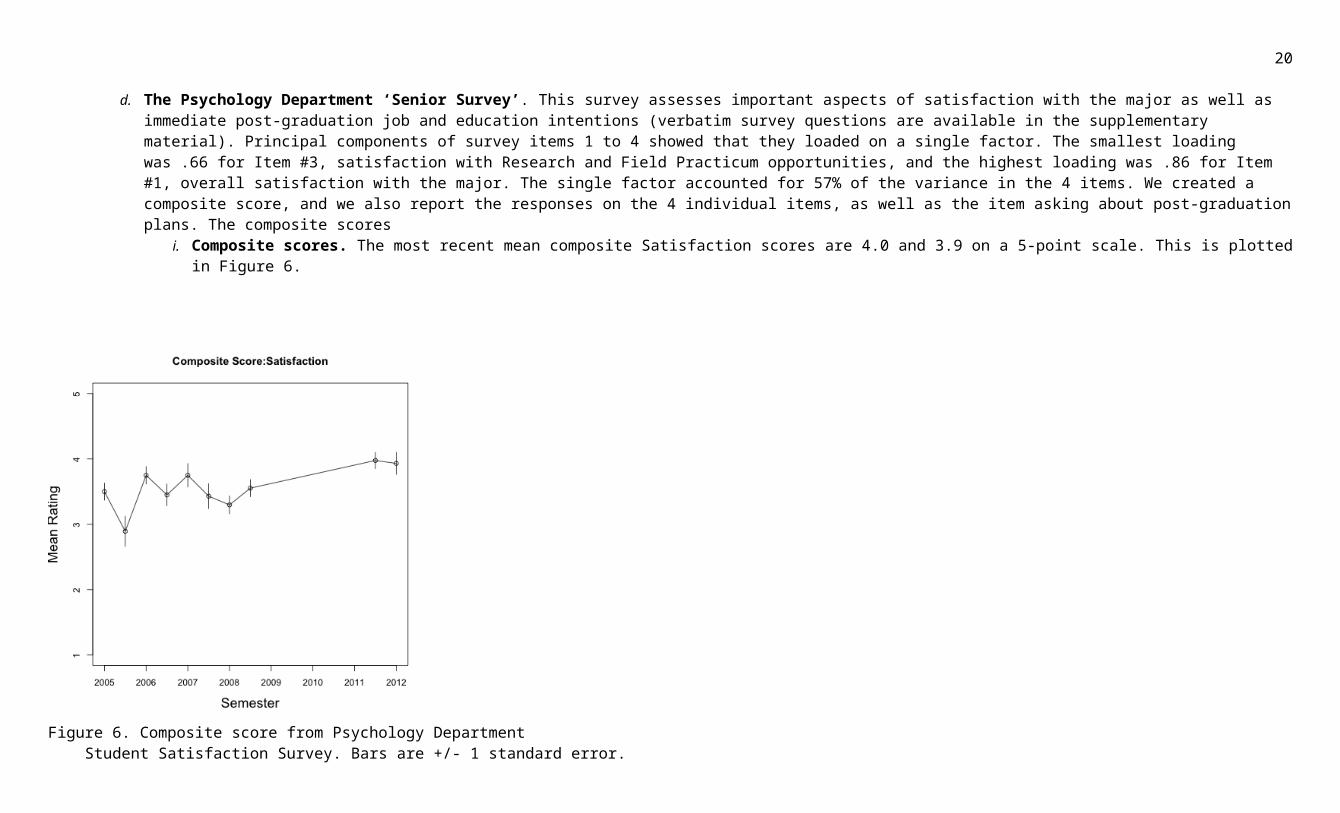
d. The Psychology Department ‘Senior Survey’. This survey assesses important aspects of satisfaction with the major as well as immediate post-graduation job and education intentions (verbatim survey questions are available in the supplementary material). Principal components of survey items 1 to 4 showed that they loaded on a single factor. The smallest loading was .66 for Item #3, satisfaction with Research and Field Practicum opportunities, and the highest loading was .86 for Item #1, overall satisfaction with the major. The single factor accounted for 57% of the variance in the 4 items. We created a composite score, and we also report the responses on the 4 individual items, as well as the item asking about post-graduation plans. The composite scores
i. Composite scores. The most recent mean composite Satisfaction scores are 4.0 and 3.9 on a 5-point scale. This is plotted in Figure 6.
Figure 6. Composite score from Psychology Department Student Satisfaction Survey. Bars are +/- 1 standard error.
ii. The individual questions for Overall satisfaction with the major, Course satisfaction, Research / Field Practicum Satisfaction, and Career / Academic Advising Satisfaction are plotted in Figures 7 to 10.
18
Figure 7. Satifaction with Major from Psychology Figure 8. Course Satisfaction from PsychologyDepartment Student Satisfaction Survey. Department Student Satisfaction Survey.Bars are +/- 1 standard error. Bars are +/- 1 standard error.
19
Figure 9. Satifaction with Research/Field Practicum Figure 10. Advising Satisfaction from Psychologyfrom Psychology Department Student Satisfaction Survey. Department Student Satisfaction Survey.Bars are +/- 1 standard error. Bars are +/- 1 standard error.
iii. Post-graduation intentionsA majority of students intend to apply to graduate school in Psychology or a related field, 76 and 55% in the latest two semesters. Many of our students are seeking jobs related to
psychology, 43 and 45% in the latest surveys. And some students have already accepted a job prior to graduation: 24 and 27%. These results over the years are plotted in Figures 11 to 13. (Note: percentages may sum to more than 100 because students could mark multiple options). These data show a very positive impact of the major on students’ post-graduation intentions, and it is excellent to see that approximately 25% of students are accepting jobs at graduation.
20
Figure 11. Percentage intending to apply to Psychology Figure 12. Percentage seeking Psychology Figure 13. Percentage accepting job at graduation, Related Graduate School, from Psychology Department related job, from Department Student from Psychology Department Student Satisfaction Survey.Student Satisfaction Survey. Satisfaction Survey.
II. Critical Thinking: Research Design and Analysis II. We assessed Critical Thinking in the context of Psyx 225. This is a required course, and it is expected that students might not perform as well at this point in the development compared to in Senior Thesis, Psyx 499R for which the data were presented above. a. Two coders independently coded final project papers from Fall 2012 Psyx 225 using the LEAP Critical Thinking Rubric. The inter-rater agreement for a subsample of the 28 papers was
66%. Principal components analysis showed that the 5 items of the LEAP rubric loaded on a single factor, and that the smallest loading was .84 for “Conclusion”. The single factor accounted for 80% of the variance in the data space. We created a composite score by averaging the 5 dimensions on the LEAP rubric, but we also present the results for the individual dimensions. The mean on the composite score was 2.51 on the 4 point scale, a level that is between “Milestone 2” and “Milestone 3”.
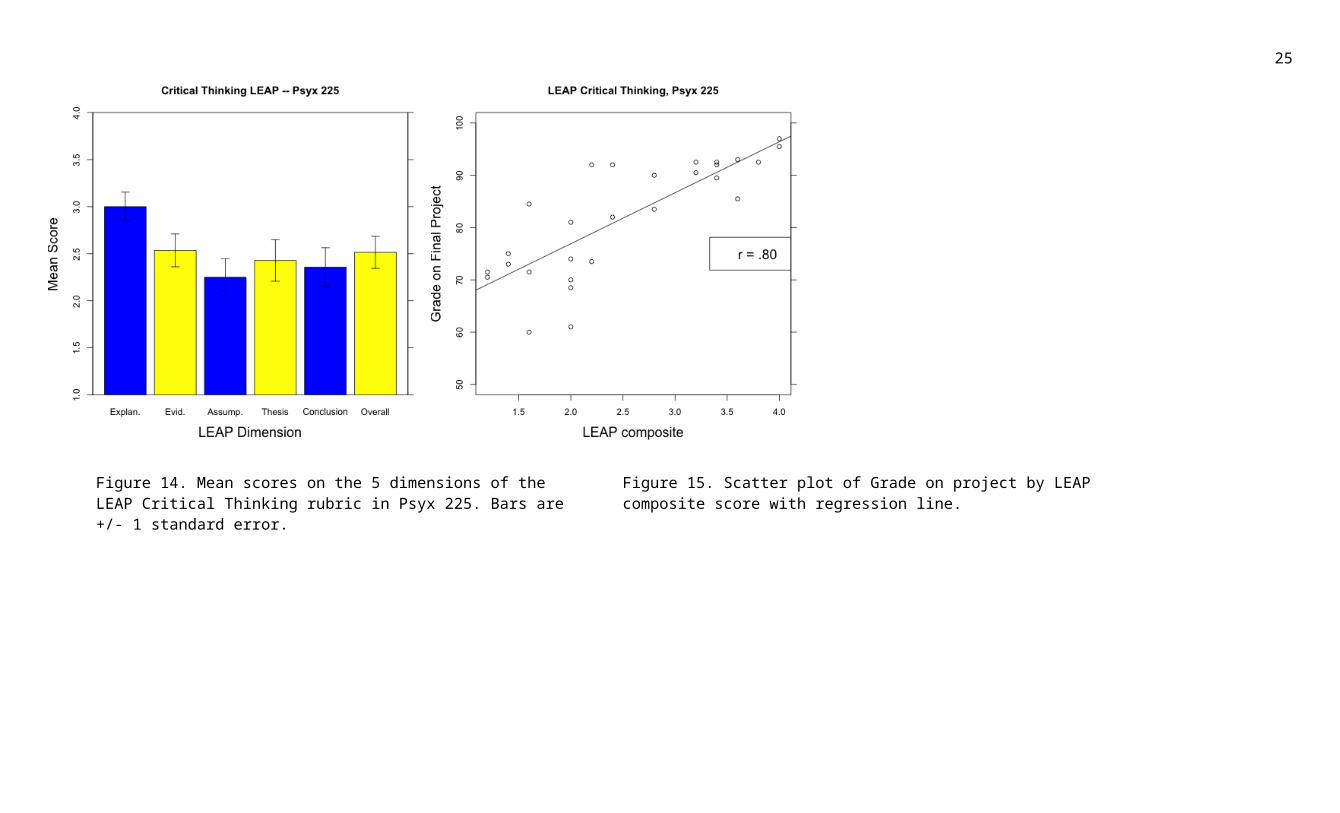
i. The means of the 5 dimensions of the Critical Thinking rubric are presented in Figure 14. The mean scores on the 5 features of critical thinking ranged from 2.3 to 3.0, with the lowest scores for “Influence of Context and Assumptions”. The standard deviations ranged from .81 to 1.17. The percentages of students scoring at levels 3 and 4 of the LEAP rubric were 68, 53, 32, 46 and 46% for the 5 features. A score of 3 or above indicates performance just below “Capstone”. The median scores were 3, 3, 2, 2, 2 for the 5 dimensions. Our students are performing well on the dimensions of “Explanation of Issues” and “Evidence.” We would like to see median performance on the “Context and Assumptions”, “Perspective, Thesis/Hypothesis”, and “Conclusions, Implications, Consequences” advance to level 3 as well.
21
ii. We calculated the correlation between numerical grade on the paper and LEAP rubric composite score in order to assess the degree to which our normal grading procedures incorporate the same elements that are considered in the rubric. The correlation was .80. The scatter plot with regression line is presented in Figure 15. This provides evidence that our normal grading procedure does incorporate the important elements of the LEAP Critical Thinking rubric. The grading was done entirely separately from the coding of the LEAP rubric dimensions.
Figure 14. Mean scores on the 5 dimensions of the Figure 15. Scatter plot of Grade on project by LEAPLEAP Critical Thinking rubric in Psyx 225. Bars are composite score with regression line. +/- 1 standard error.
22
III. Quantitative Literacy, Psyx 223, Research Design and Analysis I. a. One coder (not the instructor) applied the Quantitative Literacy LEAP rubric to the second assigned class project for a class of 47 students. The project covers aspects of inferential
statistics and applications. Principal components analysis showed that the 6 dimensions of the LEAP rubric loaded on a single factor, and that the smallest loading was .50 for “Calculation”, while all other items loaded above .75. The single factor accounted for 64% of variance. We created a composite score by averaging the 6 dimensions on the LEAP rubric, but we also present the results for the individual dimensions. The mean on the composite score was 3.11 on a 4-point scale, with a standard deviation of .60. The median of the composite score was 3.17, showing that over half of the students are performing at “Milestone 3”. We retained individual identification information so that at a later date we can relate performance in Quantitative Literacy to later performance on the capstone rubrics.
b. The means on the separate dimensions ranged from 2.65 to 3.61, and standard deviations ranged from .60 to .89. The means on the 6 dimensions are presented in Figure 16. The medians were all 3 except that “Representation” had a median of 4. This shows that students are performing especially well at representing problems.
Figure 16. Mean scores on the Quantitative LiteracyLEAP rubric in Psyx 223. Bars are +/- 1 standard error.
23
IV. Knowledge Base of Psychology: Criterion-referenced test items. To assess the content knowledge base, instructors in several courses chose 10 to 15 multiple choice items that represent important concepts in the field covered by the course, and that had been administered in class. At least one other faculty member (not the instructor) examined the test items and judged whether each item represented a concept that is important to the course. The scores reported below are for those items that faculty agreed to be assessments of important concepts for the target course. At least 8 items were agreed on for each course reported below. The verbatim items are available in a supplement from the Department. a. Memory & Cognition, Psyx 380. This course is offered every semester and covers material that is central to psychology. Scores on the criterion referenced items ranged from 61 to 98%
correct. The overall mean performance on the exams was approximately 80% correct, while the mean on the key concept criterion referenced items was 84%. Items covered concepts such as semantic memory and priming, mental rotation, language processing, and reasoning processes.
b. Psychology of Learning, Psyx 370. This course or Psyx 270 is offered every semester and covers material that is central to understanding psychological principles of behavior change. Scores on the criterion referenced items ranged from 72 to 94% correct. The mean on the criterion referenced items was 86%. The items covered concepts such as the definitions of reinforcing events, extinction, avoidance conditioning, and schedules of reinforcement.
c. Judgment and Decision Making, Psyx 481. This is an advanced course that covers relatively difficult material, although the material is highly applicable to everyday reasoning processes. Scores on the criterion referenced items ranged between 44 and 91% correct, with a mean of 74.5%. The items covered concepts such as the ‘sunk cost’ effect, endowment effect, effects of mood on decision making style, overconfidence, framing effects, and Prospect Theory.
d. Social Psychology, Psyx 360. This is a service course that is currently offered every semester. Scores on the items ranged from 83 to 97% correct, with a mean of 90%. Items covered concepts such as variables influencing prosocial behavior, aggressive behavior, framing effects, stereotyping, inter-group conflict, effects of rewards on motivation, and effects of social expectations.
Appendix: Proposed timelines as of December 2011. --Proposed ‘Developmental’ Assessments of Student Progress Students would be assessed across the two courses listed in a row, or pre- and post-course completion if only one course is listed in a row.