35
WebSim Click your left mouse button to progress through the demo
| Date post: | 30-Dec-2015 |
| Category: |
Documents |
| Upload: | cade-ashley |
| View: | 33 times |
| Download: | 0 times |
WebSim
Click your left mouse button to progress through the demo
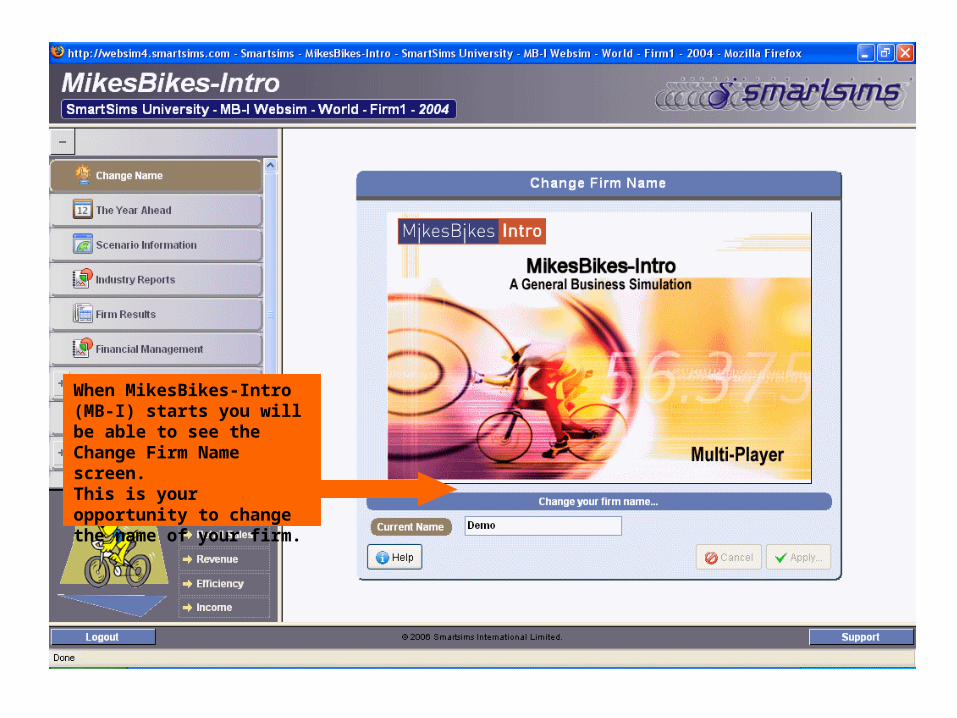
When MikesBikes-Intro (MB-I) starts you will be able to see the Change Firm Name screen.This is your opportunity to change the name of your firm.
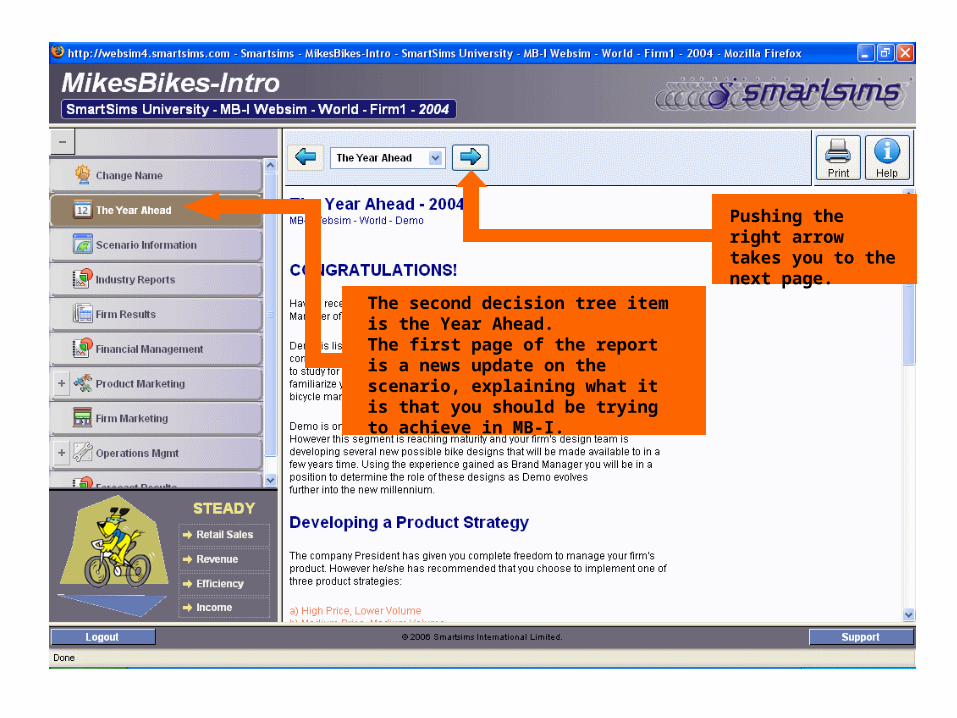
The second decision tree item is the Year Ahead. The first page of the report is a news update on the scenario, explaining what it is that you should be trying to achieve in MB-I.
Pushing the right arrow takes you to the next page.
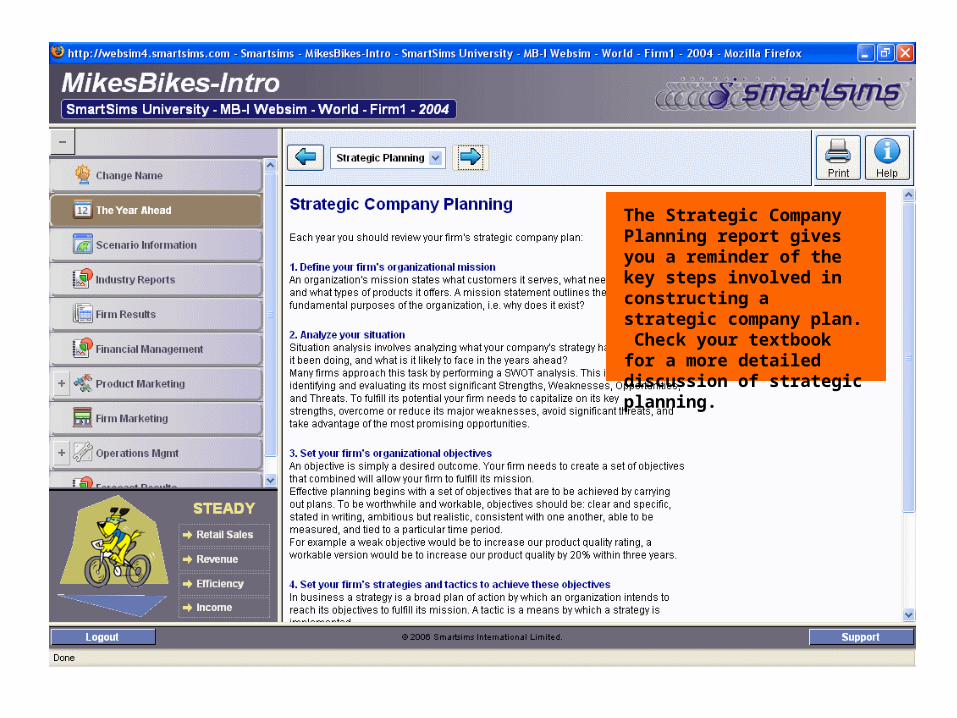
The Strategic Company Planning report gives you a reminder of the key steps involved in constructing a strategic company plan. Check your textbook for a more detailed discussion of strategic planning.
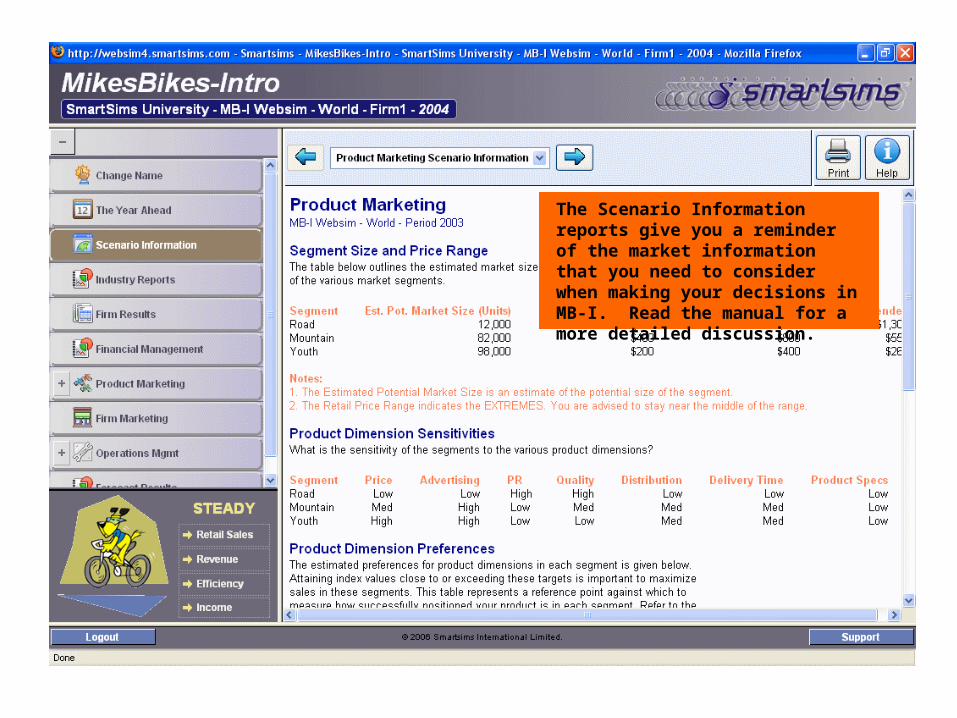
The Scenario Information reports give you a reminder of the market information that you need to consider when making your decisions in MB-I. Read the manual for a more detailed discussion.
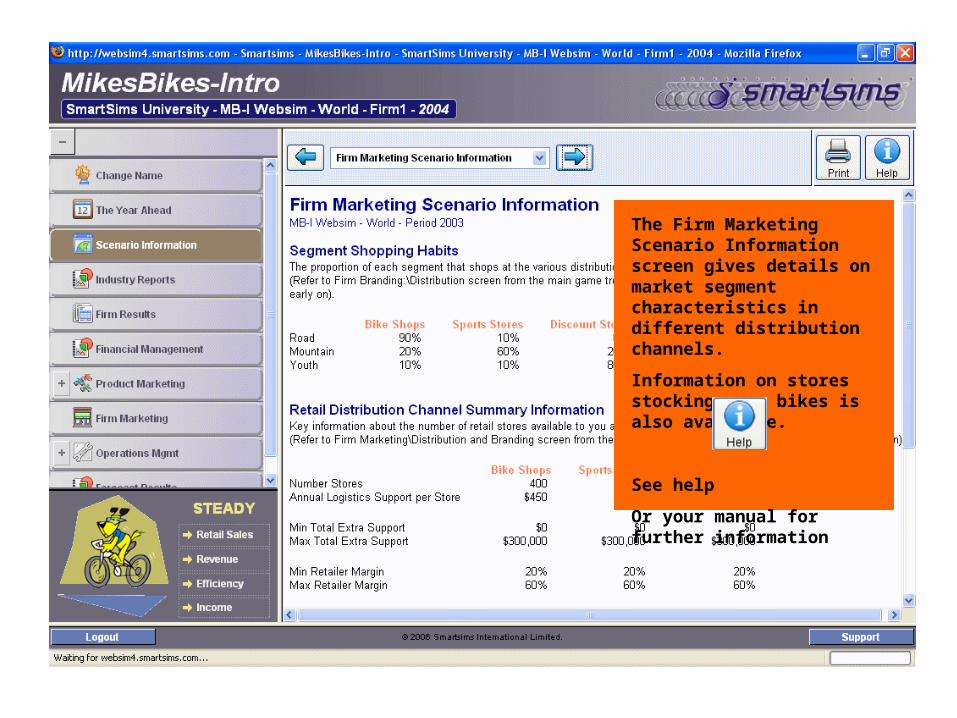
The Firm Marketing Scenario Information screen gives details on market segment characteristics in different distribution channels.
Information on stores stocking your bikes is also available.
See help
Or your manual for further information
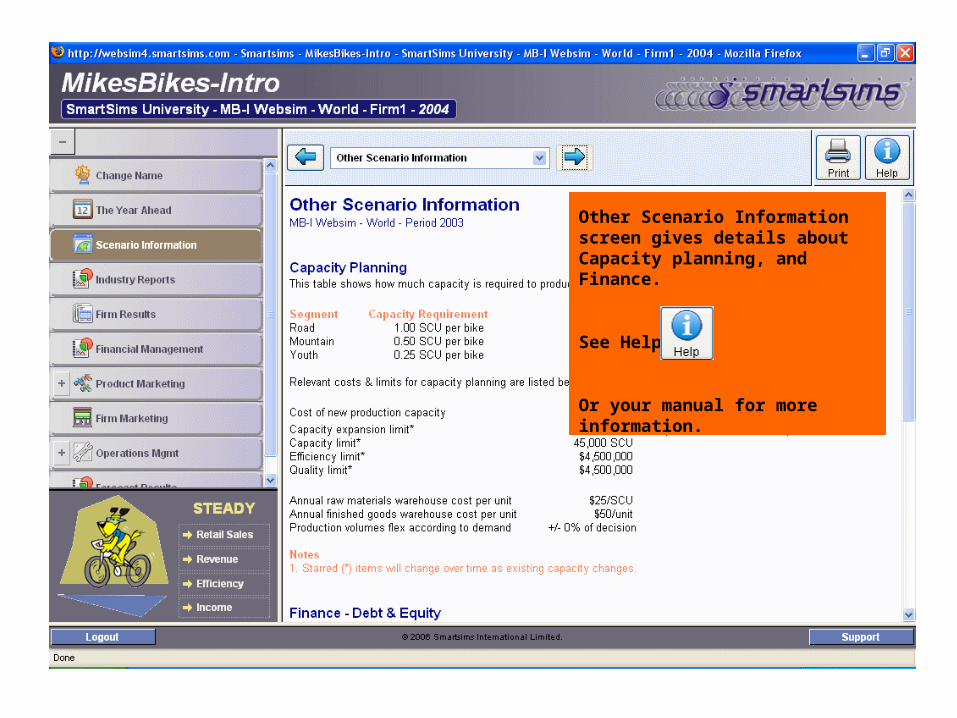
Other Scenario Information screen gives details about Capacity planning, and Finance.
See Help
Or your manual for more information.
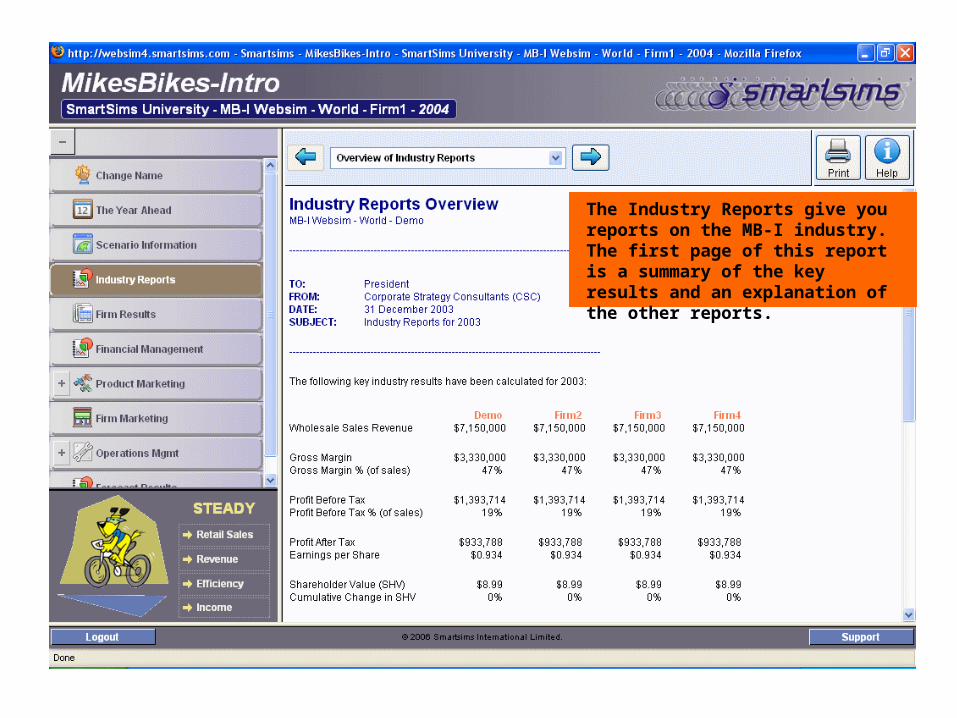
The Industry Reports give you reports on the MB-I industry.The first page of this report is a summary of the key results and an explanation of the other reports.
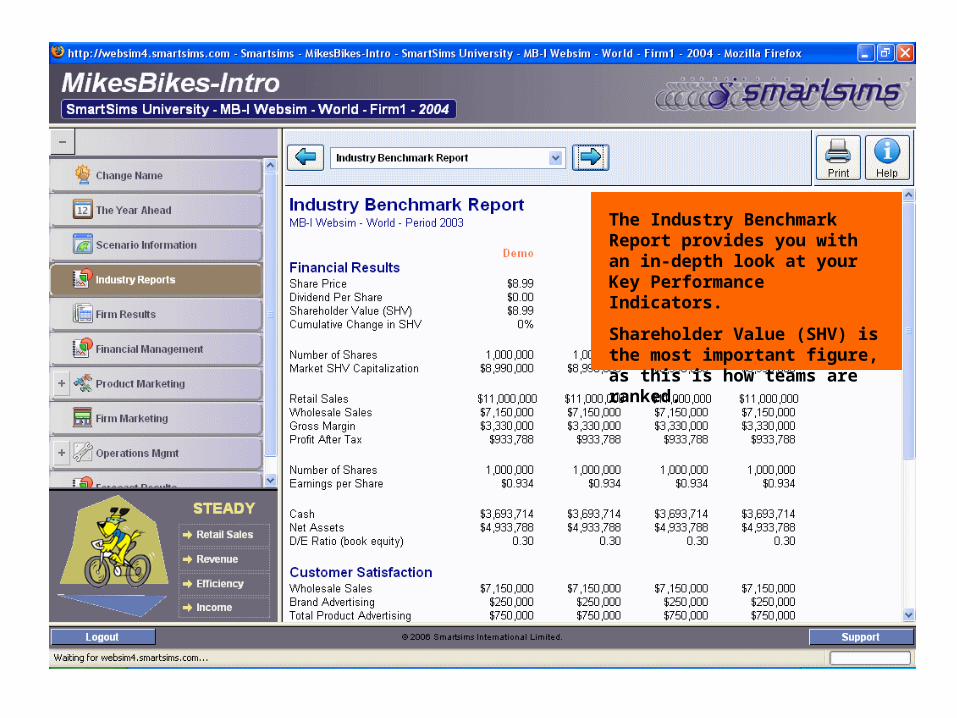
The Industry Benchmark Report provides you with an in-depth look at your Key Performance Indicators.
Shareholder Value (SHV) is the most important figure, as this is how teams are ranked.
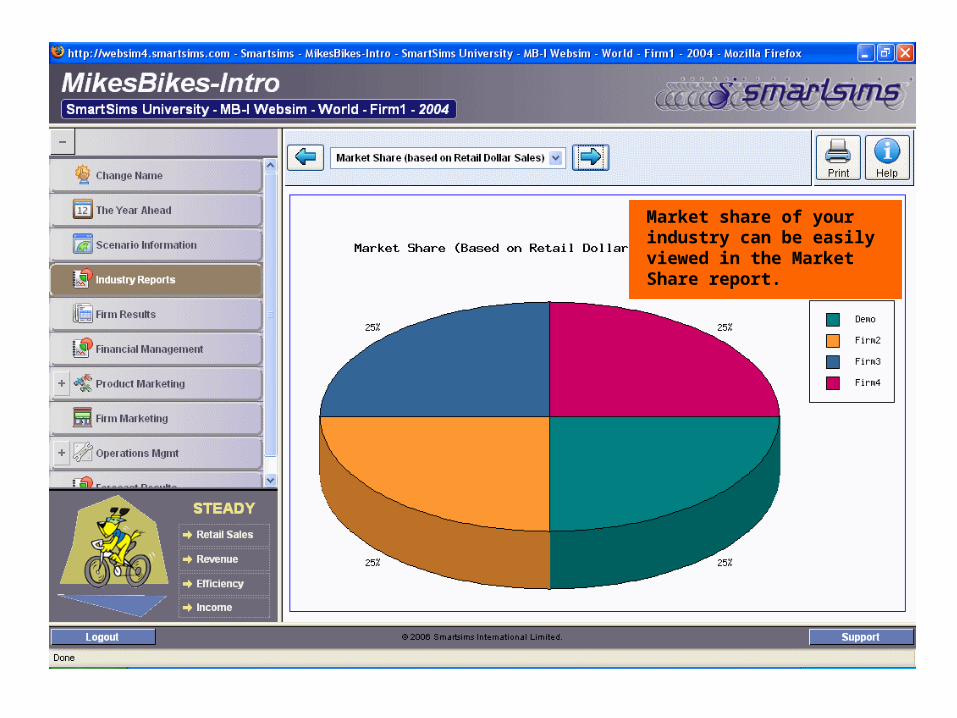
Market share of your industry can be easily viewed in the Market Share report.
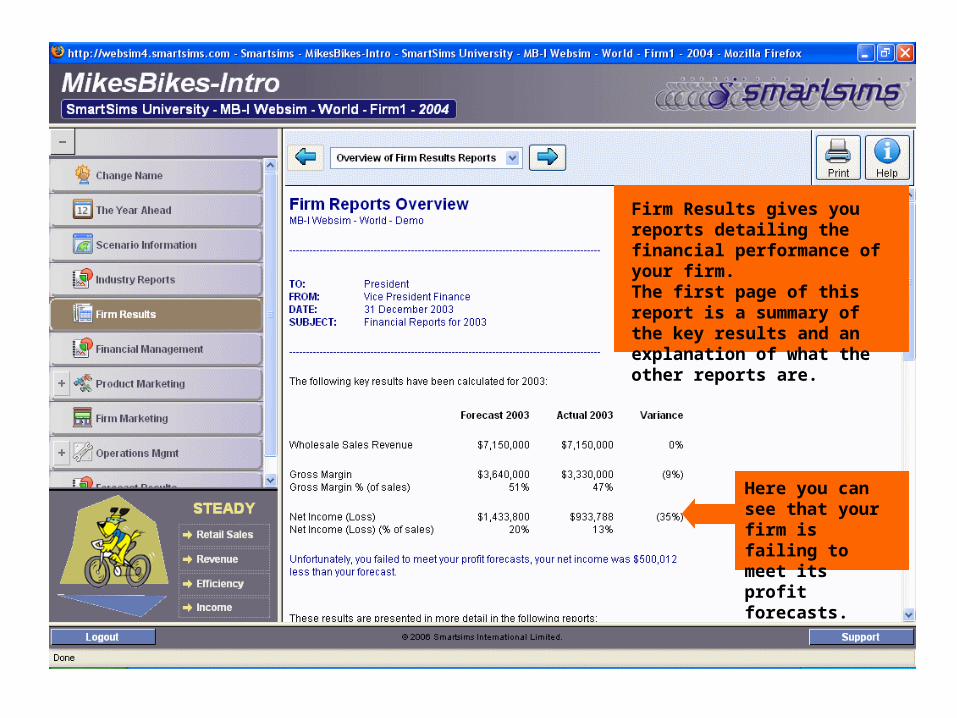
Firm Results gives you reports detailing the financial performance of your firm. The first page of this report is a summary of the key results and an explanation of what the other reports are.
Here you can see that your firm is failing to meet its profit forecasts.
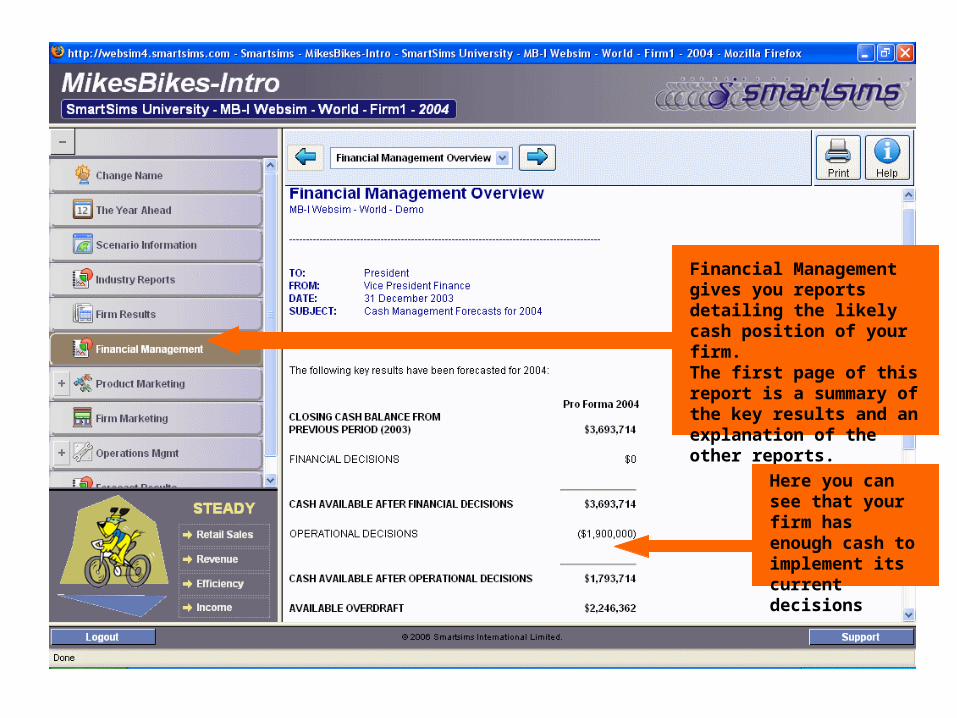
Financial Management gives you reports detailing the likely cash position of your firm. The first page of this report is a summary of the key results and an explanation of the other reports.
Here you can see that your firm has enough cash to implement its current decisions
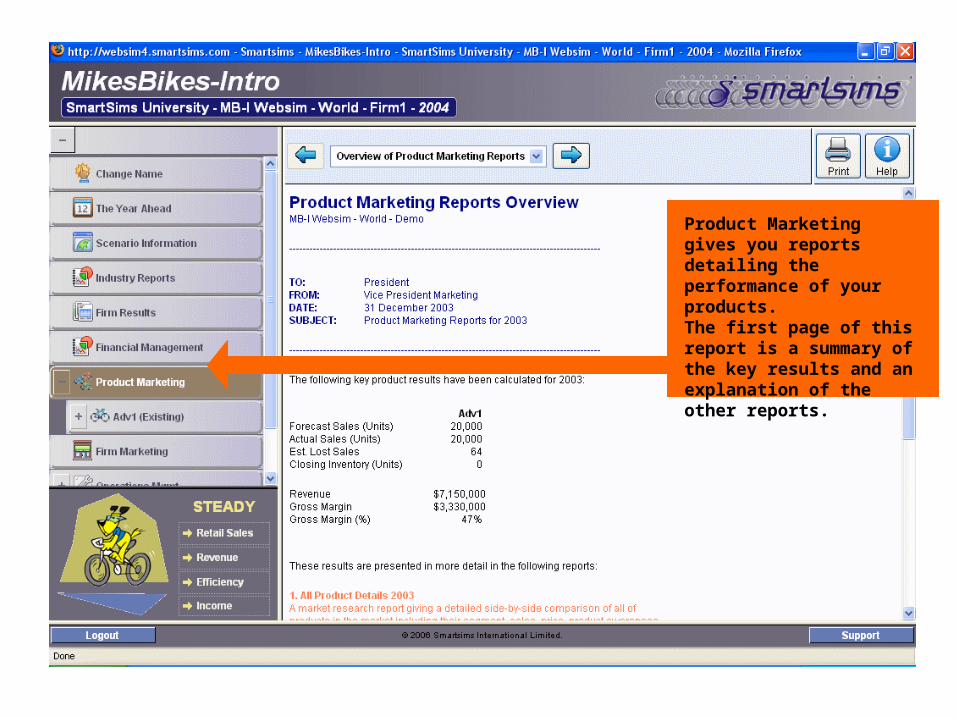
Product Marketing gives you reports detailing the performance of your products. The first page of this report is a summary of the key results and an explanation of the other reports.
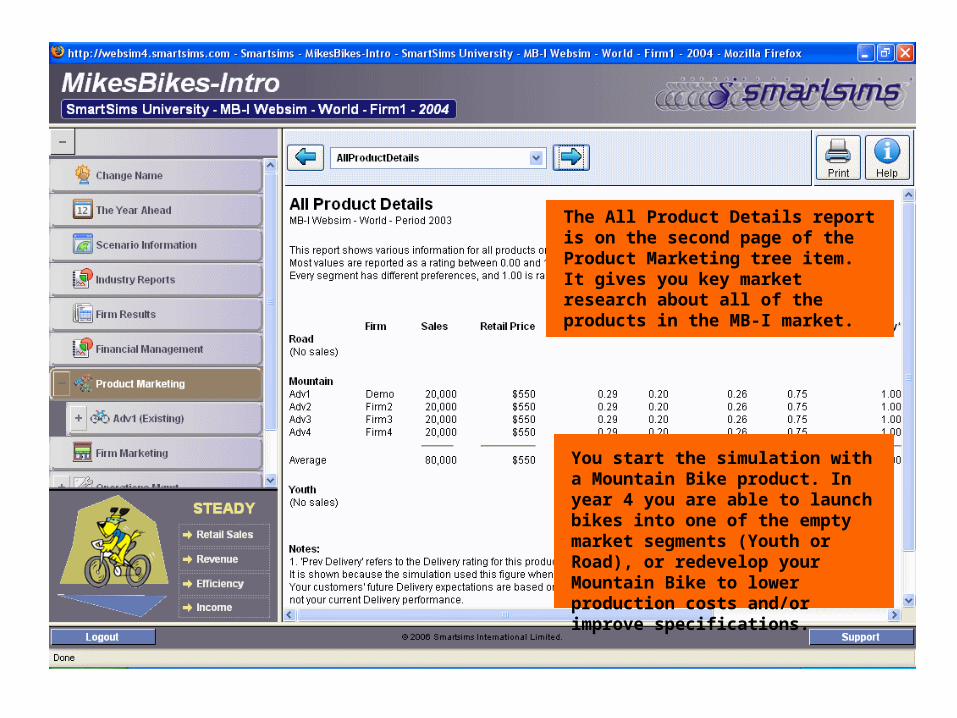
The All Product Details report is on the second page of the Product Marketing tree item.It gives you key market research about all of the products in the MB-I market.
You start the simulation with a Mountain Bike product. In year 4 you are able to launch bikes into one of the empty market segments (Youth or Road), or redevelop your Mountain Bike to lower production costs and/or improve specifications.
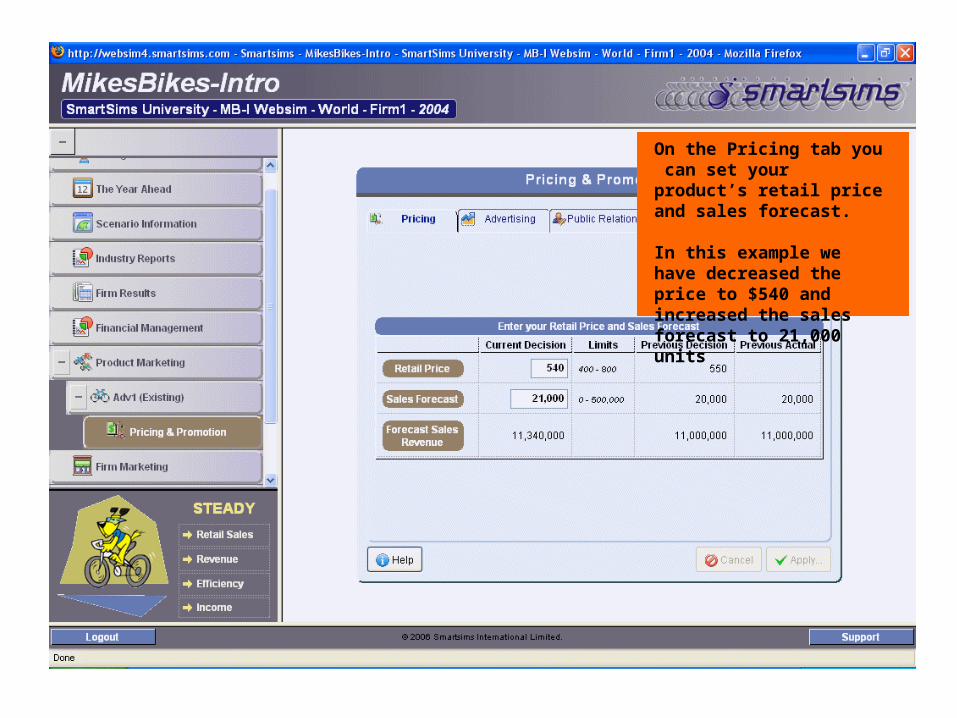
On the Pricing tab you can set your product’s retail price and sales forecast.
In this example we have decreased the price to $540 and increased the sales forecast to 21,000 units
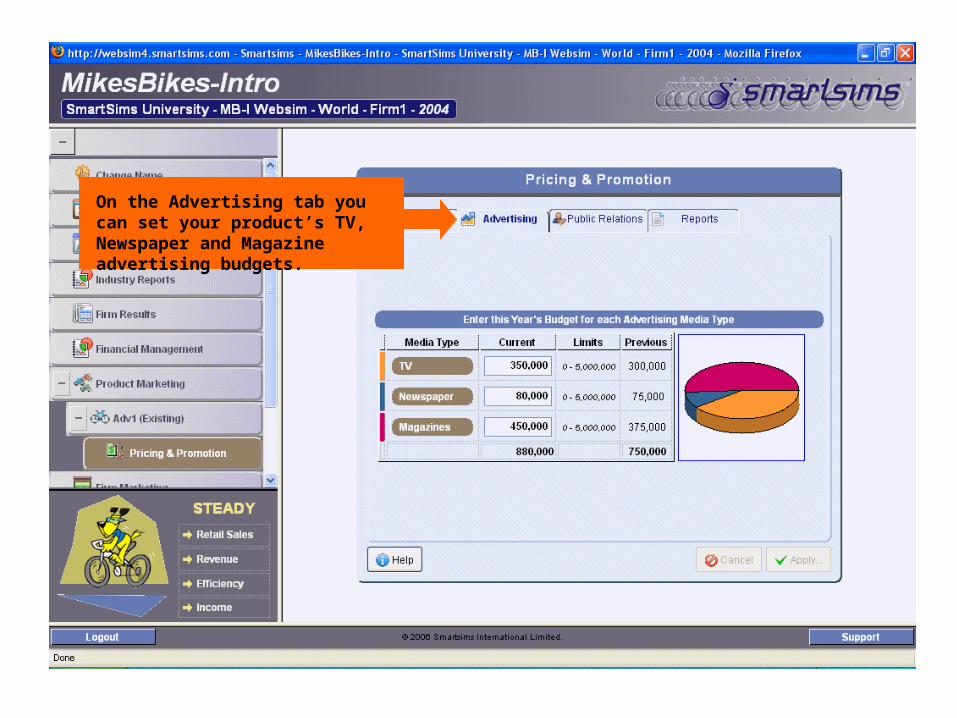
On the Advertising tab you can set your product’s TV, Newspaper and Magazine advertising budgets.
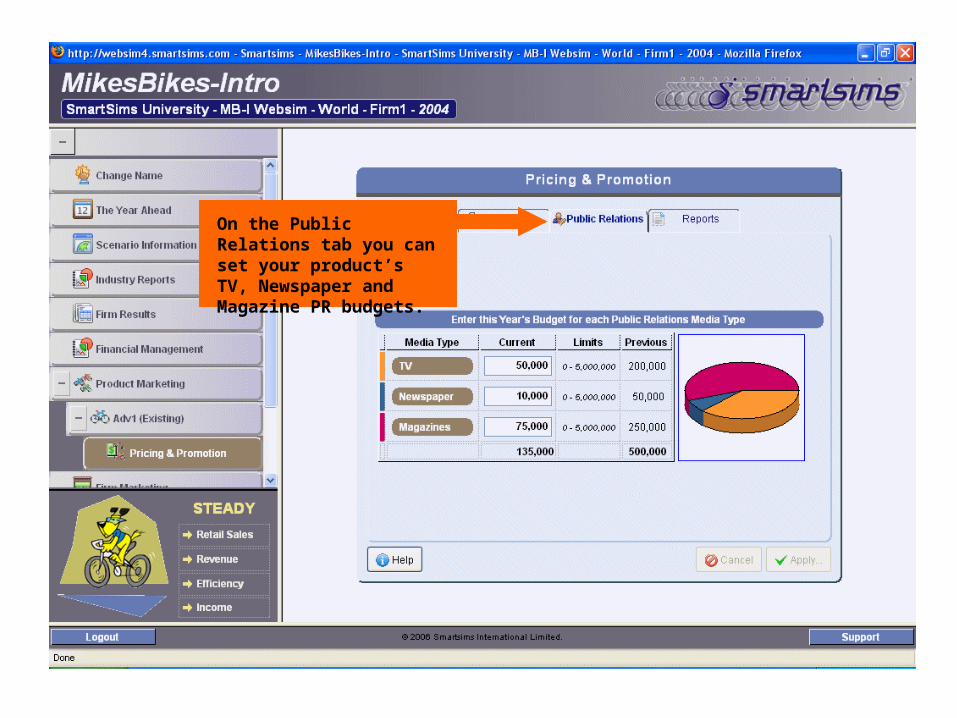
On the Public Relations tab you can set your product’s TV, Newspaper and Magazine PR budgets.
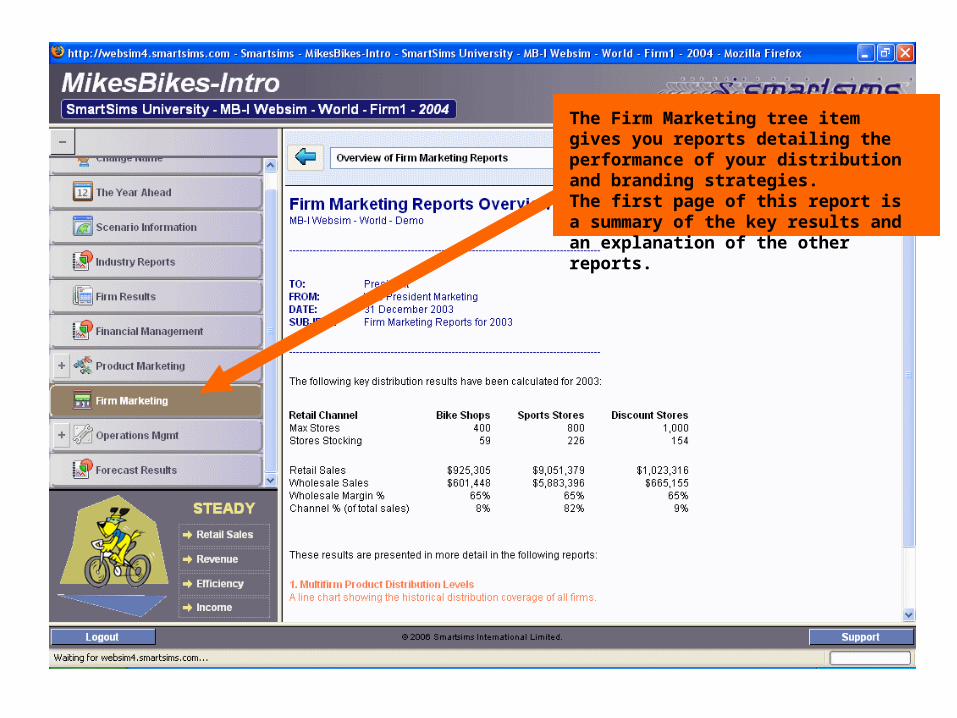
The Firm Marketing tree item gives you reports detailing the performance of your distribution and branding strategies. The first page of this report is a summary of the key results and an explanation of the other reports.
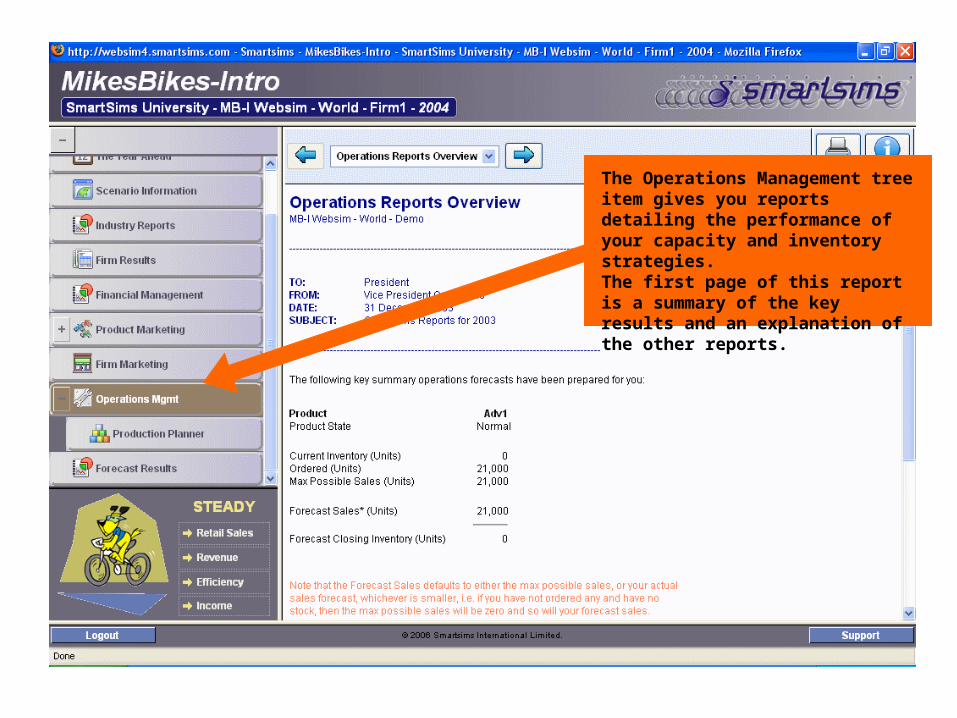
The Operations Management tree item gives you reports detailing the performance of your capacity and inventory strategies. The first page of this report is a summary of the key results and an explanation of the other reports.
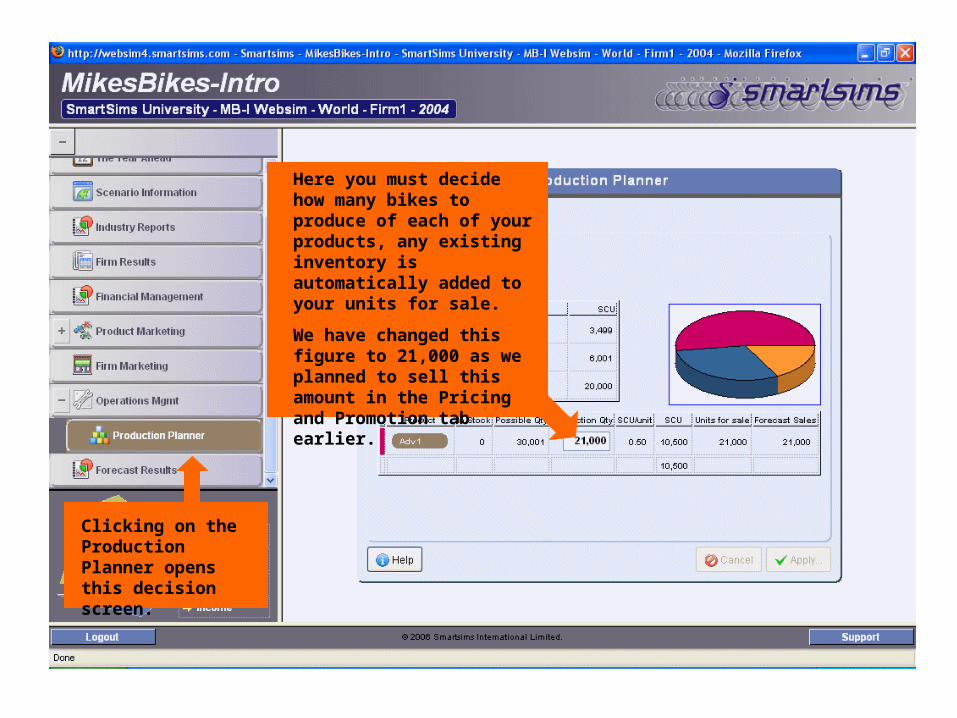
Clicking on the Production Planner opens this decision screen.
Here you must decide how many bikes to produce of each of your products, any existing inventory is automatically added to your units for sale.
We have changed this figure to 21,000 as we planned to sell this amount in the Pricing and Promotion tab earlier.
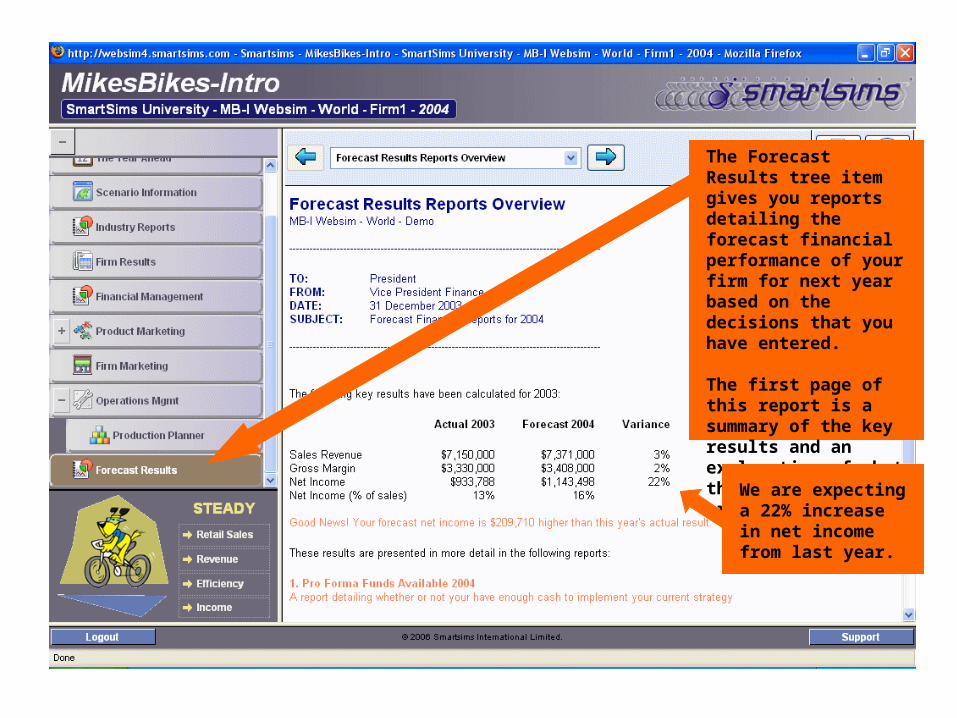
The Forecast Results tree item gives you reports detailing the forecast financial performance of your firm for next year based on the decisions that you have entered.
The first page of this report is a summary of the key results and an explanation of what the other reports are.
We are expecting a 22% increase in net income from last year.
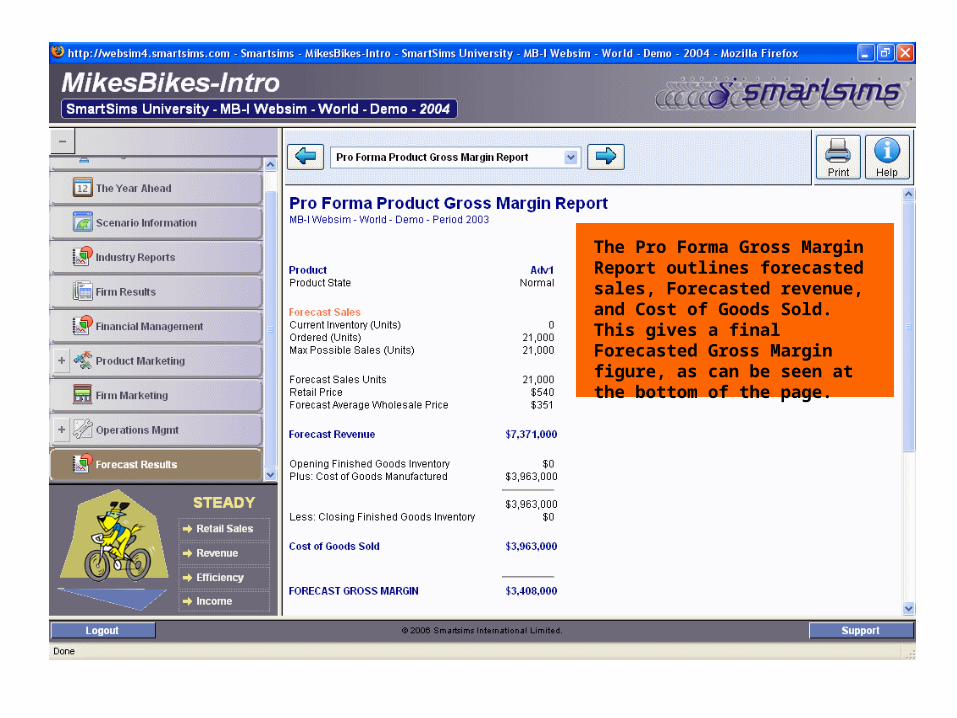
The Pro Forma Gross Margin Report outlines forecasted sales, Forecasted revenue, and Cost of Goods Sold. This gives a final Forecasted Gross Margin figure, as can be seen at the bottom of the page.
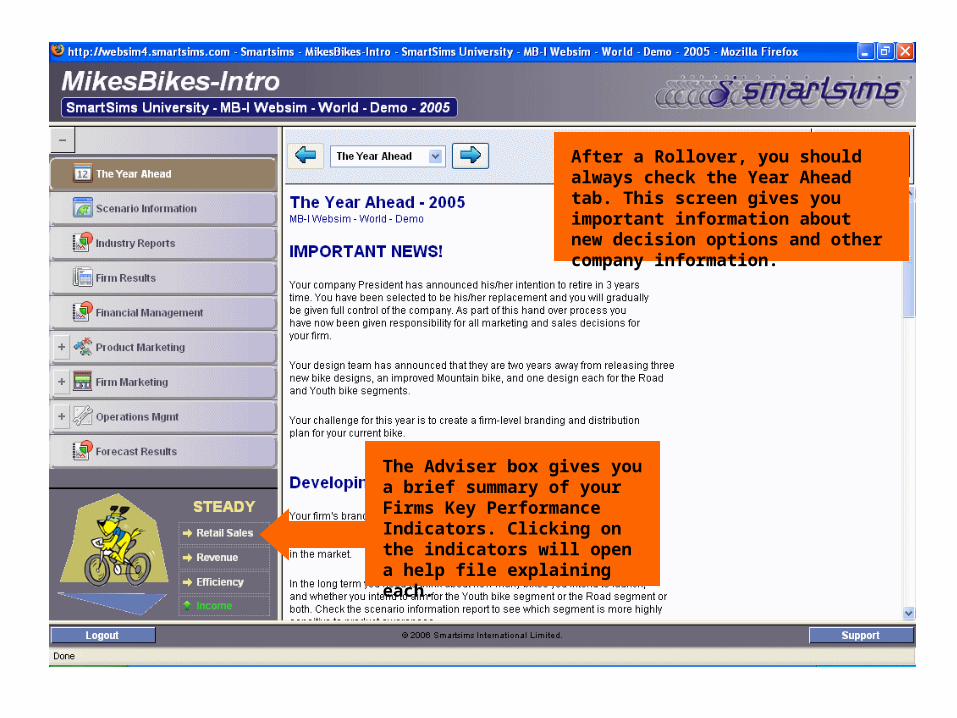
After a Rollover, you should always check the Year Ahead tab. This screen gives you important information about new decision options and other company information.
The Adviser box gives you a brief summary of your Firms Key Performance Indicators. Clicking on the indicators will open a help file explaining each.
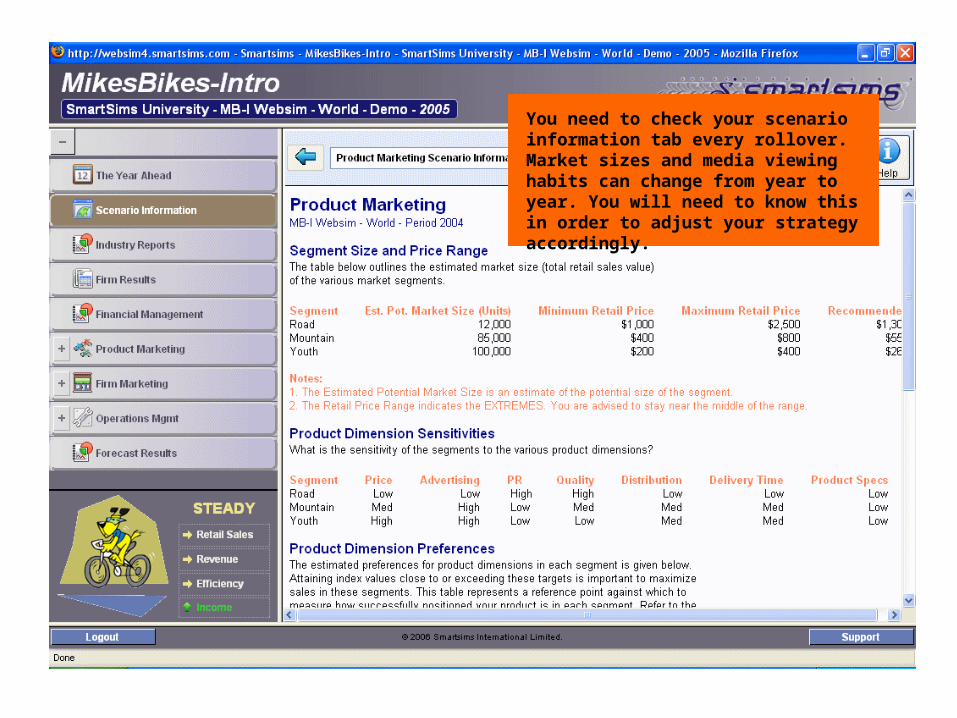
You need to check your scenario information tab every rollover. Market sizes and media viewing habits can change from year to year. You will need to know this in order to adjust your strategy accordingly.
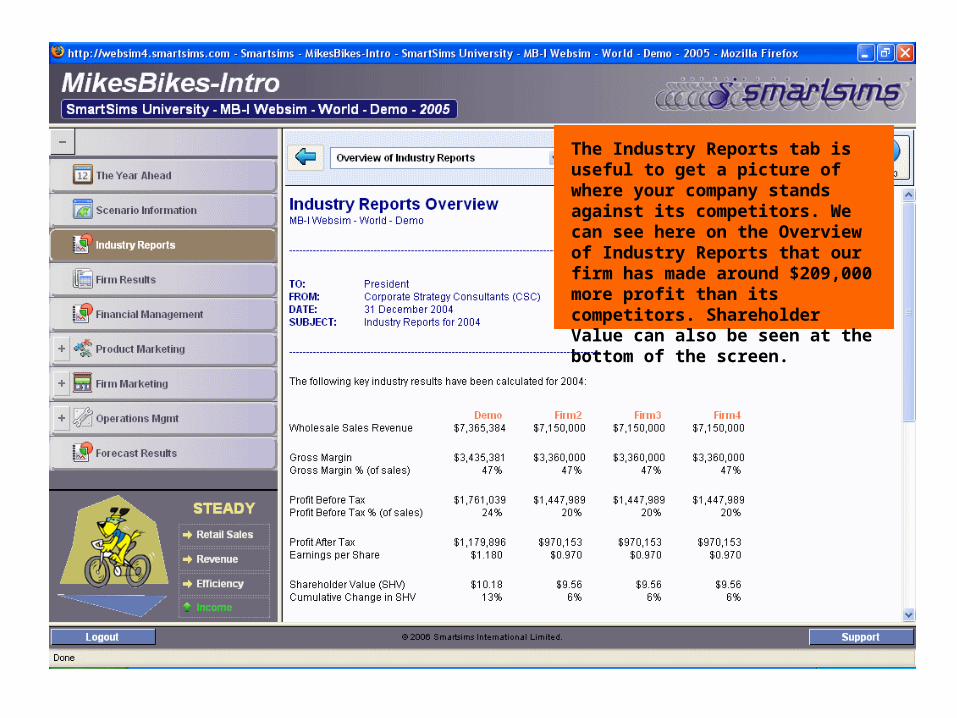
The Industry Reports tab is useful to get a picture of where your company stands against its competitors. We can see here on the Overview of Industry Reports that our firm has made around $209,000 more profit than its competitors. Shareholder Value can also be seen at the bottom of the screen.
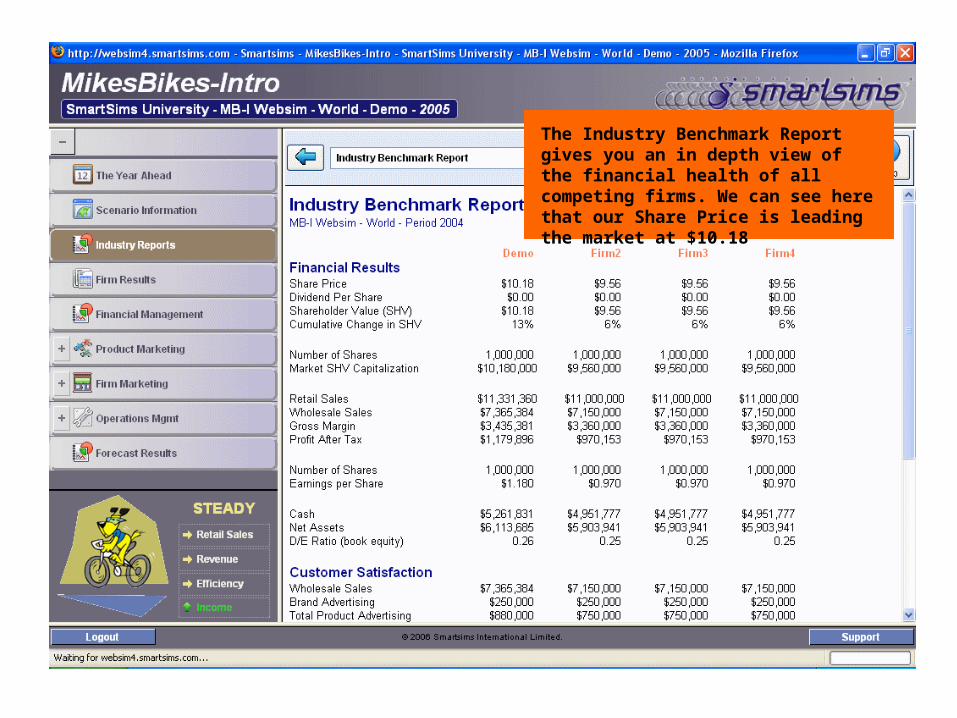
The Industry Benchmark Report gives you an in depth view of the financial health of all competing firms. We can see here that our Share Price is leading the market at $10.18
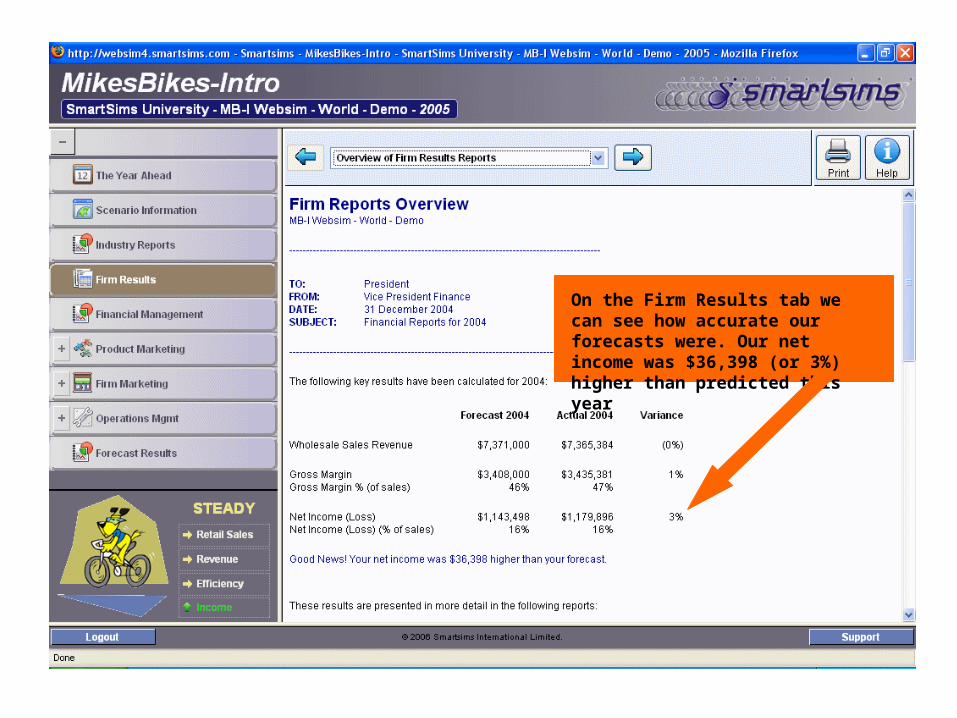
On the Firm Results tab we can see how accurate our forecasts were. Our net income was $36,398 (or 3%) higher than predicted this year
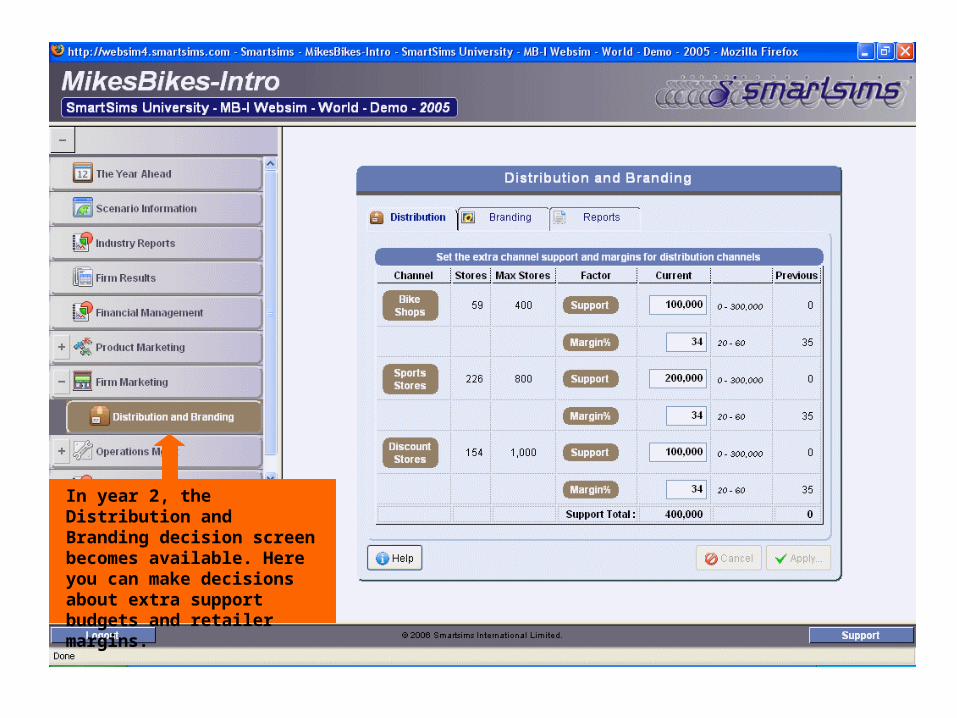
In year 2, the Distribution and Branding decision screen becomes available. Here you can make decisions about extra support budgets and retailer margins.
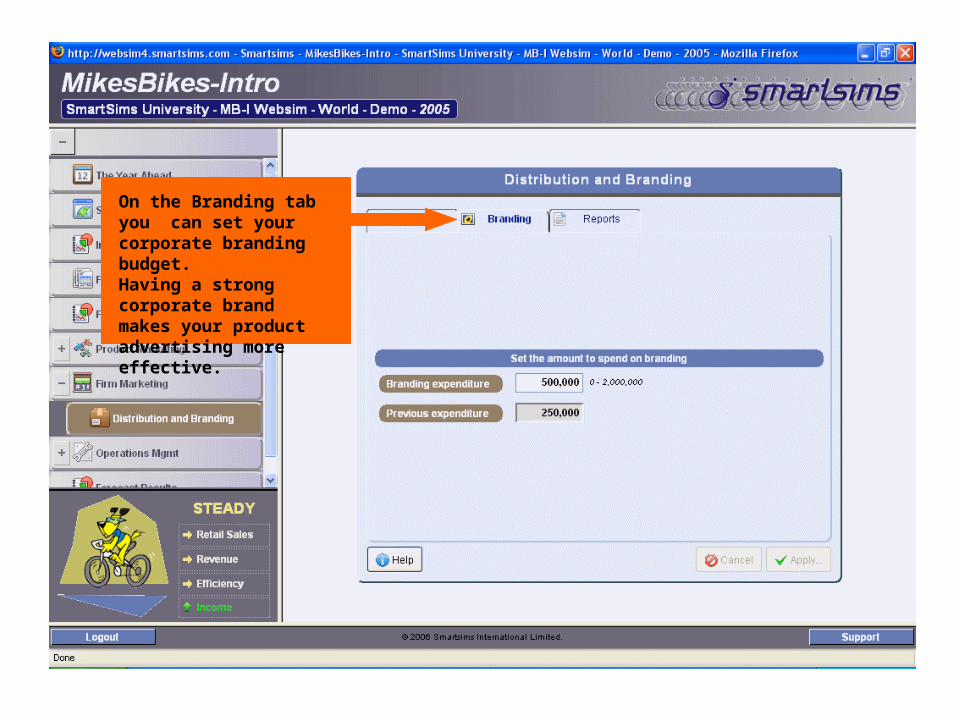
On the Branding tab you can set your corporate branding budget.Having a strong corporate brand makes your product advertising more effective.
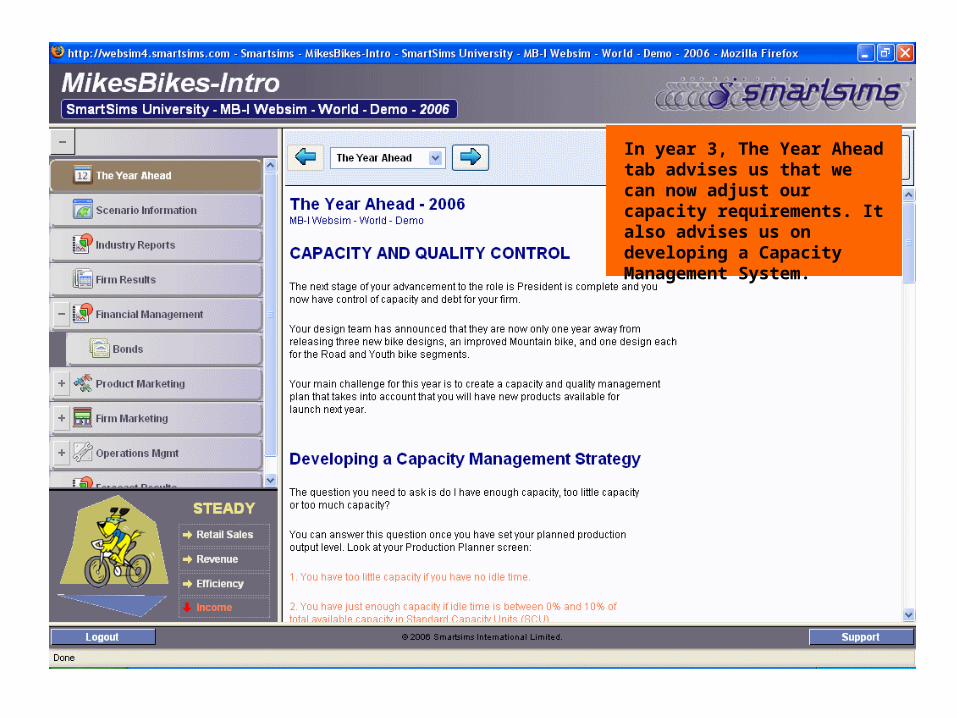
In year 3, The Year Ahead tab advises us that we can now adjust our capacity requirements. It also advises us on developing a Capacity Management System.
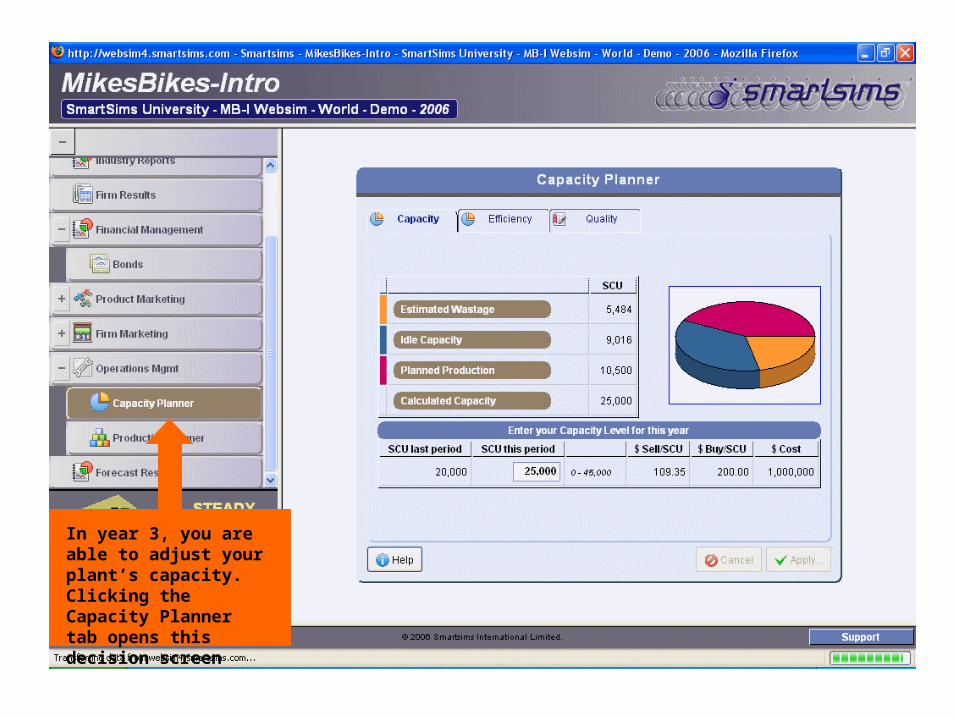
In year 3, you are able to adjust your plant’s capacity. Clicking the Capacity Planner tab opens this decision screen
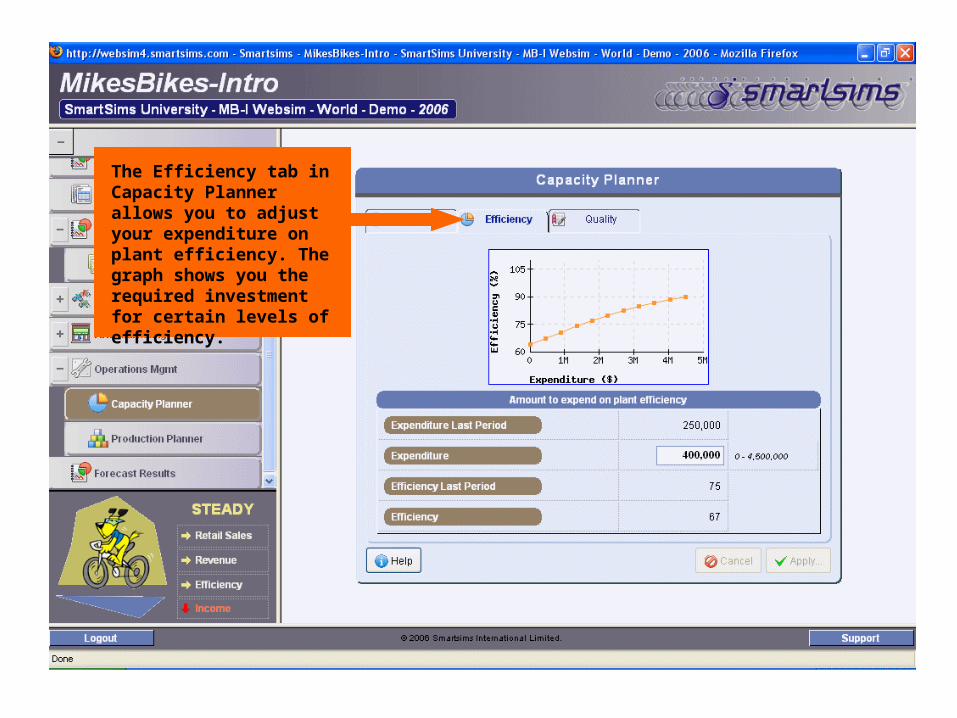
The Efficiency tab in Capacity Planner allows you to adjust your expenditure on plant efficiency. The graph shows you the required investment for certain levels of efficiency.
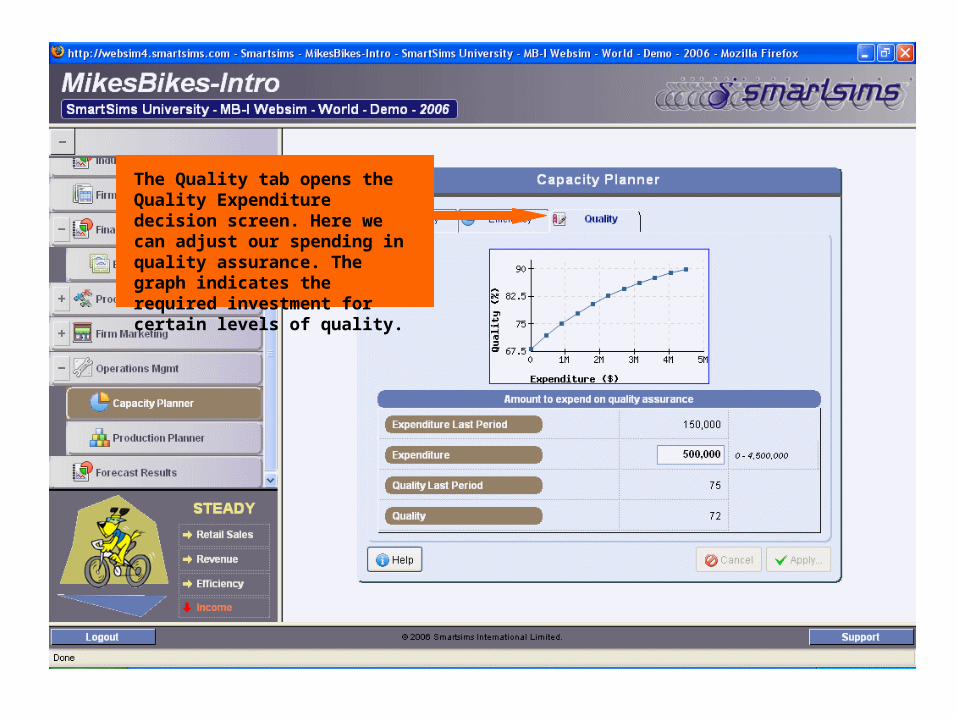
The Quality tab opens the Quality Expenditure decision screen. Here we can adjust our spending in quality assurance. The graph indicates the required investment for certain levels of quality.
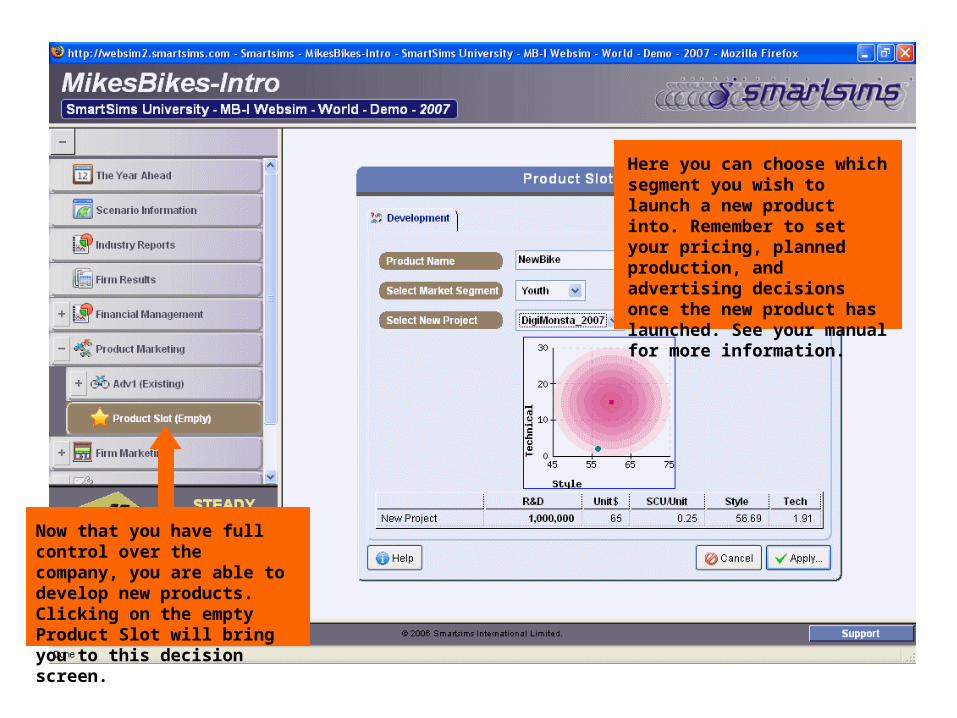
Now that you have full control over the company, you are able to develop new products. Clicking on the empty Product Slot will bring you to this decision screen.
Here you can choose which segment you wish to launch a new product into. Remember to set your pricing, planned production, and advertising decisions once the new product has launched. See your manual for more information.
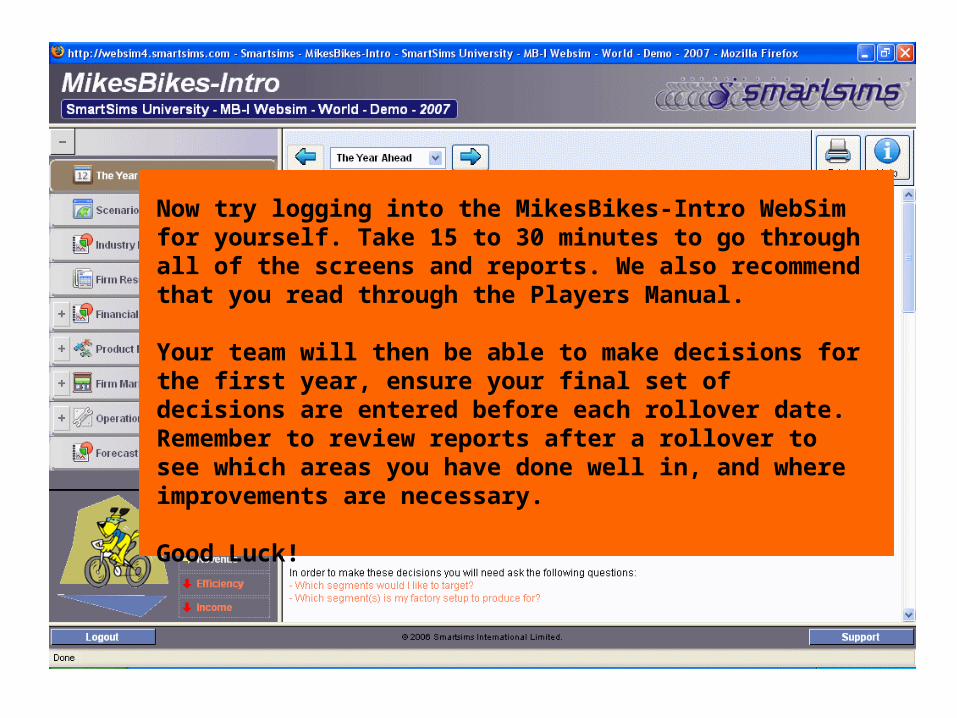
Now try logging into the MikesBikes-Intro WebSim for yourself. Take 15 to 30 minutes to go through all of the screens and reports. We also recommend that you read through the Players Manual.
Your team will then be able to make decisions for the first year, ensure your final set of decisions are entered before each rollover date. Remember to review reports after a rollover to see which areas you have done well in, and where improvements are necessary.
Good Luck!


