Level 12, 680 George Street Tower 4, 727 Collins Street Level 15, 324 Queen Street Level 12, 250 St Georges Terrace SYDNEY NSW 2000 DOCKLANDS VIC 3008 BRISBANE QLD 4000 PERTH WA 6000 3 May 2017 ASX ANNOUNCEMENT ASX Market Announcements Office ASX Limited 20 Bridge Street SYDNEY NSW 2000 Presentation to Macquarie Australia Conference 2017 Attached is a copy of the Link Administration Holdings Limited (ASX code: LNK) (Link Group) presentation to be delivered at the Macquarie Australia Conference 2017 on 3 May 2017. ENDS Investor Relations Contact – Craig Curry, Link Group +61 403 747 901 Media Contact – Ben Wilson, GRACosway +61 407 966 083 All correspondence to: Locked Bag A14 Sydney South NSW 1235 Australia Link Administration Holdings Limited ABN 27 120 964 098 For personal use only
Transcript
Level 12, 680 George Street Tower 4, 727 Collins Street Level 15, 324 Queen Street Level 12, 250 St Georges Terrace SYDNEY NSW 2000 DOCKLANDS VIC 3008 BRISBANE QLD 4000 PERTH WA 6000
3 May 2017 ASX ANNOUNCEMENT ASX Market Announcements Office ASX Limited 20 Bridge Street SYDNEY NSW 2000 Presentation to Macquarie Australia Conference 2017 Attached is a copy of the Link Administration Holdings Limited (ASX code: LNK) (Link Group) presentation to be delivered at the Macquarie Australia Conference 2017 on 3 May 2017. ENDS Investor Relations Contact – Craig Curry, Link Group +61 403 747 901 Media Contact – Ben Wilson, GRACosway +61 407 966 083
All correspondence to: Locked Bag A14 Sydney South NSW 1235 Australia
Link Administration Holdings Limited ABN 27 120 964 098
For
per
sona
l use
onl
y
Investor PresentationMacquarie Australia Conference 2017
Wednesday, 3 May 2017
4:00pm (AEST)
For
per
sona
l use
onl
y
LINK GROUP ● 2Link Group Investor Presentation • 3 May 2017
This presentation has been prepared by Link Administration Holdings Pty Limited (Company) together with its related bodies corporate (Link Group). The material contained in this presentation is intended to be general background information on Link Group and its activities.
The information is supplied in summary form and is therefore not necessarily complete. It should be read in conjunction with the Company’s other periodic and continuous disclosure announcements filed with the Australian Securities Exchange, and in particular, the company’s half year results for the six months ended 31 December 2016. It is not intended that it be relied upon as advice to investors or potential investors, who should consider seeking independent professional advice depending upon their specific investment objectives, financial situation or particular needs. The material contained in this presentation may include information derived from publicly available sources that have not been independently verified. No representation or warranty is made as to the accuracy, completeness or reliability of the information.
All amounts are in Australian dollars unless otherwise indicated.
Unless otherwise noted, financial information in this presentation is based on A-IFRS. Link Group uses certain measures to manage and report on its business that are not recognised under Australian Accounting Standards or IFRS. These measures are collectively referred to in this presentation as ‘non-IFRS financial measures’ under Regulatory Guide 230 ‘Disclosing non-IFRS financial information’ published by ASIC. Management uses these non-IFRS financial measures to evaluate the performance and profitability of the overall business and the Company believes that they are useful for investors to understand the Company’s financial condition and results of operations. This information is also important for comparative purposes with the use of those measures in the Company’s IPO Prospectus dated 30 September 2015. Non-IFRS measures are defined on slide 31 of the 2016 full year results presentation. The principal non-IFRS financial measures that are referred to in this presentation are Operating EBITDA and Operating EBITDA margin. Management uses Operating EBITDA to evaluate the operating performance of the business and each operating segment prior to the impact of significant items, the non-cash impact of depreciation and amortisation and interest and tax charges, which are significantly impacted by the historical capital structure and historical tax position of Link Group. Management uses Operating EBITDA to evaluate the cash generation potential of the business because it does not include significant items or the non-cash charges for depreciation and amortisation. However, the Company believes that it should not be considered in isolation or as an alternative to net operating free cash flow. Other non-IFRS financial measures used in the presentation include Recurring Revenue, gross revenue, EBITDA, EBITA, EBIT, Operating NPATA, working capital, capital expenditure, net operating free cash flow, net operating free cash flow conversion ratio and net debt. Significant items comprise business combination costs, bargain purchase gain and gain on consolidation, integration costs, IT business transformation and client migration costs. Unless otherwise specified those non-IFRS financial measures have not been subject to audit or review in accordance with Australian Accounting Standards.
Forward-looking statements are statements about matters that are not historical facts. Forward-looking statements appear in a number of places in this presentation and include statements regarding Link Group’s intent, belief or current expectations with respect to business and operations, market conditions, results of operations and financial condition, including, without limitation, future loan loss provisions, financial support to certain borrowers, indicative drivers, forecasted economic indicators and performance metric outcomes.
This presentation contains words such as ‘will’, ‘may’, ‘expect’, 'indicative', ‘intend’, ‘seek’, ‘would’, ‘should’, ‘could’, ‘continue’, ‘plan’, ‘probability’, ‘risk’, ‘forecast’, ‘likely’, ‘estimate’, ‘anticipate’, ‘believe’, or similar words to identify forward-looking statements. These forward-looking statements reflect Link Group’s current views with respect to future events and are subject to change, certain risks, uncertainties and assumptions which are, in many instances, beyond the control of Link Group, and have been made based upon Link Group’s expectations and beliefs concerning future developments and their potential effect upon us. There can be no assurance that future developments will be in accordance with Link Group’s expectations or that the effect of future developments on Link Group will be those anticipated. Actual results could differ materially from those which Link Group expects, depending on the outcome of various factors. Factors that may impact on the forward-looking statements made include, but are not limited to, general economic conditions in Australia; exchange rates; competition in the markets in which Link Group will operate and the inherent regulatory risks in the businesses of Link Group.
When relying on forward-looking statements to make decisions with respect to Link Group, investors and others should carefully consider such factors and other uncertainties and events. Link Group is under no obligation to update any forward-looking statements contained in this presentation, where as a result of new information, future events or otherwise, after the date of this presentation.
Important noticeF
or p
erso
nal u
se o
nly
LINK GROUP ● 3Link Group Investor Presentation • 3 May 2017
Agenda
Link Group Overview
Operational Update
Q&A
Appendix: Additional business information
1
2
3
4
For
per
sona
l use
onl
y
LINK GROUP ● 4Link Group Investor Presentation • 3 May 2017
1. Link Group Overview
For
per
sona
l use
onl
y
LINK GROUP ● 5Link Group Investor Presentation • 3 May 2017
Link Group is a market leading technology-enabled company
Link Group is a market leading administrator of financial ownership data, underpinned by investment in technology, people and processes
1. Divisional percentages based on gross revenue prior to eliminations.
2. No pro forma adjustments have been made to statutory revenue in the FY2016 results.3. Recurring Revenue is revenue arising from contracted core administration services, stakeholder engagement services, share registry services and shareholder management and analytics services that are unrelated to
corporate actions, expressed as a percentage of total revenue.4. Based on the closing share price of $7.73 (28 April 2017)
At a glance, Link Group currently:
� Listed on the ASX (LNK) in October 2015
� Market Capitalisation A$2.8 billion4
� Included in the S&P / ASX 100 from December 2016
Leading market position in attractive industries
Leading market position in attractive industries
Adding value through Innovation and Technology
Adding value through Innovation and Technology
Defined Growth Strategy Defined Growth Strategy
1
2
390%
10%
Recurring Revenue
Other Revenue
Link Group’s divisional breakdown (By FY2016 revenue)1,2
Link Group’s revenue by type(By FY2016 revenue)2
3
58%21%
21%Fund Administration
Corporate Markets
Information, Digitial
and Data Services
For
per
sona
l use
onl
y
LINK GROUP ● 6Link Group Investor Presentation • 3 May 2017
Continuing to execute on Link Group’s growth strategy
The integration program secures medium term growth, with continued outsourcing and innovation to drive further growth
Growth through product and
service innovation
Growth through product and
service innovation
2
Growth through client, product and
regional expansions
Growth through client, product and
regional expansions
3
Identifying adjacent market
opportunities
Identifying adjacent market
opportunities
5
Growth through further penetration
of attractive industries
Growth through further penetration
of attractive industries
1
Realising integration
benefits
Realising integration
benefits
4
� Continue to explore prospective opportunities
� Launched new innovation hub and ‘Link Labs’ in Melbourne
� Launched new employer app for superfunds
� First hybrid AGM for an Australian incorporated company in S&P / ASX200 (Link Group)
� Expanded capability through an investment in Moneysoft - a personal wealth management product
� Added scale to the Managed Fund Outsourcing business through the acquisition of White Outsourcing
� Migration program complete
� On track to achieve targeted synergies
� Continue to be actively assessing a range of corporate and other actionable targets
Link Group’s growth strategy is focused on five major driversLink Group’s growth strategy is focused on five major drivers
1. FY2013 – FY2016 Operating EBITDA includes public company costs and excludes significant items.
Operating EBITDA (A$m)
Operating EBITDA margin
For
per
sona
l use
onl
y
LINK GROUP ● 9Link Group Investor Presentation • 3 May 2017
SMSF
25%Link
16%
Mercer
6%
Other
0%
In-house administered
52%
No.1 administrator in the fourth largest pension pool globally
1. Based on Towers Watson Global Pension Assets Study 2015. Presents 2014 data. As at 30 June 2015, the Australian superannuation system has over $2.0 trillion in FuM; 2. Based on FY2004 and FY2014 FuM in Australian dollars; 3. Based on APRA Superannuation Bulletin 2013, revised February 2014; APRA Quarterly Superannuation Performance March 2015, issued 21 May 2015. Projections based on data from Rice Warner (2015); 4. Based on Link Group’s analysis of APRA Superannuation data; Annual Fund-level Superannuation Statistics (June 2015 edition).
Global pension asset pools (2014) and last decade growth1
22.1
3.32.9
1.7 1.5 1.50.8
0.5 0.5 0.3
0.0
1.0
2.0
3.0
4.0
5.0
6.0
Tota
l asset pool 2014 (
US
$tn
)
0.0
1.0
2.0
3.0
4.0
FY2004 FY2009 FY2014 FY2019 FY2024 FY2029
FuM
(A$tn
)
Total Australian superannuation industry size3
Australian superannuation administration providers
25.0
CY2004 – CY2014 CAGR (%)
6.6% 6.5% (0.3%) 11.2% 7.3% 7.0% 4.5% 6.3% na 9.7%2
Fragmented market = Opportunity
By Members4
By FuM4
SMSF
4%
Link
34%
Mercer
6%
Other
1%
In-house
administered
55%
For
per
sona
l use
onl
y
LINK GROUP ● 10Link Group Investor Presentation • 3 May 2017
Operational scale provides opportunity in Fund Administration
EfficiencyEfficiency
CompetivenessCompetiveness
IntegrityIntegrity
• Dynamic regulatory environment• Requires flexible, agile systems• Historically low margins and low level of
reinvestment
• Dynamic regulatory environment• Requires flexible, agile systems• Historically low margins and low level of
reinvestment
• Many operational participants• Many operating models available for
participants• Potential for further technology solutions
• Many operational participants• Many operating models available for
participants• Potential for further technology solutions
• Increasing reliance on technology & interconnectivity
• Data security and privacy risks• Stable IT infrastructure requirements
• Increasing reliance on technology & interconnectivity
• Data security and privacy risks• Stable IT infrastructure requirements
� Proven proprietary technology: cost of regulatory change diffused across a broad client base
� $300m invested over last 10 years� Open & neutral platform encouraging integration with other
participants e.g. DIO, API’s, Annuities, Insurance, etc.
� Proven proprietary technology: cost of regulatory change diffused across a broad client base
� $300m invested over last 10 years� Open & neutral platform encouraging integration with other
participants e.g. DIO, API’s, Annuities, Insurance, etc.
� Providing a scaled alternative for funds� Flexible operating model (i.e. ability to insource certain
functions as desired)� Annual spend on IT exceeding $100 million
� Providing a scaled alternative for funds� Flexible operating model (i.e. ability to insource certain
functions as desired)� Annual spend on IT exceeding $100 million
� Publicly listed with a market capitalisation of A$2.8 billion1
� ISO 27001 certification� Low levels of gearing
� Publicly listed with a market capitalisation of A$2.8 billion1
� ISO 27001 certification� Low levels of gearing
ObjectiveObjective Market AttributeMarket Attribute Link Group’s response Link Group’s response
Link Group continues to:
• meet the requirements of an industry that has historically suffered from low levels of reinvestment
• offer a valued alternative to in-house administration by providing scale, proprietary technology and quality of service
• remain well placed to benefit from scale and further outsourcing
1. Based on the closing share price of $7.73 (28 April 2017).
For
per
sona
l use
onl
y
LINK GROUP ● 11Link Group Investor Presentation • 3 May 2017
38%38%
Link Group has developed valuable experience in a range of jurisdictions to help support the identification and assessment of offshore growth opportunities
Leading Corporate Markets operations across multiple jurisdictions
Source: ASX, publicly available stock exchange data
1. Based on the number of companies serviced in the index as at June 2016. These figures are for a subset of services which may form part of a broader service (for which there are a number of alternative suppliers).
2. Length of operation relates only to the period of operation as part of Link Group. Local management teams have substantially longer industry experience in each corresponding region.
Corporate Markets product suite, geographic footprint and market position1
Link Group Global Share Alliance (Excl. Link Group)
Regional Footprint
Corporate Markets
Revenue Contribution
UK
1
Germany
� 1
France
�
UAE
1
South Africa
1 2
Singapore
�
India
2
Hong Kong
� Papua New Guinea
1
New Zealand
1 2
Australia
1 2
Shareholder management and analytics
Stakeholder engagement
Share registry
Employee share plans
Company secretarial
1 No.1 position
2 No.2 position
� Leading position
North America
International
ANZ
Link Group Operational History2
Years
0 5 10 15
PNG
UAE
Singapore
France
Germany
Sth Africa
India
HK
UK
New Zealand
Australia
For
per
sona
l use
onl
y
LINK GROUP ● 12Link Group Investor Presentation • 3 May 2017
Corporate Markets – an integrated offering enhancing growth
Link Group provides a comprehensive corporate markets solution, delivered through a single, integrated platform. Link Group is a leading player in all key markets in which it operates.
Corporate Markets
Stakeholder
engagementShare registry
Employee share
plans
Company
Secretarial
Shareholder
management &
analytics
• Global equity plan
platform
• Plan design
• Administration
• Trustee services
• Share trading
• Proxy solicitation
• Bond transaction
management &
communication
• Insolvency
solutions
• Register
maintenance
• Treasury
• Meetings
• Capital market
services
• Investor
communications
• Share ownership
analysis
• Market intelligence
• Investor
communications
• Shareholder
management
technology
• Corporate legal
services
• Company
secretarial services
• CFO services
• Corporate
administration
solutions
Corporate
Services
• Managed funds
outsourcing
• Fund accounting
• Trustee services
• Custody
• Escrow services
• Share sale facility
For
per
sona
l use
onl
y
LINK GROUP ● 13Link Group Investor Presentation • 3 May 2017
2. Operational update
For
per
sona
l use
onl
y
LINK GROUP ● 14Link Group Investor Presentation • 3 May 2017
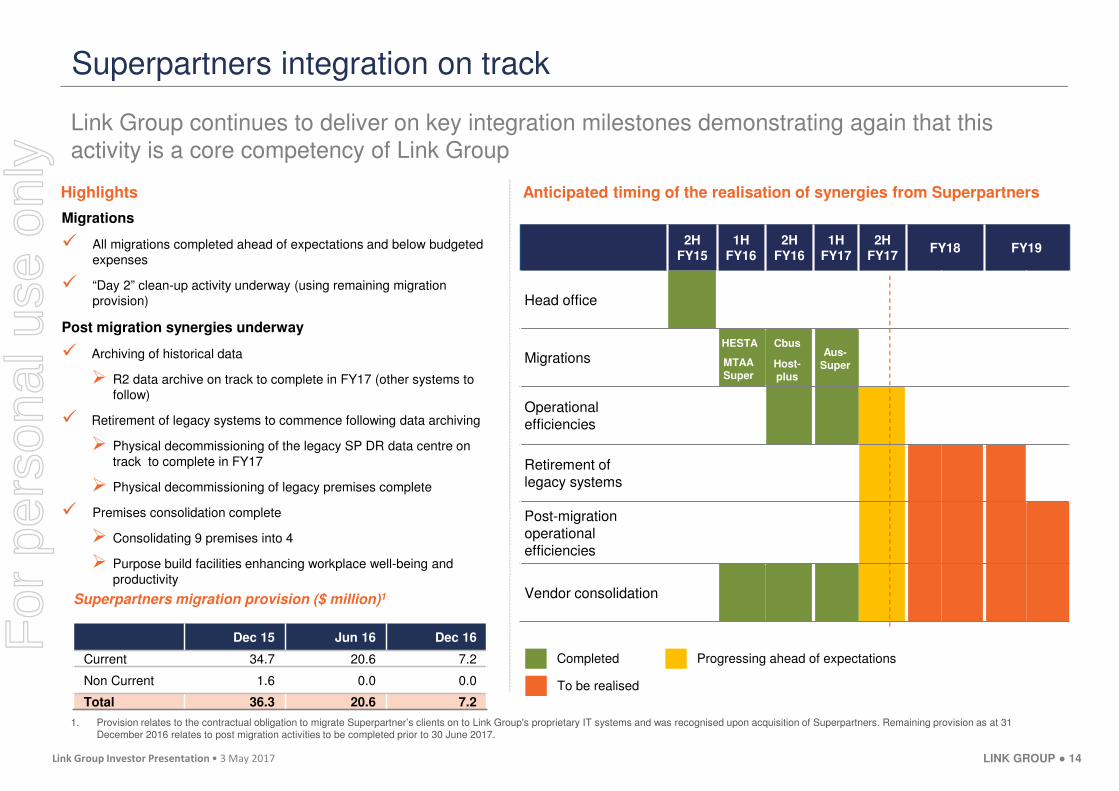
Superpartners integration on track
Link Group continues to deliver on key integration milestones demonstrating again that this activity is a core competency of Link Group
2HFY15
1HFY16
2HFY16
1HFY17
2HFY17
FY18 FY19
Head office
Migrations
Operationalefficiencies
Retirement of legacy systems
Post-migration operational efficiencies
Vendor consolidation
HESTA
MTAASuper
Cbus
Host-plus
Aus-Super
Anticipated timing of the realisation of synergies from SuperpartnersHighlights
Completed
Superpartners migration provision ($ million)1
Dec 15 Jun 16 Dec 16
Current 34.7 20.6 7.2
Non Current 1.6 0.0 0.0
Total 36.3 20.6 7.2
To be realised
1. Provision relates to the contractual obligation to migrate Superpartner’s clients on to Link Group's proprietary IT systems and was recognised upon acquisition of Superpartners. Remaining provision as at 31 December 2016 relates to post migration activities to be completed prior to 30 June 2017.
Migrations
� All migrations completed ahead of expectations and below budgeted expenses
� R2 data archive on track to complete in FY17 (other systems to follow)
� Retirement of legacy systems to commence following data archiving
� Physical decommissioning of the legacy SP DR data centre on track to complete in FY17
� Physical decommissioning of legacy premises complete
� Premises consolidation complete
� Consolidating 9 premises into 4
� Purpose build facilities enhancing workplace well-being and productivity
Progressing ahead of expectations
For
per
sona
l use
onl
y
LINK GROUP ● 15Link Group Investor Presentation • 3 May 2017
34%
25%25%
27%
35%
23%21%
24%24%
17% 17%
22%
15%
20%
25%
30%
35%
40%
FY2014 FY2015 FY2016 1H2017
Link Group IDDS Fund Administration
Earnings growth underpinned by integration opportunity
The integration program will continue to deliver significant operational efficiencies
Source: Management
1. Assumes no further and similar acquisitions or business combinations. Requires operational efficiencies to be realised and may not occur unless the operating processes are streamlined and the retirement of legacy systems are completed.
Link Group, Fund Administration and IDDS Operating EBITDA margin
Margins expected to progressively trend back to levels similar to that achieved in
pro forma FY20141
For
per
sona
l use
onl
y
LINK GROUP ● 16Link Group Investor Presentation • 3 May 2017
OperationsOperations
Outlook
1. Assumes no further and similar acquisitions or business combinations.
� Defensive earnings profile provides high degree of earnings visibility with high levels of Recurring Revenue
� Superpartners integration ahead of expectations
� Progressively return Link Group Operating EBITDA margins to 34% by FY20201
� Price reductions for the Superpartnersclients have occurred from March 2017 following the successful migration program
� Ongoing disciplined cost management
>
Capital managementCapital management
> � Strong balance sheet
� Low level of gearing retains maximum flexibility
� Robust cashflow
� Supporting a range of capital management options
� Interim dividend of 6.0 cents per share
>
>
>
>
Strong underlying business with a defined growth path
Well positioned for future growth
For
per
sona
l use
onl
y
LINK GROUP ● 17Link Group Investor Presentation • 3 May 2017
3. Q&A
For
per
sona
l use
onl
y
LINK GROUP ● 18Link Group Investor Presentation • 3 May 2017
4. Appendix: Additional business information
For
per
sona
l use
onl
y
LINK GROUP ● 19Link Group Investor Presentation • 3 May 2017
90%
10%
Recurring Revenue
Other Revenue
Link Group is a market leading technology-enabled company
Link Group is a market leading administrator of financial ownership data, underpinned by investment in technology, people and processes
1. Divisional percentages based on gross revenue prior to eliminations.
2. No pro forma adjustments have been made to statutory revenue in the FY2016 results.3. Recurring Revenue is revenue arising from contracted core administration services, stakeholder engagement services, share registry services and shareholder management and analytics services that are unrelated to
corporate actions, expressed as a percentage of total revenue.
Link Group’s divisional breakdown (By FY2016 revenue)1,2
Link Group’s revenue by type(By FY2016 revenue)2
3
At a glance, Link Group currently:
� Services approximately 10 million superannuation account holders and over 25 million individual shareholders
� Has operations in 11 countries worldwide, with Australia its largest market
� Has over 2,500 clients globally
� Employs approx. 4,300 full time equivalents (“FTE”)
� Completes over 20 million transactions per year
� Processes over $70 billion in payments per year
� Answers over 4.6 million calls per year
58%21%
21%Fund Administration
Corporate Markets
Information, Digitial
and Data Services
For
per
sona
l use
onl
y
LINK GROUP ● 20Link Group Investor Presentation • 3 May 2017
Divisional snapshot
1. Clients charged a weekly fee per member (invoiced monthly); 2. Driven by number of shareholder accounts serviced; 3. Includes margin income and corporate actions; 4. No pro forma adjustments have been made to statutory revenue in the FY2016 results; 5. Divisional percentages based on gross revenue prior to eliminations.
Underlying stakeholders
Key services � Core administration services
� Stakeholder education and advice
� Value-added data management and analytics
� Shareholder management and analytics
� Stakeholder engagement
� Share registry
� Employee share plans
� Core systems development and maintenance
� Digital communications and solutions
� Data analytics
Revenue model � Contract-based1 (typically 3 – 5 years)
� Contract-based2 (typically 2 – 3 years)
� Market related income less than 2% of FY2016 revenue3,4
� Revenue from supporting other divisions and external clients
� Fee-for-service and licence fees
FY2016 revenue contribution4,5
Fund AdministrationInformation, Digital &
Data Services (“IDDS”)Corporate Markets
Approximately 10 million superannuation account holders
Over 35 million financial recordsOver 25 million individual
shareholders
21%
21%
58%
For
per
sona
l use
onl
y
LINK GROUP ● 21Link Group Investor Presentation • 3 May 2017
Resilient earnings with uninterrupted Operating EBITDA growth
Over the past decade, Link Group has achieved uninterrupted Operating EBITDA growth and evolved from a share registry business to a provider of technology-enabled outsourced services
1. FY2013 – FY2016 Operating EBITDA includes public company costs and excludes significant items
LINK GROUP ● 22Link Group Investor Presentation • 3 May 2017
Link Group’s investment highlights
Leading market position in attractive industriesLeading market position in attractive industries1
Proprietary and scalable technology platformsProprietary and scalable technology platforms2
Large and loyal client baseLarge and loyal client base3
Strategically positioned for long-term growthStrategically positioned for long-term growth4
Strong financial profileStrong financial profile5
Track record of value creation through business combinations and migrationsTrack record of value creation through business combinations and migrations6
LINK GROUP ● 23Link Group Investor Presentation • 3 May 2017
SMSF
4%
Link
34%
Pillar
4%
Mercer
2%
Other
1%
In-house
administered
55%
SMSF
25%
Link
16%
Pillar
3%
In-house
administered
52%
Leading administrator in the fourth largest pension pool globally
1. Based on Towers Watson Global Pension Assets Study 2015. Presents 2014 data. As at 30 June 2015, the Australian superannuation system has over $2.0 trillion in FuM; 2. Based on FY2004 and FY2014 FuM in Australian Dollars; 3. Based on APRA Superannuation Bulletin 2013, revised February 2014; APRA Quarterly Superannuation Performance March 2015, issued 21 May 2015. Projections based on data from Rice Warner (2015); 4. Based on Link Group’s analysis of APRA Superannuation data; Annual Fund-level Superannuation Statistics (June 2015 edition).
Global pension asset pools (2014) and last decade growth1
22.1
3.32.9
1.7 1.5 1.50.8
0.5 0.5 0.3
0.0
1.0
2.0
3.0
4.0
5.0
6.0
Tota
l asset pool 2014 (
US
$tn
)
0.0
1.0
2.0
3.0
4.0
FY2004 FY2009 FY2014 FY2019 FY2024 FY2029
FuM
(A$tn
)
Total Australian superannuation industry size3
Australian superannuation administration providers
25.0
CY2004 – CY2014 CAGR (%)
6.6% 6.5% (0.3%) 11.2% 7.3% 7.0% 4.5% 6.3% na 9.7%2
Fragmented market = Opportunity
By Members4
Mercer
3%
By FuM4
For
per
sona
l use
onl
y
LINK GROUP ● 24Link Group Investor Presentation • 3 May 2017
Key outsourcing drivers Link proposition
Continually evolving and increasingly complex superannuation system imposes platform & administrative burdens
Link Group maintains control over its proprietary technology. The cost of regulatory change is disbursed across all clients
Service benefits to superannuation fund members is paramount
Link Group clients have access to a much broader array of product and specialist providers
High level of public and regulatory
scrutiny on costs
Link Group clients benefit from operating scale and genuine market based pricing
Data security and redundancyLink Group spends over $100 million per annum supporting and developing its technology
Link Group is well positioned to benefit from increased fund administration outsourcing given our competitive advantage from our proprietary technology, quality service offering and operating scale
Well positioned to benefit from further outsourcing
1. Estimates of administration and related fees based on data from Rice Warner (2015); number of members sourced from APRA, Fund Level Profiles and Financial Performance, issued 20 May 2015; 2. Proportion of total member accounts based on member accounts of APRA regulated and non-APRA regulated government superannuation funds and excludes SMSFs, based on data from Rice Warner (2015); APRA, Superannuation Bulletin 2013, revised February 2014.
�
�
�
Link Group well placed to benefit from further outsourcing
Fund name
% industry
admin. and
related fees
No. of
members as at
30 June 2014
Status of
administration
The Universal Super Scheme (NAB) 8% 1.2m In-house
AMP Superannuation Savings Trust 7% 2.4m In-house
AustralianSuper 5% 2.1mOutsourced
���� Link
State Public Sector Superannuation
Scheme (QSuper)5% 0.5m In-house
Retirement Wrap (Westpac) 4% 0.8m In-house
Colonial First State FirstChoice
Superannuation Trust (CBA)4% 0.8m In-house
Sunsuper Superannuation Trust 3% 1.1m In-house
Retail Employees Superannuation
Trust3% 2.1m
Outsourced
���� Link
Suncorp Master Trust 2% 0.2m In-house
OnePath Masterfund (ANZ) 2% 1.1m In-house
Only two of the ten largest super funds currently outsource
Australia’s ten largest funds by administration and related fees (2014)1
�
For
per
sona
l use
onl
y
LINK GROUP ● 25Link Group Investor Presentation • 3 May 2017
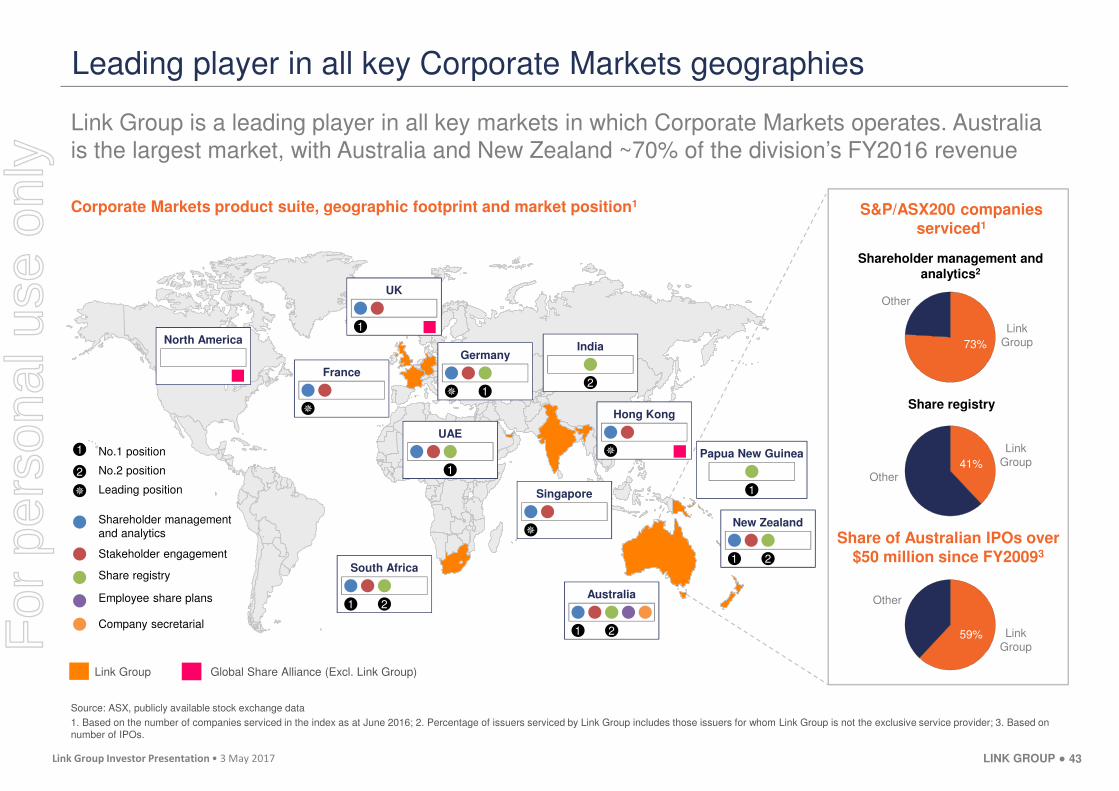
Link Group is a leading player in all key markets in which Corporate Markets operates. Australia is the largest market, with Australia and New Zealand ~70% of the division’s FY2016 revenue
Leading player in all key Corporate Markets geographies
Source: ASX, publicly available stock exchange data
1. Based on the number of companies serviced in the index as at June 2016; 2. Percentage of issuers serviced by Link Group includes those issuers for whom Link Group is not the exclusive service provider; 3. Based on number of IPOs.
Corporate Markets product suite, geographic footprint and market position1
Link Group Global Share Alliance (Excl. Link Group)
S&P/ASX200 companies serviced1
Shareholder management and analytics2
Share registry
Share of Australian IPOs over $50 million since FY20093
UK
1
Germany
� 1
France
�
UAE
1
South Africa
1 2
Singapore
�
India
2
Hong Kong
� Papua New Guinea
1
New Zealand
1 2
Australia
1 2
Shareholder management and analytics
Stakeholder engagement
Share registry
Employee share plans
Company secretarial
1 No.1 position
2 No.2 position
� Leading position
North America
43
Link Group
Link Group
Link Group
Other
Other
Other
73%
41%
59%For
per
sona
l use
onl
y
LINK GROUP ● 26Link Group Investor Presentation • 3 May 2017
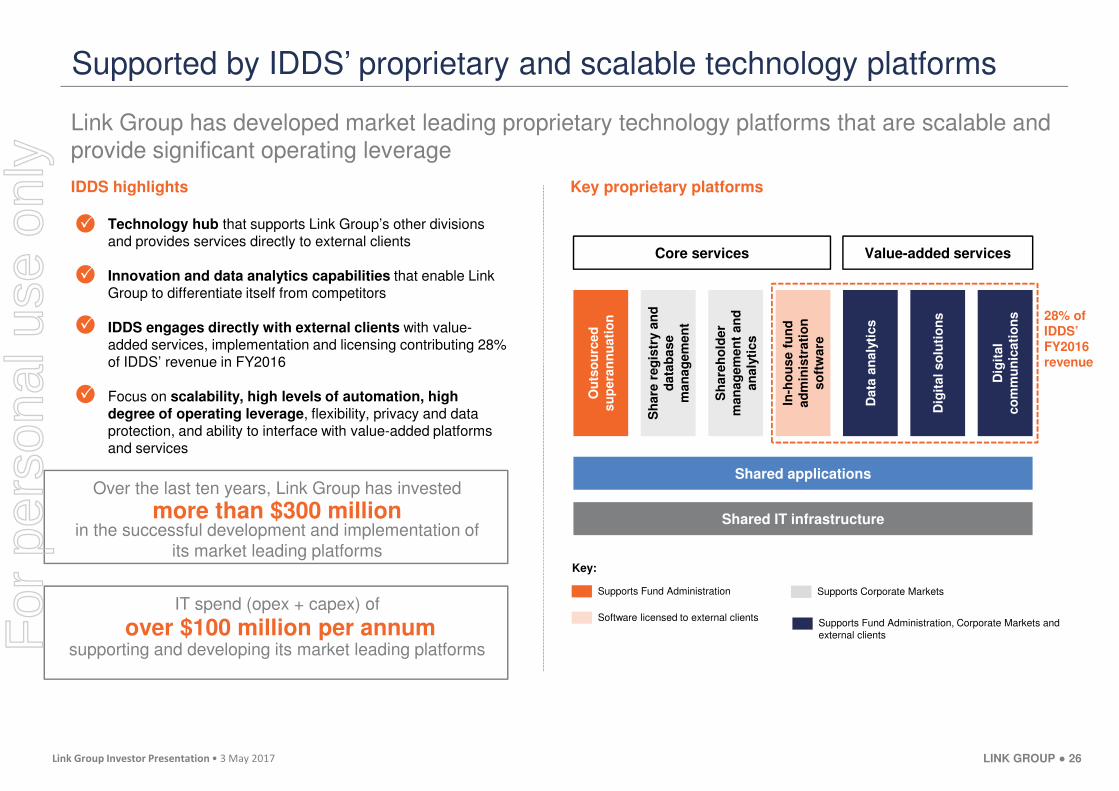
Supported by IDDS’ proprietary and scalable technology platforms
Link Group has developed market leading proprietary technology platforms that are scalable and provide significant operating leverage
Supports Fund Administration Supports Corporate Markets
Supports Fund Administration, Corporate Markets and external clients
Software licensed to external clients
Key proprietary platforms
Core services Value-added services
Shared applications
Shared IT infrastructure
Ou
tso
urc
ed
su
pera
nn
uati
on
Sh
are
reg
istr
y a
nd
d
ata
base
man
ag
em
en
t
Sh
are
ho
lder
man
ag
em
en
t an
d
an
aly
tics
In-h
ou
se f
un
d
ad
min
istr
ati
on
so
ftw
are
Data
an
aly
tics
Dig
ital so
luti
on
s
Dig
ital
co
mm
un
icati
on
s
Key:
28% of IDDS’ FY2016 revenue
IDDS highlights
� Technology hub that supports Link Group’s other divisions and provides services directly to external clients
� Innovation and data analytics capabilities that enable Link Group to differentiate itself from competitors
� IDDS engages directly with external clients with value-added services, implementation and licensing contributing 28% of IDDS’ revenue in FY2016
– Focus on scalability, high levels of automation, high degree of operating leverage, flexibility, privacy and data protection, and ability to interface with value-added platforms and services
�
�
�
�
Over the last ten years, Link Group has invested
more than $300 millionin the successful development and implementation of
its market leading platforms
IT spend (opex + capex) of
over $100 million per annumsupporting and developing its market leading platformsF
or p
erso
nal u
se o
nly
LINK GROUP ● 27Link Group Investor Presentation • 3 May 2017
Large and loyal client base driving high Recurring Revenue
Link Group’s business is characterised by medium to long term client contracts, strong Recurring Revenue and high levels of client retention
1. Where client was previously a Superpartners client, length of relationship shown includes relationship with predecessor entity; 2. Tenure refers to remainder of fixed contract term. Note that the contracts are terminable by the client without cause on between 3 and 12 months notice; 3. Based on actual FY2016 revenue. No pro forma adjustments have been made to statutory revenue in the pro forma forecast results; 4. Recurring Revenue is revenue arising from contracted core administration services, stakeholder engagement services, share registry services and shareholder management and analytics services that are unrelated to corporate actions, expressed as a percentage of total revenue.
Client contracts
Top 10 clientsLength of
relationship1
Remaining contract tenure from 30 June 20162
Client 1 >20 years 2 years ≤ contract tenure ≤ 4 years
Client 2 >20 years Contract tenure <1 year
Client 3 >20 years Contract tenure >4 years
Client 4 15 years Contract tenure >4 years
Client 5 >20 years Contract tenure >4 years
Client 6 3 years 2 years ≤ contract tenure ≤ 4 years
Client 7 15 years 2 years ≤ contract tenure ≤ 4 years
Client 8 >20 years Contract tenure <1 year
Client 9 >20 years 2 years ≤ contract tenure ≤ 4 years
Client 10 4 years 2 years ≤ contract tenure ≤ 4 yearsHigh proportion of Recurring Revenue4
47%
12%
41%
Top 5
Top 6-10
Other
Client examples Revenue concentration3
Fund Administration
Corporate Markets
� Quality of Link Group’s product and service offering