23
8/12/2019 Wednesday Report
http://slidepdf.com/reader/full/wednesday-report 1/23
8/12/2019 Wednesday Report
http://slidepdf.com/reader/full/wednesday-report 2/23
DO YOU KNOW THAT…
The United States has one of the safest water supplies in the world.
More than 3.4 million people die each year from water, sanitation, and
hygiene-related causes. Nearly all deaths, 99 percent, occur in the
developing world.
In 2011, 768 million people were still without access to improved sources
of drinking water while 2.5 billion people did not use improved sanitation.
Globally, diarrhea is the leading cause of illness and death, and 88 per
cent of diarrheal deaths are due to a lack of access to sanitation facilities,
together with inadequate availability of water for hygiene and unsafe
drinking water.

8/12/2019 Wednesday Report
http://slidepdf.com/reader/full/wednesday-report 3/23
WHAT IS THE PROBLEM?
Presently, COWD has been conducting periodic water qualitymonitoring with the parameters of pH level, turbidity, and the
residual chlorine of the water supplied by RVWCI before it reach
and mix with COWD water supply. Water samples from the
RVWCI pipeline are manually collected by COWD personnel
and analyzed in the laboratory for the purpose to characterizeand identify changes of trends in water quality before it reach
consumers and able to respond to emerging water quality
problems.
8/12/2019 Wednesday Report
http://slidepdf.com/reader/full/wednesday-report 4/23
The researchers sought to answer the
following:How can we improve the present water quality
monitoring system with less human
intervention?
8/12/2019 Wednesday Report
http://slidepdf.com/reader/full/wednesday-report 5/23
OBJECTIVES OF THE STUDY :
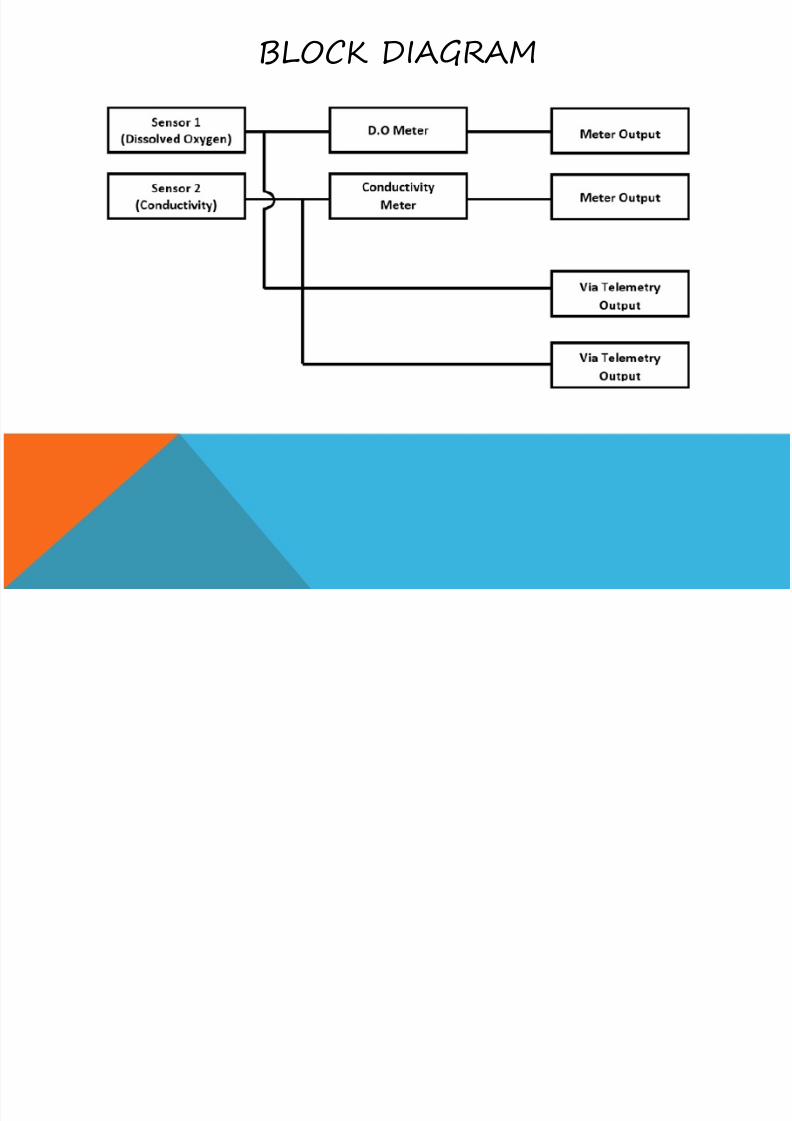
1. To design a remote monitoring system for water quality
parameters namely: dissolved oxygen and conductivity.
2. To develop a database that will received and store data.
3. To make a graphical user interface (GUI) that will display
and store the monitored parameters of quality of water
from the remote area.
This study aims to design and implement a monitoring
system to monitor specific parameters of water:

8/12/2019 Wednesday Report
http://slidepdf.com/reader/full/wednesday-report 6/23
Significance of the Study :
•
To the consumers, this project would help them know the quality ofwater that they are drinking because the readings of the monitored
parameters of water will be easily viewed online by visiting the website
that will be provided.
• To the COWD members, this project would help them conserve their
strengths and their time as well, because instead of going to the site
where the water source is located to get water samples and go back to
their laboratory to test those samples, they can easily remotely
monitor the water quality using telemetry.
8/12/2019 Wednesday Report
http://slidepdf.com/reader/full/wednesday-report 7/23
WATER QUALITY :
- refers to the chemical, physical and biological characteristics of
water.
Physical parameters are: Temperature, taste and odor, turbidity,
true color and total dissolved solids which can be link to
conductivity.
Chemical parameters are: hardness, pH and dissolved oxygen.
It is a measure of the condition of water relative to the
requirements of one or more biotic species and or to any human
need or purpose.

8/12/2019 Wednesday Report
http://slidepdf.com/reader/full/wednesday-report 8/23
WATER QUALITY INDICATORS

8/12/2019 Wednesday Report
http://slidepdf.com/reader/full/wednesday-report 9/23
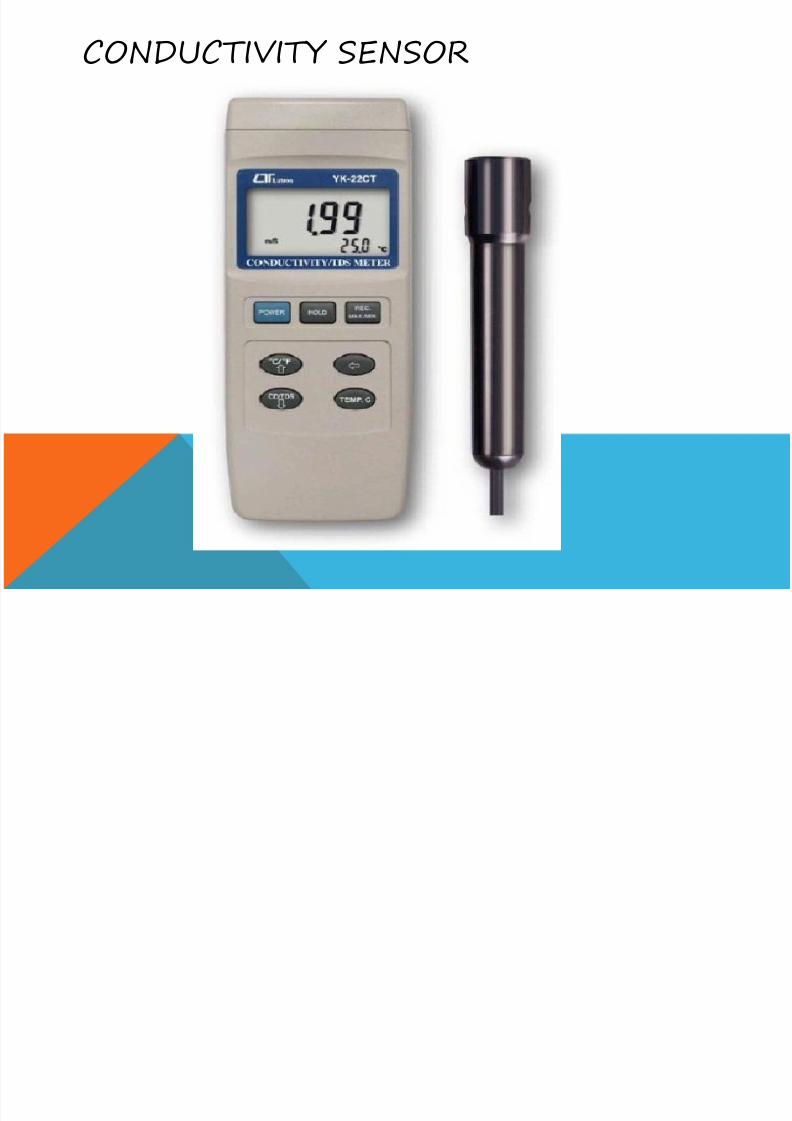
SENSORS USED:
Conductivity. in water is affected by the presence of inorganic
dissolved solids such as chloride, nitrate, sulfate, andphosphate anions (ions that carry a negative charge) or
sodium, magnesium, calcium, iron, and aluminum cations
(ions that carry a positive charge). Organic compounds like
oil, phenol, alcohol, and sugar DO NOT conduct electrical
current very well and therefore have a LOW conductivity whenin water. Conductivity is also affected by
Temperature: the warmer the water, the higher the conductivity.
Distilled water has conductivity in the range of 0.4 to 3 mS
8/12/2019 Wednesday Report
http://slidepdf.com/reader/full/wednesday-report 10/23
CONDUCTIVITY SENSOR
8/12/2019 Wednesday Report
http://slidepdf.com/reader/full/wednesday-report 11/23
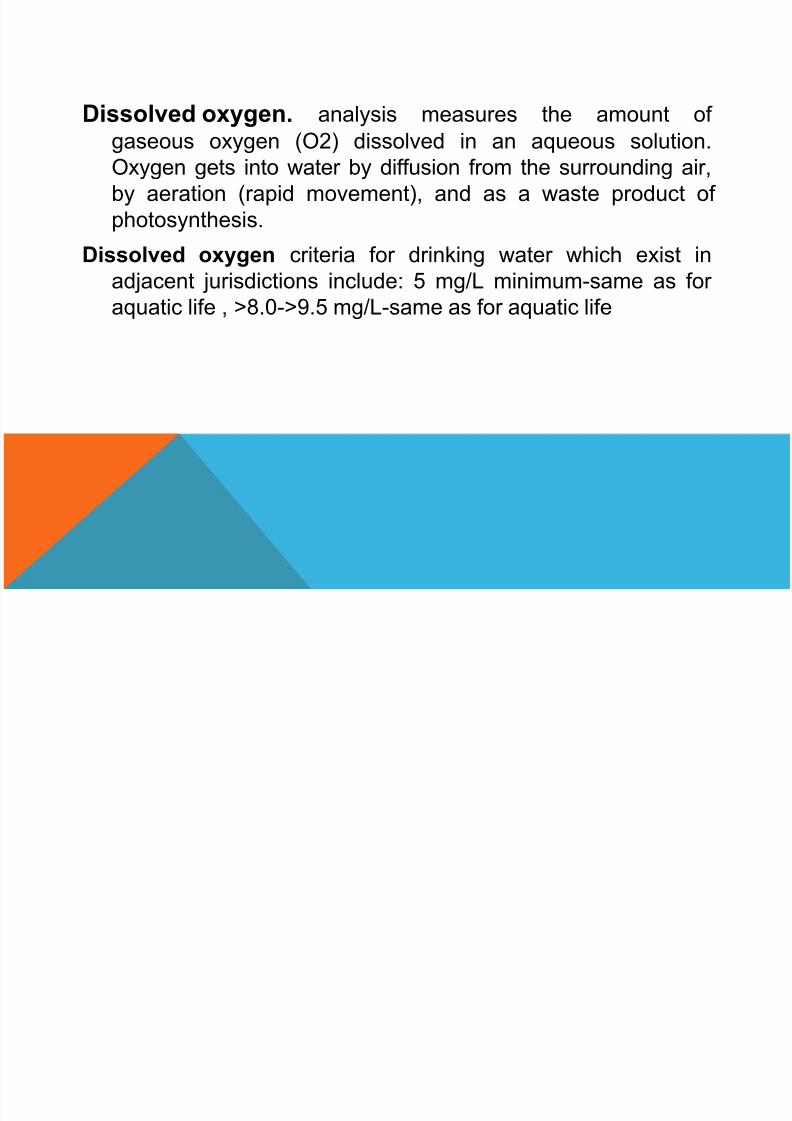
Dissolved oxygen. analysis measures the amount of
gaseous oxygen (O2) dissolved in an aqueous solution.Oxygen gets into water by diffusion from the surrounding air,
by aeration (rapid movement), and as a waste product of
photosynthesis.
Dissolved oxygen criteria for drinking water which exist in
adjacent jurisdictions include: 5 mg/L minimum-same as foraquatic life , >8.0->9.5 mg/L-same as for aquatic life

8/12/2019 Wednesday Report
http://slidepdf.com/reader/full/wednesday-report 12/23
DISSOLVED OXYGEN SENSOR
8/12/2019 Wednesday Report
http://slidepdf.com/reader/full/wednesday-report 13/23
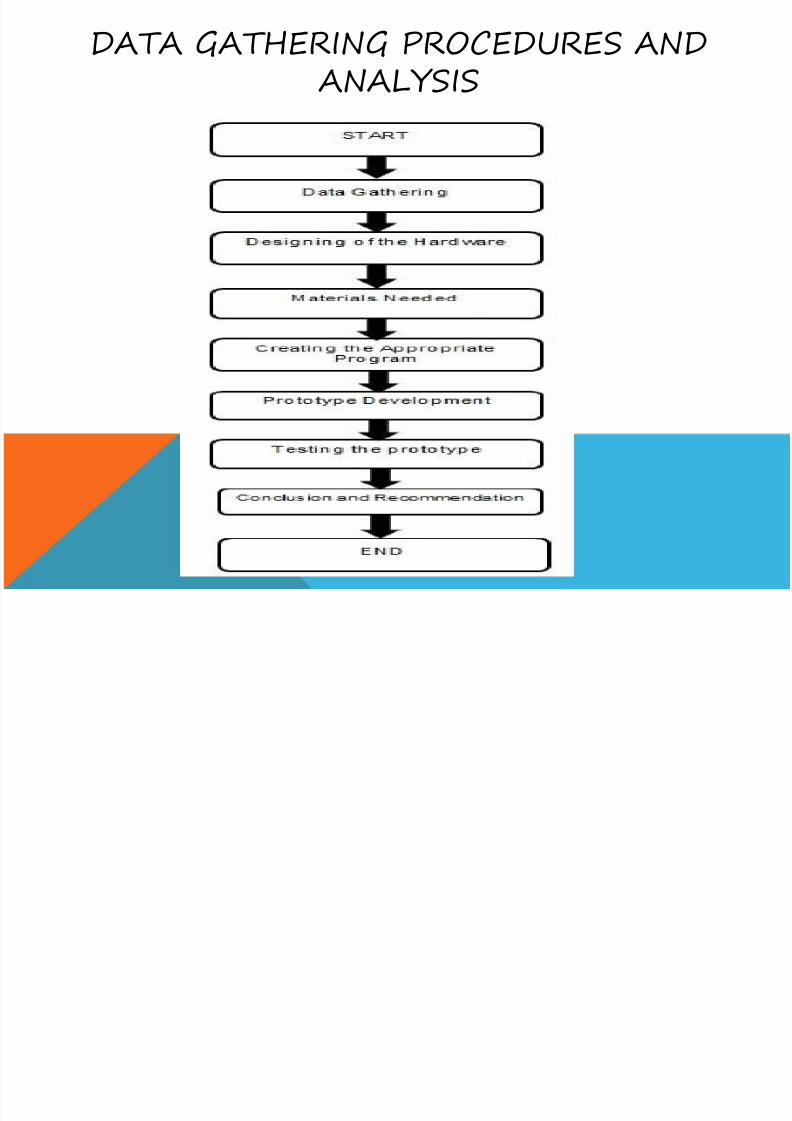
DATA GATHERING PROCEDURES AND ANALYSIS
8/12/2019 Wednesday Report
http://slidepdf.com/reader/full/wednesday-report 14/23
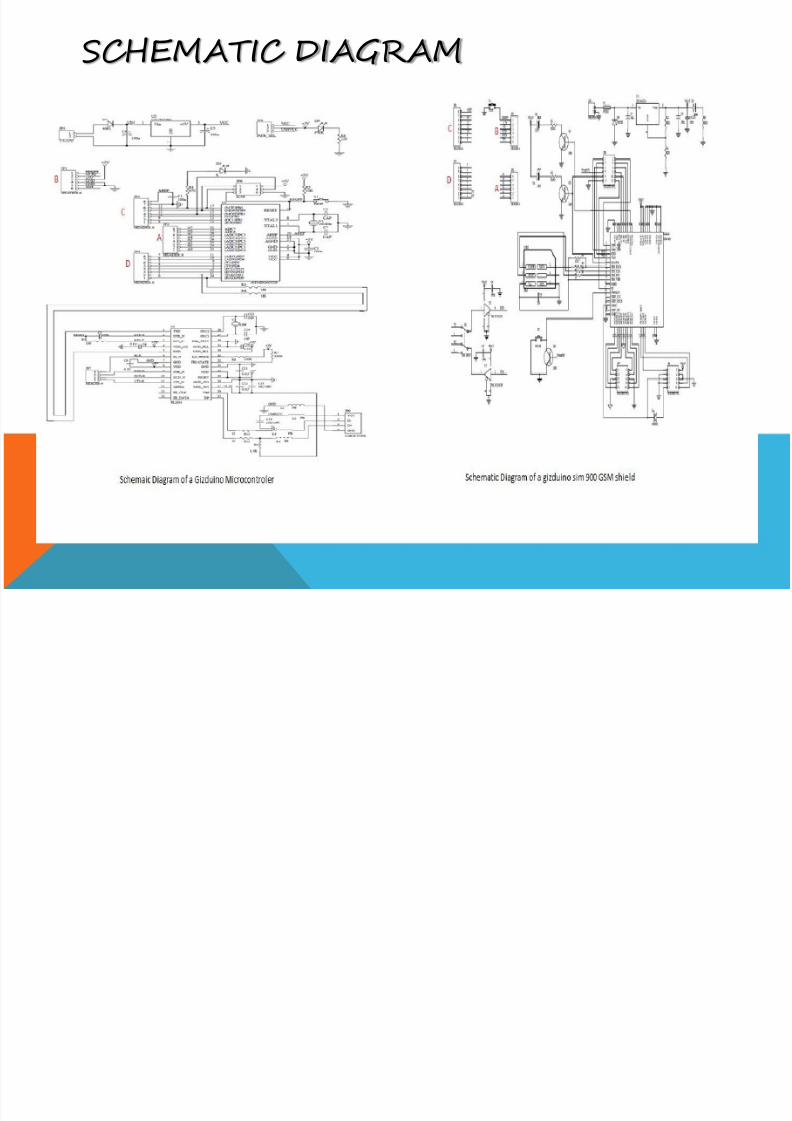
SCHEMATIC DIAGRAM
8/12/2019 Wednesday Report
http://slidepdf.com/reader/full/wednesday-report 15/23
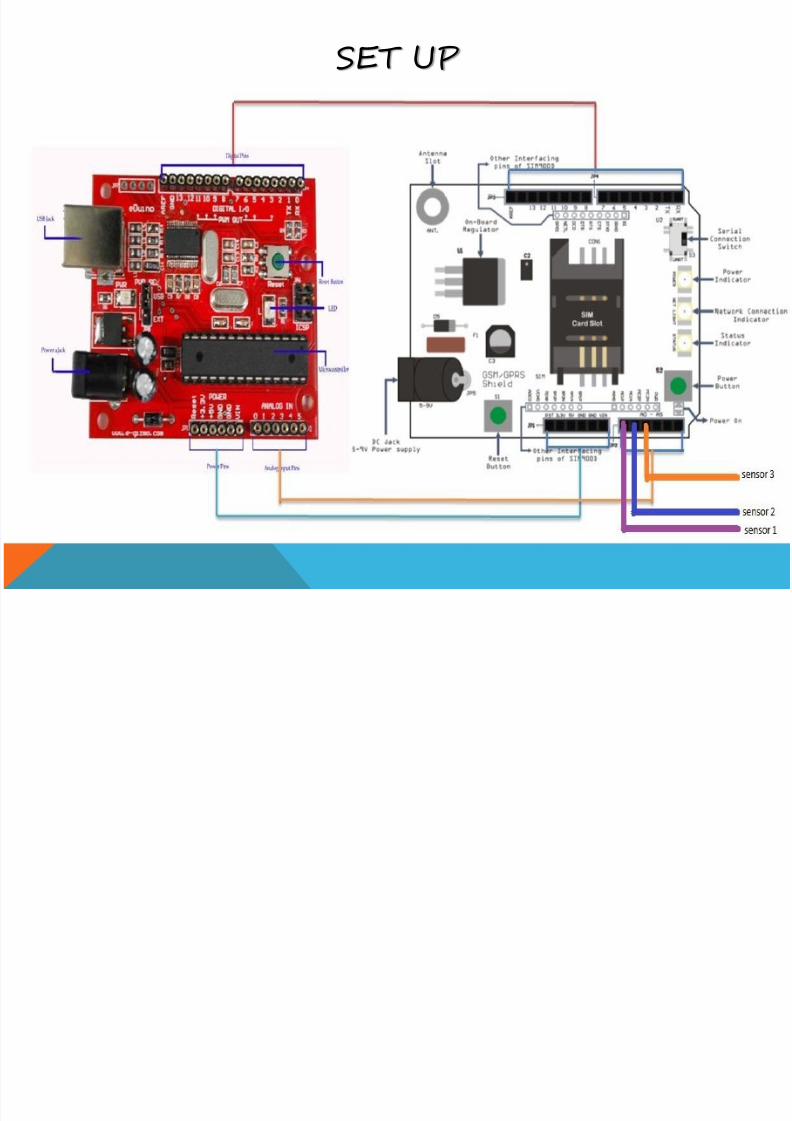
SET UP

8/12/2019 Wednesday Report
http://slidepdf.com/reader/full/wednesday-report 16/23
CONNECTING THE GIZDUINO MICROCONTROLLER TO
THE GIZDUINO GSM SHIELD SIM900D
8/12/2019 Wednesday Report
http://slidepdf.com/reader/full/wednesday-report 17/23
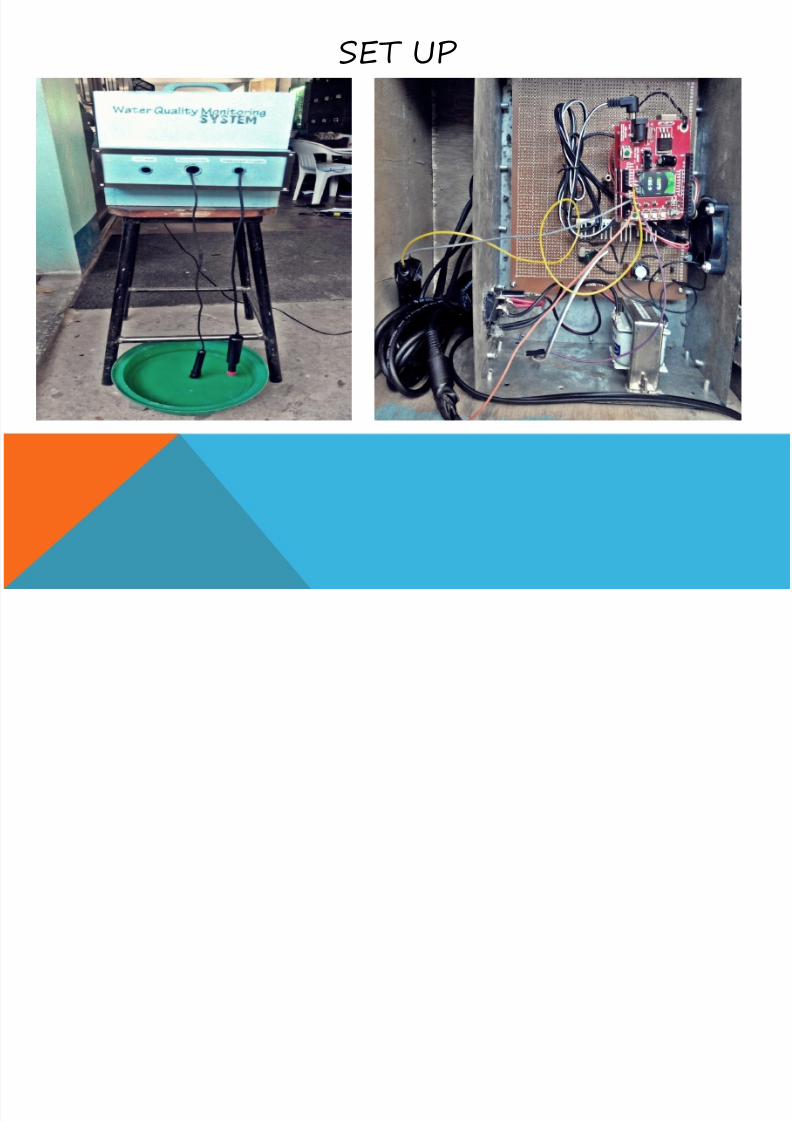
SET UP

8/12/2019 Wednesday Report
http://slidepdf.com/reader/full/wednesday-report 18/23
SAMPLE WEB PAGE:
8/12/2019 Wednesday Report
http://slidepdf.com/reader/full/wednesday-report 19/23
BLOCK DIAGRAM
8/12/2019 Wednesday Report
http://slidepdf.com/reader/full/wednesday-report 20/23
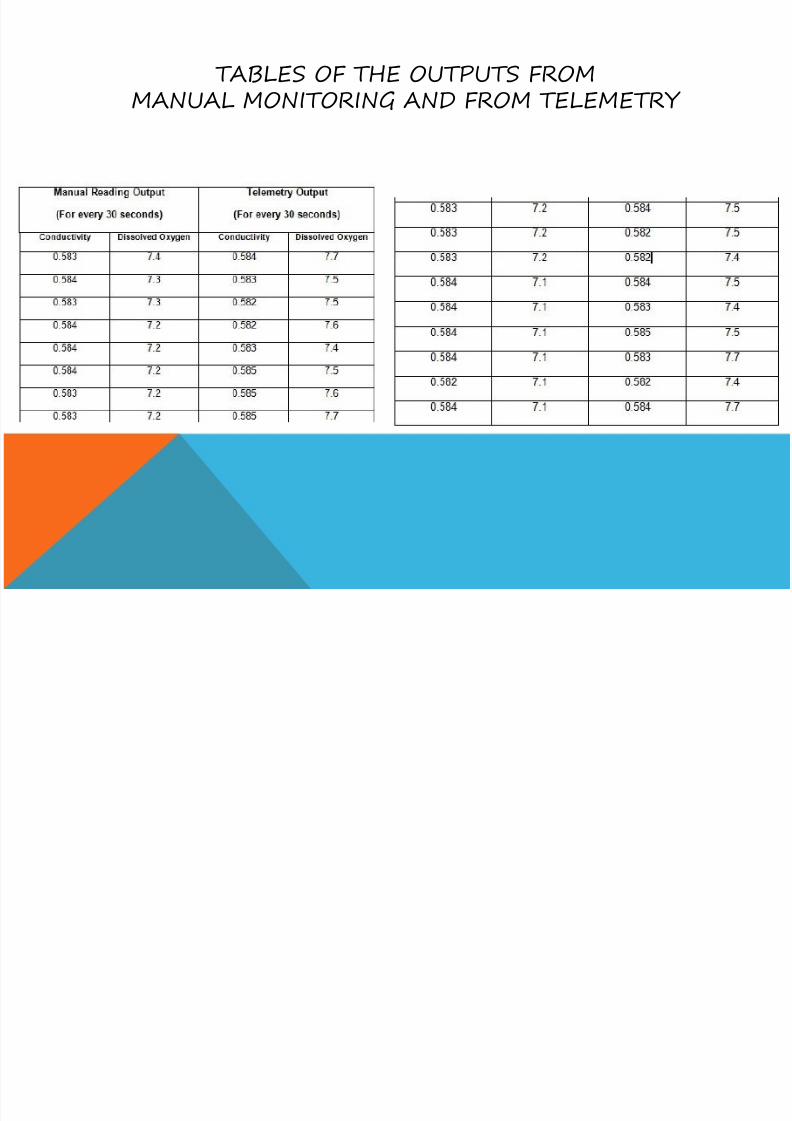
TABLES OF THE OUTPUTS FROMMANUAL MONITORING AND FROM TELEMETRY

8/12/2019 Wednesday Report
http://slidepdf.com/reader/full/wednesday-report 21/23
VIDEO 1: FOR THE MANUAL LOGGING
8/12/2019 Wednesday Report
http://slidepdf.com/reader/full/wednesday-report 22/23
VIDEO 2: FOR THE MONITORING VIA TELEMETRY

8/12/2019 Wednesday Report
http://slidepdf.com/reader/full/wednesday-report 23/23
Thanks for listening
God bless .


