D-ITET/IBT Week 1: EEG Signal Processing Basics Gabor Stefanics (TNU) 20.02.2015 D-ITET / IBT / TNU 1 EEG Signal Processing: Theory and practice (Computational Psychiatry Seminar: Spring 2015)
Transcript
D-ITET/IBT
Week 1: EEG Signal Processing Basics
Gabor Stefanics (TNU)
20.02.2015 D-ITET / IBT / TNU 1
EEG Signal Processing: Theory and practice (Computational Psychiatry Seminar: Spring 2015)
20.02.2015 2 D-ITET / IBT / TNU
Outline
-Physiological bases of EEG -Amplifier basics
-Usual EEG lab components -Basic acquisition, Electrode placement -How EEG Travels From the Brain to the Recording Device -Measurement Issues -Why is Electrode Gel Necessary? -Why is the Amplifier Necessary, and What Does it Do? -Why is the Amplifier Input Impedance Important?
-Signal processing basics
-What Is Cognitive Electrophysiology? -Why EEG? Why Not EEG? -Interpreting Voltage Values from the EEG Signal -Temporal and Spatial Resolution, Precision, and Accuracy of EEG -EEG Time-Frequency: The Basics -Preprocessing and Artifacts: Their Detection, Influence, and Removal -Overview of Time-Domain EEG Analyses -Practicalities of EEG Measurement and Experiment Design -Tips for Data Collection
1) When an Action Potential reaches the axon terminal the neuron releases a neurotransmitter.
4) EPSP and IPSP summate temporally and spatially.
5) If the postsynaptic neuron reaches a given depolarization threshold, an action potential is generated.
Post-synaptic potentials 1
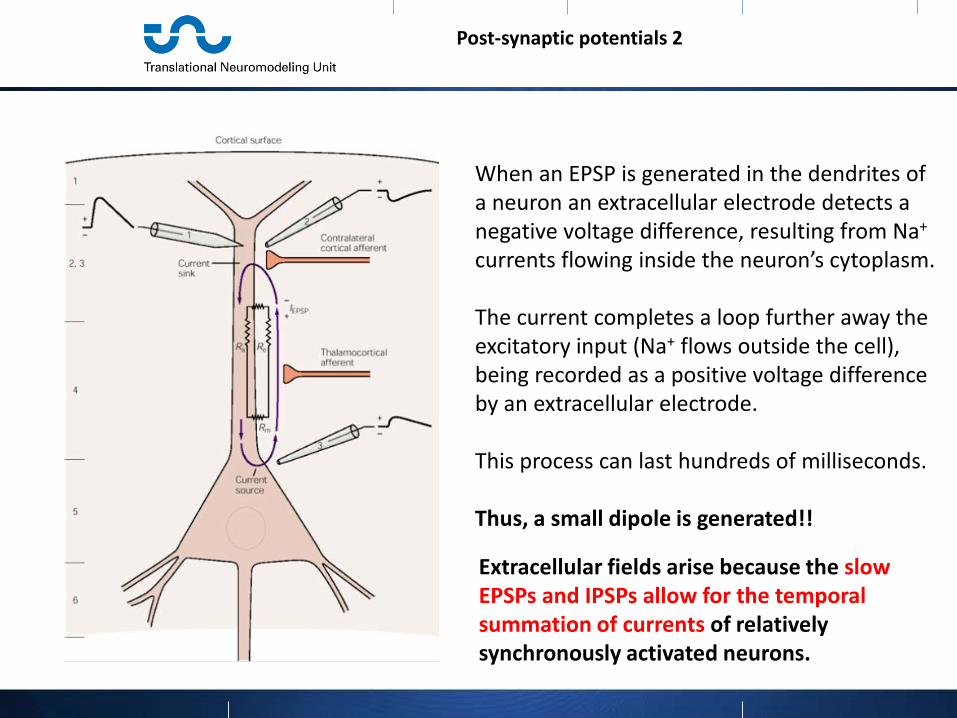
When an EPSP is generated in the dendrites of a neuron an extracellular electrode detects a negative voltage difference, resulting from Na+ currents flowing inside the neuron’s cytoplasm. The current completes a loop further away the excitatory input (Na+ flows outside the cell), being recorded as a positive voltage difference by an extracellular electrode. This process can last hundreds of milliseconds. Thus, a small dipole is generated!!
Post-synaptic potentials 2
Extracellular fields arise because the slow EPSPs and IPSPs allow for the temporal summation of currents of relatively synchronously activated neurons.
.
20.02.2015 5 D-ITET / IBT / TNU
Dipoles
Open and closed fields
Radial dipole Tangential dipole
Jackson and Bolger (2014) Psychophysiology
Cohen (2014) MIT Press
Closed field Open field
.
20.02.2015 6 D-ITET / IBT / TNU
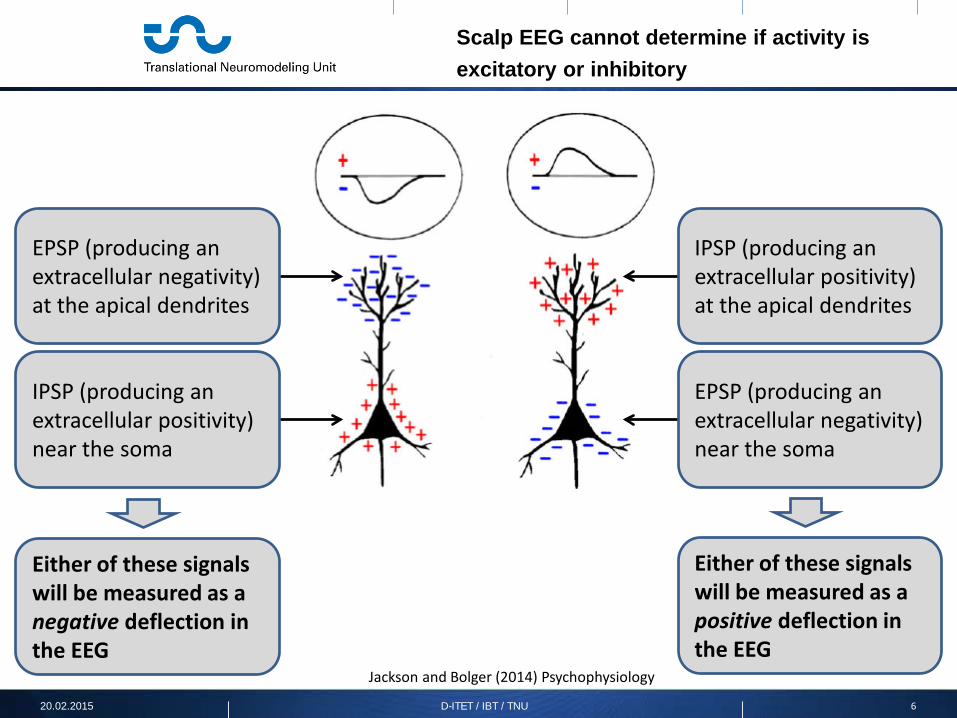
Scalp EEG cannot determine if activity is excitatory or inhibitory
IPSP (producing an extracellular positivity) near the soma
EPSP (producing an extracellular negativity) at the apical dendrites
EPSP (producing an extracellular negativity) near the soma
IPSP (producing an extracellular positivity) at the apical dendrites
Either of these signals will be measured as a negative deflection in the EEG
Either of these signals will be measured as a positive deflection in the EEG
Jackson and Bolger (2014) Psychophysiology
.
20.02.2015 7 D-ITET / IBT / TNU
-Amplifier basics -Usual EEG lab components -Basic acquisition, Electrode placement -How EEG Travels From the Brain to the Recording Device -Measurement Issues -Why is Electrode Gel Necessary? -Why is the Amplifier Necessary, and What Does it Do? -Why is the Amplifier Input Impedance Important?
.
20.02.2015 8 D-ITET / IBT / TNU
Usual EEG lab components
Stimulus PC
EEG recording
PC
Experiment event markers
EEG data
USB box
Subject stimulus screen and headphone
Stimulus
Behavioral responses
QuickAmp amplifier
.
20.02.2015 9 D-ITET / IBT / TNU
Basic acquisition
- Signals on the scalp are very small – microvolt range (1/1’000’000 volts). - Presents some challenges for acquisition - Acquisition involves -Amplification -Filtering -Digitizing -Storage - Results in one time series per channel (up to 128 at the TNU).
.
20.02.2015 10 D-ITET / IBT / TNU
Basic acquisition
- EEG signals are a measure of potential difference between two electrodes.
- Just like the voltage at a battery is the difference between positive and negative poles.
- Thus you always need at least 2 recording electrodes to get a signal.
- In practice we use many electrodes but each EEG signal is always the difference between the signal from 2 or more electrodes.
.
20.02.2015 11 D-ITET / IBT / TNU
Electrode placement
Traditional 10-20 or 10-10 layouts Equidistant layouts
.
20.02.2015 12 D-ITET / IBT / TNU
EEG time series
.
20.02.2015 13 D-ITET / IBT / TNU
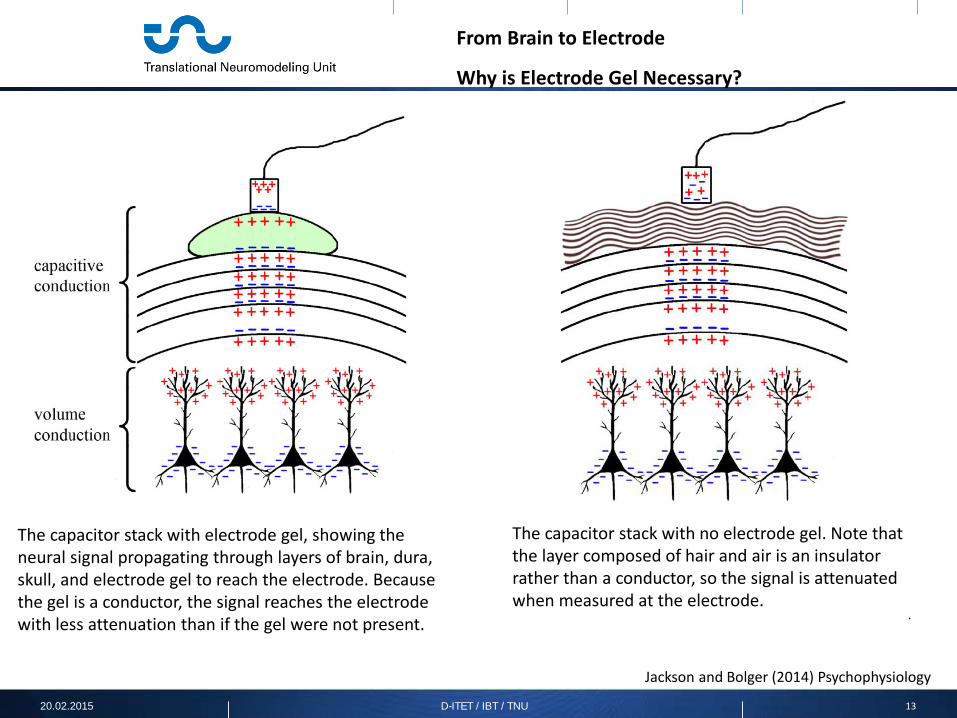
From Brain to Electrode
Why is Electrode Gel Necessary?
The capacitor stack with electrode gel, showing the neural signal propagating through layers of brain, dura, skull, and electrode gel to reach the electrode. Because the gel is a conductor, the signal reaches the electrode with less attenuation than if the gel were not present.
Jackson and Bolger (2014) Psychophysiology
The capacitor stack with no electrode gel. Note that the layer composed of hair and air is an insulator rather than a conductor, so the signal is attenuated when measured at the electrode.
.
20.02.2015 14 D-ITET / IBT / TNU
Why is the Amplifier Input Impedance Important?
Jackson and Bolger (2014) Psychophysiology
Each resistor in the circuit will produce a voltage drop proportional to the total resistance. Here, if both resistors are 100 ohms, then each resistor represents half of the total resistance, so each resistor would drop half of the voltage.
Voltage drop across resistance
If one of the resistors here has a resistance of 100 ohms and the other has a resistance of 1,000 ohms, then the former is 100/1,100 of the total resistance, and so drops 100/1,100 of the total voltage.
Calculating voltage drops across resistance.
.
20.02.2015 15 D-ITET / IBT / TNU
Electrical noise and the importance of high input impedance
Jackson and Bolger (2014) Psychophysiology
Noise entering the EEG measurement system Say the input impedance is 100 ohms: Signal: 100 ohms of resistance from the wire, 100 ohms from the amplifier. The ratio of amplifier resistance to total resistance is 100/(100 + 100) = .5. This results in a voltage drop across the input impedance of the amplifier that is 50% of the signal’s voltage. Noise: 5 ohms of resistance from the wire, 100 ohms from the amplifier. Ratio of amplifier resistance to total resistance is 100/ (100 + 5) = .9524. This results in a voltage drop across the input impedance of the amplifier that is 95.24% of the noise’s voltage. Say the input impedance is 1 million ohms: Signal: 100 ohms of resistance from the wire, 1,000,000 ohms of resistance from the amplifier. Ratio of amplifier resistance to total resistance is 1,000,000/1,000,100. This results in a voltage drop across the input impedance of the amplifier that is 99.990% of the signal’s voltage. Noise: 50 ohms of resistance from the wire, 1,000,000 ohms of resistance from the amp. Ratio of amplifier resistance to total resistance is 1,000,000/1,000,050. This results in a voltage drop across the input impedance of the amplifier that is 99.995% of the noise’s voltage.
Why is it important to minimize resistance between electrode and scalp?
Jackson and Bolger (2014) Psychophysiology
Of all the connections in an EEG system, the connection between electrode and scalp is the most relevant for day-to-day usage. The signal is passed along at the scalp, but measured at the amplifier. A smaller resistance allows more signal to pass through, because it drops less voltage, leaving more voltage to continue through the circuit. A very large resistance is what allows the voltage to be measured, because it drops as much voltage as possible, and that voltage drop is what is measured. An EEG system should minimize the resistance across the scalp-electrode interface in order to minimize the voltage drop at that interface, so as much voltage as possible remains to be measured at the amplifier. If the amplifier’s input impedance is much larger than the scalp-electrode resistance, then even a fairly high scalp-electrode resistance will still represent a very small portion of the total resistance. Thus, the higher the input impedance, the larger the electrode impedance that can be tolerated without losing signal quality.
The capacitor stack with no electrode gel. The layer composed of hair and air is an insulator rather than a conductor, so the signal is attenuated when measured at the electrode.
.
20.02.2015 18 D-ITET / IBT / TNU
Signal processing basics
-Signal processing basics -What Is Cognitive Electrophysiology? -Why EEG? Why Not EEG? -Interpreting Voltage Values from the EEG Signal -Temporal and Spatial Resolution, Precision, and Accuracy of EEG -EEG Time-Frequency: The Basics -Preprocessing and Artifacts: Their Detection, Influence, and Removal -Overview of Time-Domain EEG Analyses -Practicalities of EEG Measurement and Experiment Design -Tips for Data Collection
20.02.2015 19 D-ITET / IBT / TNU
What Is Cognitive Electrophysiology?
How cognitive functions are supported or implemented by the electrical activity produced by populations of neurons.
-Where on this spectrum you consider yourself? -The answer will help guide your experiments, hypotheses, data analyses, target journals and conferences, and career choices. Cognitive Electrophysiology: The Art of Finding Anthills on Mountains EEG signals are noisy, findings are sometimes hidden in dimensions that are difficult to visualize without filters or other data transformations, results can be infected with artifacts or may be statistical false alarms, and interpretations are usually based on probabilities, inferences, and speculations. Good science — in addition to being based on theory, previous research, careful experiment design, and appropriate data analyses and statistics — is also about discovering and appreciating subtlety. And the appreciation of subtlety becomes more important with time as basic findings become established fact. This is good; it reflects progress. Discovering subtleties involves considering theories, previous research, and openness to letting the data “speak for themselves.” Cohen (2014) MIT Press
.
20.02.2015 20 D-ITET / IBT / TNU
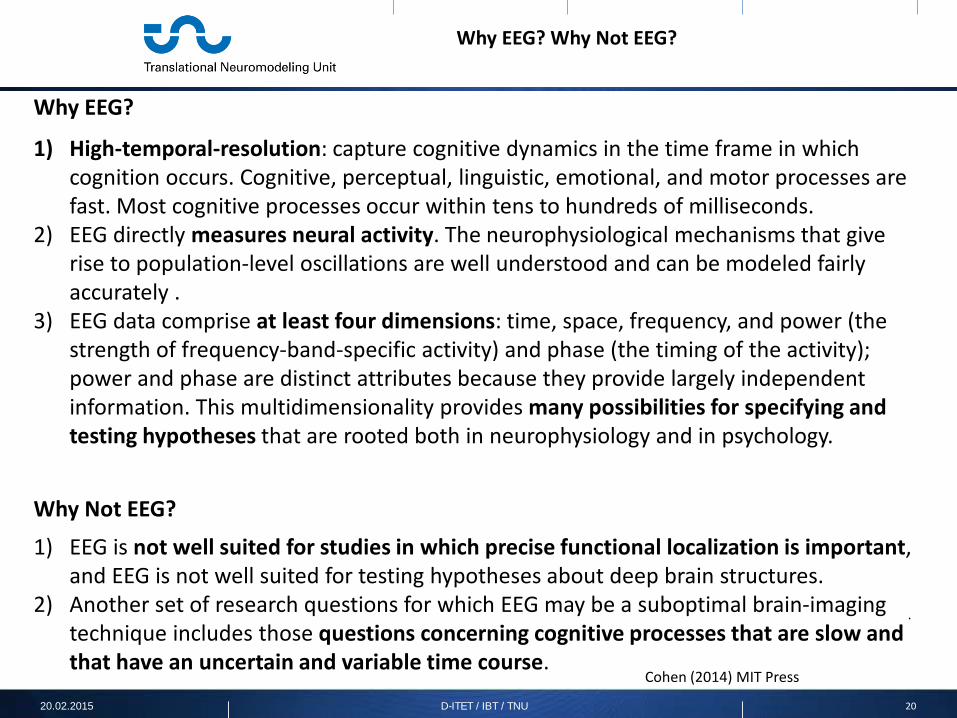
Why EEG? Why Not EEG?
1) High-temporal-resolution: capture cognitive dynamics in the time frame in which cognition occurs. Cognitive, perceptual, linguistic, emotional, and motor processes are fast. Most cognitive processes occur within tens to hundreds of milliseconds.
2) EEG directly measures neural activity. The neurophysiological mechanisms that give rise to population-level oscillations are well understood and can be modeled fairly accurately .
3) EEG data comprise at least four dimensions: time, space, frequency, and power (the strength of frequency-band-specific activity) and phase (the timing of the activity); power and phase are distinct attributes because they provide largely independent information. This multidimensionality provides many possibilities for specifying and testing hypotheses that are rooted both in neurophysiology and in psychology.
1) EEG is not well suited for studies in which precise functional localization is important, and EEG is not well suited for testing hypotheses about deep brain structures.
2) Another set of research questions for which EEG may be a suboptimal brain-imaging technique includes those questions concerning cognitive processes that are slow and that have an uncertain and variable time course.
Why EEG?
Why Not EEG?
Cohen (2014) MIT Press
.
20.02.2015 21 D-ITET / IBT / TNU
Interpreting Voltage Values from the EEG Signal
Microvolt values can be difficult to interpret in an absolute sense, because 1) microvolt values will change depending on data processing and analysis decisions,
including the choice of reference and the time period used for baseline subtraction;
2) raw voltage values can be difficult to interpret as microvolt values differ across subjects according to irrelevant factors such as skull shape and thickness, scalp preparation during the recording, the orientation of the dipole in the brain that generated the scalp-measured activity, cortical folding, whether the subject washed his or her head that morning, and other factors. These are not global factors, meaning that there can be local differences in voltage values across the head. The voltage value might also be influenced by the quality of the EEG electrodes and amplifier as well as by built-in hardware filters.
Cohen (2014) MIT Press
.
20.02.2015 22 D-ITET / IBT / TNU
Temporal Resolution, Precision, and Accuracy of EEG
Cohen (2014) MIT Press
1) Resolution refers to the number of data samples per unit time (the number of dots),
2) precision refers to the certainty of the measurement at each time point (depends on the analysis, e.g. convolution),
3) and accuracy refers to the relationship between the timing of the EEG signal and the timing of the biophysical events that lead to the EEG signal.
.
20.02.2015 23 D-ITET / IBT / TNU
Spatial Resolution, Precision, and Accuracy of EEG
Cohen (2014) MIT Press
1) Spatial resolution: determined by the number of electrodes. The spatial resolution that you need depends on the kinds of analyses you will perform.
2) The spatial precision of EEG is fairly low but can be improved by spatial filters such as the surface Laplacian or adaptive source-space-imaging techniques. Simulation studies show that with many electrodes ( > 200) and anatomically precise forward models of subject-specific brain and skull anatomy, the spatial precision of source reconstruction can be fairly high.
3) The spatial accuracy of EEG is low. Activity recorded from one electrode does not reflect only activity from neurons directly below that electrode, but rather, from a complex mixture of activities from many brain regions close to and distant from that electrode.
Scalp electroencephalographic (EEG) electrodes record sums of activity from cortical sources and non-brain processes, making direct interpretation of scalp channel waveforms problematic. As an example, this silent 1/5th-speed simulation by Zeynep Akalin Acar and Scott Makeig shows (on the left) two cm-sized, parietal EEG sources expressing simulated alpha band activities (at 9 Hz and 10 Hz respectively), and (on the right) their summed scalp projection. Note the strong difference between the cortical source dynamics (left) and scalp EEG dynamics (right), and the difficulty of determining the nature and locations of the source activities directly from the scalp pattern. http://sccn.ucsd.edu/eeglab/
2) Event Markers: are critical because they are used to time-lock the EEG data offline. They are also used to reconstruct different conditions and responses. Therefore, it is better to have markers encode too much rather than too little information.
3) Intra- and Inter-trial Timing: allow the brain response to one event to subside before the response to the next event begins. Consider carefully what period of time you will use for baseline normalization of task-related data and what frequencies you want to analyze.
4) How Many Trials You Will Need: depends on the signal-to-noise characteristics of the data (that is, how clean vs. how noisy the data are), how big the effect is, and the type of analysis you will perform. There is no magic number of trials that will guarantee good results.
Cohen (2014) MIT Press
.
20.02.2015 25 D-ITET / IBT / TNU
Practicalities of EEG Measurement and Experiment Design (Sampling theory) 1
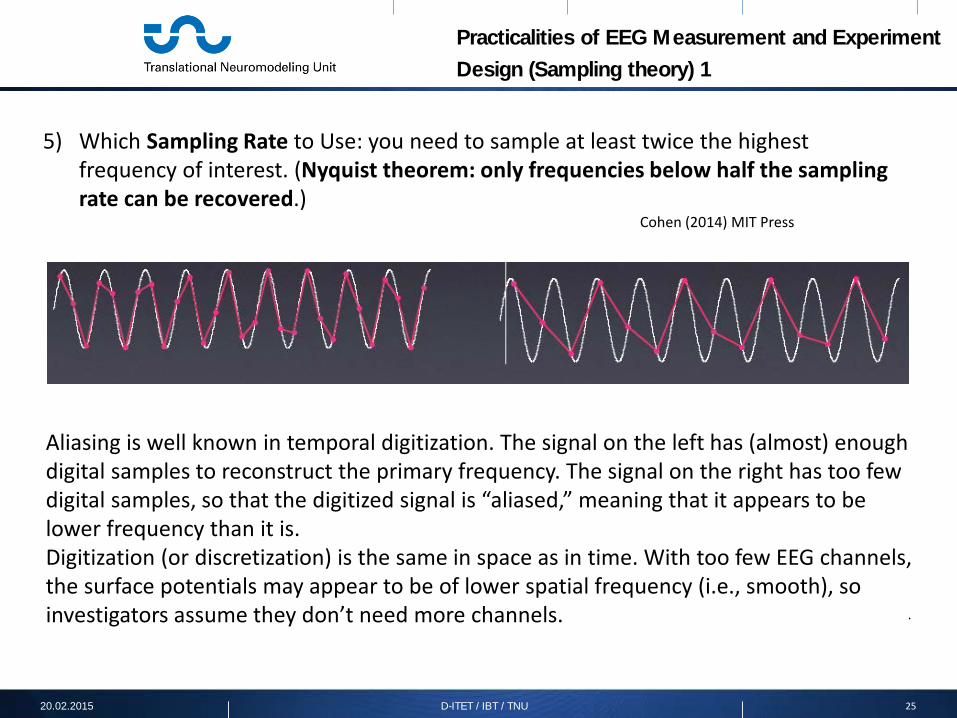
5) Which Sampling Rate to Use: you need to sample at least twice the highest frequency of interest. (Nyquist theorem: only frequencies below half the sampling rate can be recovered.)
Cohen (2014) MIT Press
Aliasing is well known in temporal digitization. The signal on the left has (almost) enough digital samples to reconstruct the primary frequency. The signal on the right has too few digital samples, so that the digitized signal is “aliased,” meaning that it appears to be lower frequency than it is. Digitization (or discretization) is the same in space as in time. With too few EEG channels, the surface potentials may appear to be of lower spatial frequency (i.e., smooth), so investigators assume they don’t need more channels.
20.02.2015 26 D-ITET / IBT / TNU
Practicalities of EEG Measurement and Experiment Design (Sampling theory) 2
-If the brain’s potentials produce very large dipolar fields (as large as one quadrant of the brain), then 64 channels is adequate, and 32 is probably close enough. -If the fields are smaller, e.g., the size of half of a lobe synchronously active, then even 64 channel sampling is inadequate, and aliasing occurs.
Srinivasan, R., et al. (1998) Behavioral Research Methods, Instruments, & Computers, 30, 8-19.
Sampling of two examples of spatial frequency with 129-,64-,32-, and 19-channel sensor arrays. The top row shows four cycles of azimuth and four cycles of elevation. Acceptable accuracy is shown for the 32-channel array, but not for the 19-channel array. The bottom row shows four cycles of azimuth and seven of elevation. Only the 129-channel array provides accurate sampling.
6) How Many Electrodes You Will Need: depends on what analyses you plan on performing and what inferences you plan on drawing.
.
20.02.2015 27 D-ITET / IBT / TNU
Advantages of Event-Related Potentials
1) ERPs are simple and fast to compute and require few analysis assumptions or parameters. If the point of your experiment is to test whether brain processing is different between two conditions, and you have no preconceptions about what kinds of electrophysiological dynamics those differences might reflect, comparing ERPs across the two conditions is the fastest and easiest approach to address this question.
2) High temporal precision and accuracy. Because ERPs generally involve very little data processing and gentle or no temporal filters, the estimate of electrical activity at each millisecond is very precise.
3) There is an extensive and decades-long literature of ERP findings in which to contextualize and interpret your results. Furthermore, this literature and the theories that have been developed around ERP findings provide ample opportunities to generate new and testable hypotheses.
4) Because ERPs are fast to compute and easy to look at, they provide a quick and useful data quality check of single-subject data.
Cohen (2014) MIT Press
.
20.02.2015 28 D-ITET / IBT / TNU
Limitations of ERPs
1) ERPs reveal relatively little of the information present in EEG data. In other words there are many kinds of dynamics in EEG data that do not have a representation in the ERP.
2) ERPs provide limited opportunities for linking results to physiological mechanisms. This is because the neurophysiological mechanisms that produce ERPs are less well understood compared to the neurophysiological mechanisms that produce oscillations.
Cohen (2014) MIT Press
.
20.02.2015 29 D-ITET / IBT / TNU
Advantages of Time-Frequency-Based Approaches
1) Many results from time-frequency-based analyses can be interpreted in terms of neurophysiological mechanisms of neural oscillations. Oscillations are ubiquitous and fundamental neural mechanism that supports myriad aspects of synaptic, cellular, and systems-level brain function across multiple spatial and temporal scales.
2) Oscillations are arguably the most promising bridge that links findings from multiple disciplines within neuroscience and across multiple species.
3) If you accept that EEG data capture a dynamic and multidimensional space of brain processing, then ERPs reveal a fraction of that space, and time-frequency-based analyses reveal more (although not all) of that space. Thus, there may be many task-relevant dynamics in EEG data that are retrievable using only time-frequency-based approaches.
Cohen (2014) MIT Press
Limitations of Time-Frequency-Based Approaches
1) Decrease of temporal precision. 2) The large number of analyses that can be applied to
EEG data, and the seeming complexity of those analyses, can be intimidating. New-comers to the field may feel overwhelmed.
3) Relatively small literature on linking time-frequency dynamics to cognitive processes compared to the literature linking ERPs to cognitive processes.
.
20.02.2015 30 D-ITET / IBT / TNU
EEG data contain rhythmic activity
Cohen (2014) MIT Press
-Even in raw, unfiltered, unprocessed data you can see rhythmic activity. This rhythmic activity reflects neural oscillations, which are fluctuations in the excitability of populations of neurons. Some oscillations are fast, some are slower, and some are very slow. -Oscillations are described by three pieces of information: frequency, power, and phase
Ulhaas and Singer (2010)
.
20.02.2015 31 D-ITET / IBT / TNU
Oscillatory Patterns of Sleep
The brain is busy at night
Mixed, Alpha, theta
Mixed, delta, theta
.
20.02.2015 32 D-ITET / IBT / TNU
Ways to View Time-Frequency Results
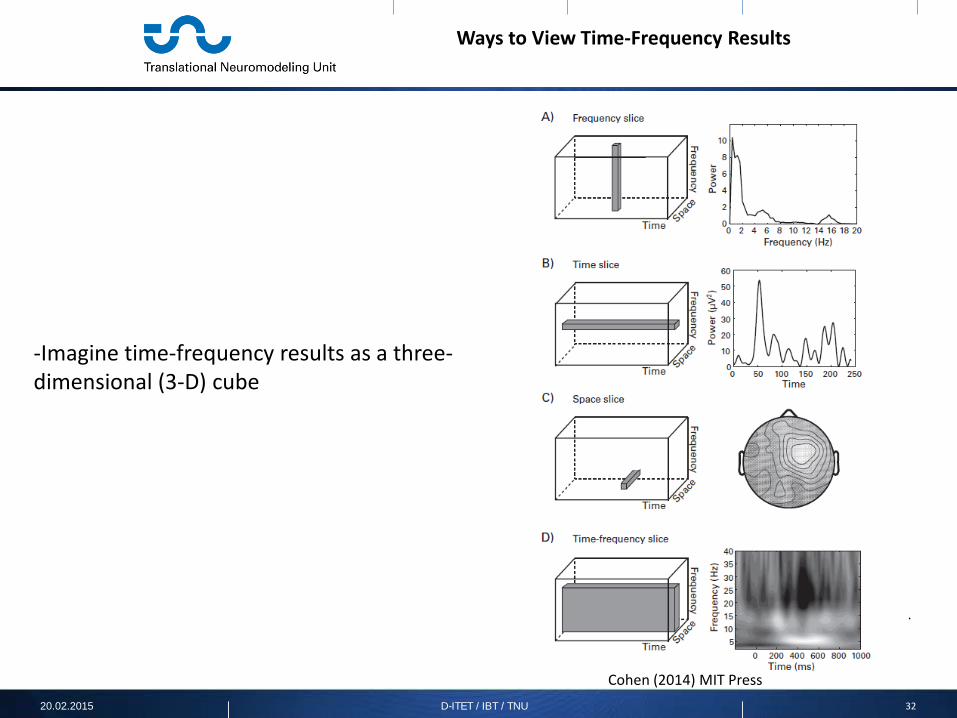
-Imagine time-frequency results as a three-dimensional (3-D) cube
Cohen (2014) MIT Press
.
20.02.2015 33 D-ITET / IBT / TNU
Things to Be Suspicious of When Viewing Time-Frequency Results
Cohen (2014) MIT Press
Do Results in Time-Frequency Plots Mean That There Were Neural Oscillations? The real answer is “ It is difficult to know for sure.” On the one hand, EEG measures summed field potentials of populations of neurons, which are strongly oscillatory. Thus, meso- and macroscopic neural processes that generate oscillations will dominate EEG measurements. On the other hand, Fourier ’ s theorem specifies that any signal can be represented using sine waves, and thus, even non-oscillatory signals have a representation in a time-frequency plot.
.
20.02.2015 34 D-ITET / IBT / TNU
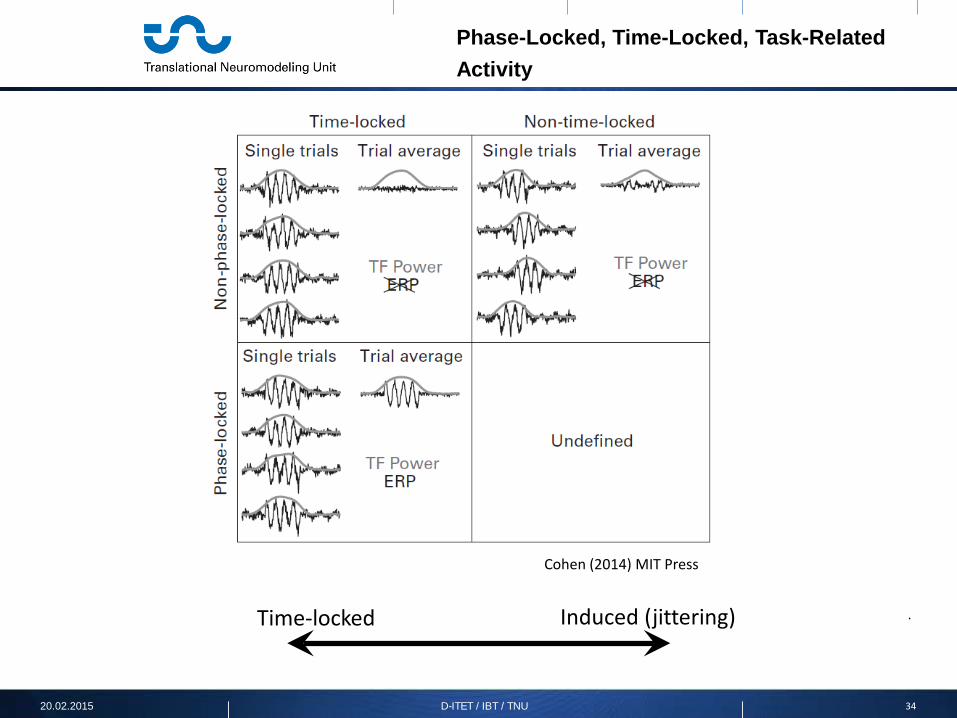
Phase-Locked, Time-Locked, Task-Related Activity
Cohen (2014) MIT Press
Time-locked Induced (jittering)
.
20.02.2015 35 D-ITET / IBT / TNU
Neurophysiological Mechanisms of ERPs
Jensen et al. (2010) Clinical Neurophysiology 121, 1148–1150
There is less empirical and theoretical work on the neurophysiological mechanisms that produce ERPs — that is, why there are positive and negative polarity peaks after experiment events.
Additive model Phase-reset model
Amplitude asymmetry or baseline shift Complex additive and nonlinear effects
David et al. (2006) Neuroimage
Sauseng et al. (2007) Neuroscience 146, 1435–1444
.
20.02.2015 36 D-ITET / IBT / TNU
Preprocessing Steps Necessary and Useful for (Advanced) Data Analysis
Cohen (2014) MIT Press
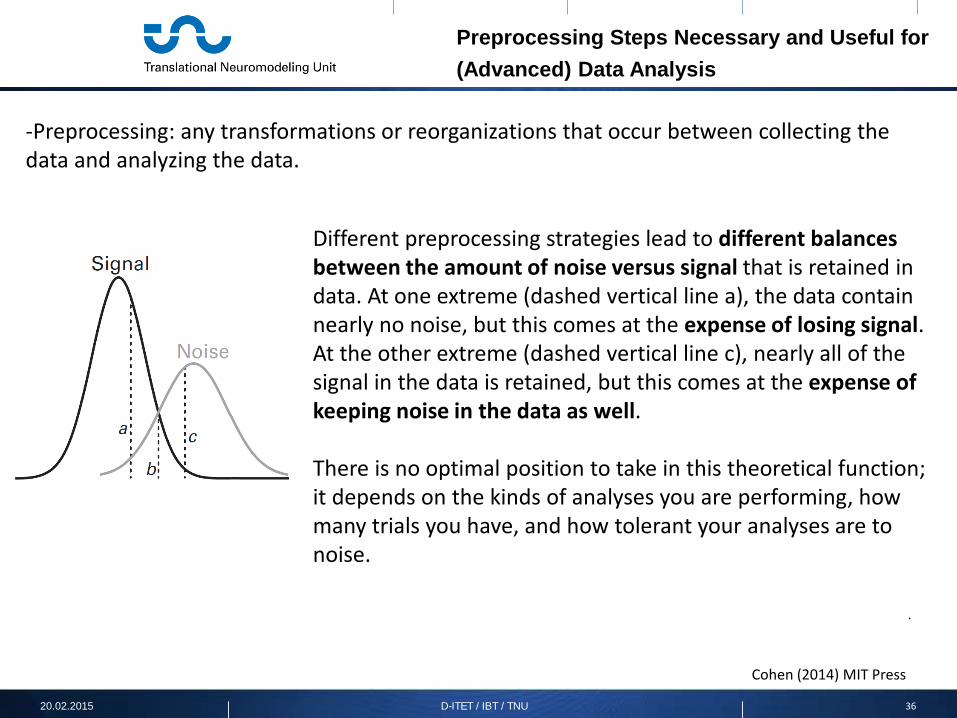
-Preprocessing: any transformations or reorganizations that occur between collecting the data and analyzing the data.
Different preprocessing strategies lead to different balances between the amount of noise versus signal that is retained in data. At one extreme (dashed vertical line a), the data contain nearly no noise, but this comes at the expense of losing signal. At the other extreme (dashed vertical line c), nearly all of the signal in the data is retained, but this comes at the expense of keeping noise in the data as well. There is no optimal position to take in this theoretical function; it depends on the kinds of analyses you are performing, how many trials you have, and how tolerant your analyses are to noise.
.
20.02.2015 37 D-ITET / IBT / TNU
Start with Clean Data
There is no data analysis substitute for clean data. The fanciest and most sophisticated data analyses will give you bad results if you start with bad data. On the other hand, if you have very clean and high – signal-to-noise data, even modest analyses can provide compelling and insightful results.
Cohen (2014) MIT Press
.
20.02.2015 38 D-ITET / IBT / TNU
Preprocessing Steps
Creating Epochs: continuous data are cut into segments surrounding particular experiment events.
Cohen (2014) MIT Press
Edge artifacts result from applying temporal filters to sharp edges such as a step function, and produce a high-amplitude broadband power artifact that can last hundreds of milliseconds. These artifacts will always be present when there are non-continuous breaks, which happens at the first and last points of the EEG epochs
If you are re-analyzing a dataset that has already been epoched and cannot be re-epoched from the continuous data, and if you are concerned that the epochs are too short and the time-frequency results might be contaminated by edge artifacts, you can use a “reflection” approach,
.
20.02.2015 39 D-ITET / IBT / TNU
Preprocessing Steps
Cohen (2014) MIT Press
1) Matching Trial Count across Conditions: it is ideal for all conditions to have the same number of trials. Low trial count decreases signal-to-noise ratio and therefore makes the ERP more sensitive to outliers or nonrepresentative data.
2) Filtering: can help remove high-frequency artifacts and low-frequency drifts, and notch filters at 50 Hz or 60 Hz help attenuate electrical line noise.
3) Trial Rejection: removing trials that contain artifacts prior to analyses is important. Spatial Filtering: to help localize a result.
4) Referencing: Any activity present in the reference electrode will be reflected as activity in all other electrodes. Thus, choose your reference electrode(s) carefully and make sure the reference electrodes are properly placed and have a good, clean signal during subject preparation. Noise in the reference electrodes will turn into noise in the scalp electrodes.
(Re-)referencing
.
20.02.2015 40 D-ITET / IBT / TNU
EEG Artifacts: Their Detection, Influence, and Removal
Cohen (2014) MIT Press
Most common artifacts: blinks, muscle movements, brief amplifier saturations, and line noise. Removing Data Based on Independent Components Analysis (topography, time course, power spectrum)
.
20.02.2015 41 D-ITET / IBT / TNU
EEG Artifacts: Their Detection, Influence, and Removal
Cohen (2014) MIT Press
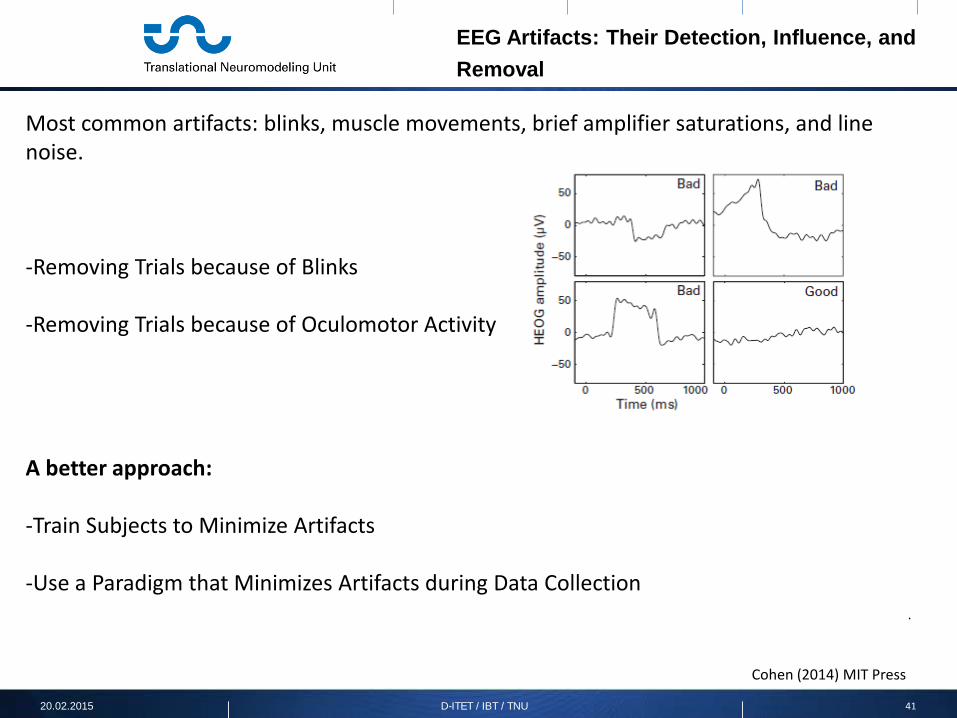
Most common artifacts: blinks, muscle movements, brief amplifier saturations, and line noise. -Removing Trials because of Blinks -Removing Trials because of Oculomotor Activity A better approach: -Train Subjects to Minimize Artifacts -Use a Paradigm that Minimizes Artifacts during Data Collection
20.02.2015 42 D-ITET / IBT / TNU
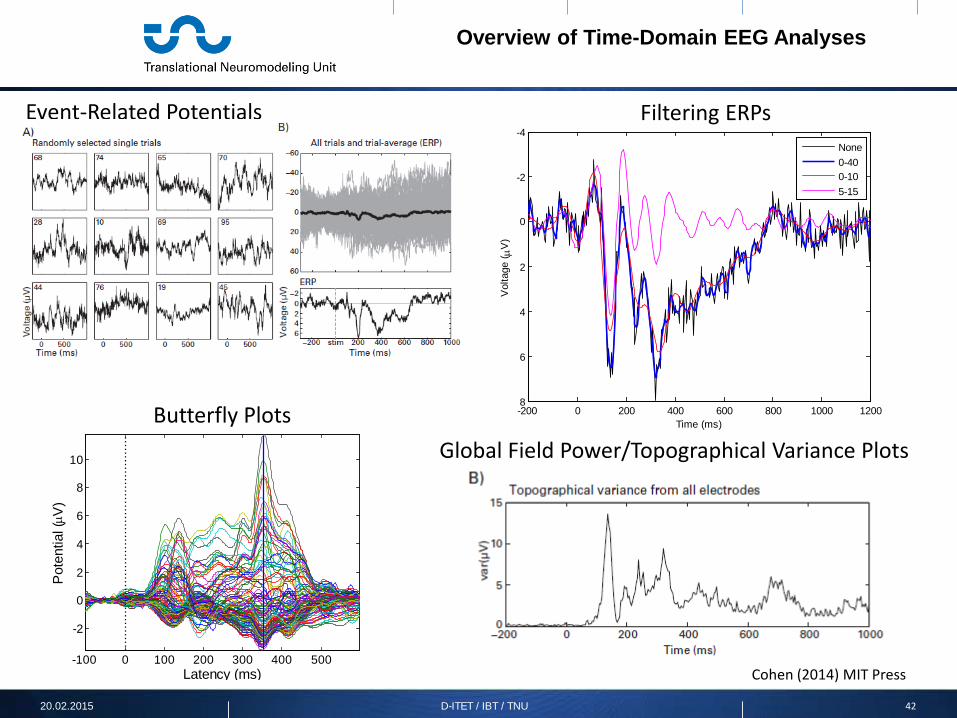
Overview of Time-Domain EEG Analyses
Cohen (2014) MIT Press
Event-Related Potentials
-100 0 100 200 300 400 500
-2
0
2
4
6
8
10
Latency (ms)
Pot
entia
l (µ V
)
Butterfly Plots Global Field Power/Topographical Variance Plots
-200 0 200 400 600 800 1000 1200
-4
-2
0
2
4
6
8
Time (ms)
Vol
tage
( µV
)
ERP from electrode p7
None0-400-105-15
Filtering ERPs
.
20.02.2015 43 D-ITET / IBT / TNU
Topographical Maps
Cohen (2014) MIT Press
Excellent and nearly ubiquitously used method for showing the spatial distribution of EEG results.
Plotting topographical maps over time facilitates rapid data quality inspection.
Interpolated maps are easier to interpret.
.
20.02.2015 44 D-ITET / IBT / TNU
Microstates (Swiss made)
C.M. Michel et al. / Clinical Neurophysiology 115 (2004) 2195–2222
(A) Potential map series from an ERP in response to a reversing checkerboard and shown at 4 ms intervals.
(B) Result of the spatial cluster analysis applied to the map series shown in A. A cross-validation procedure identified six maps as optimally explaining the whole data set. (C) Plot of the Global Dissimilarity (GD) for the ERP shown in A, which is a general measure of topographic similarity between two maps, here between maps of successive time points. High values indicate time points where the topography changes drastically. Colored areas under this curve denote the periods over which the above defined cluster maps best explained the data. Note that each of these maps is present for a certain time period (a functional microstate).
“In EEG as well as ERP map series, for brief, subsecond time periods, map landscapes typically remain quasi-stable, then change very quickly into different landscapes ” (Lehmann 1971).
20.02.2015 45 D-ITET / IBT / TNU
ERP Images
An ERP image is a 2-D representation of the EEG data from a single electrode. Rather than all trials averaged together to form an ERP, the single-trial EEG traces are stacked vertically and then color coded to show changes in amplitude as changes in color.
Stefanics et al. (2010) J.Neurosci.
.
20.02.2015 46 D-ITET / IBT / TNU
Tips for Data Collection
Luck (2014) MIT Press
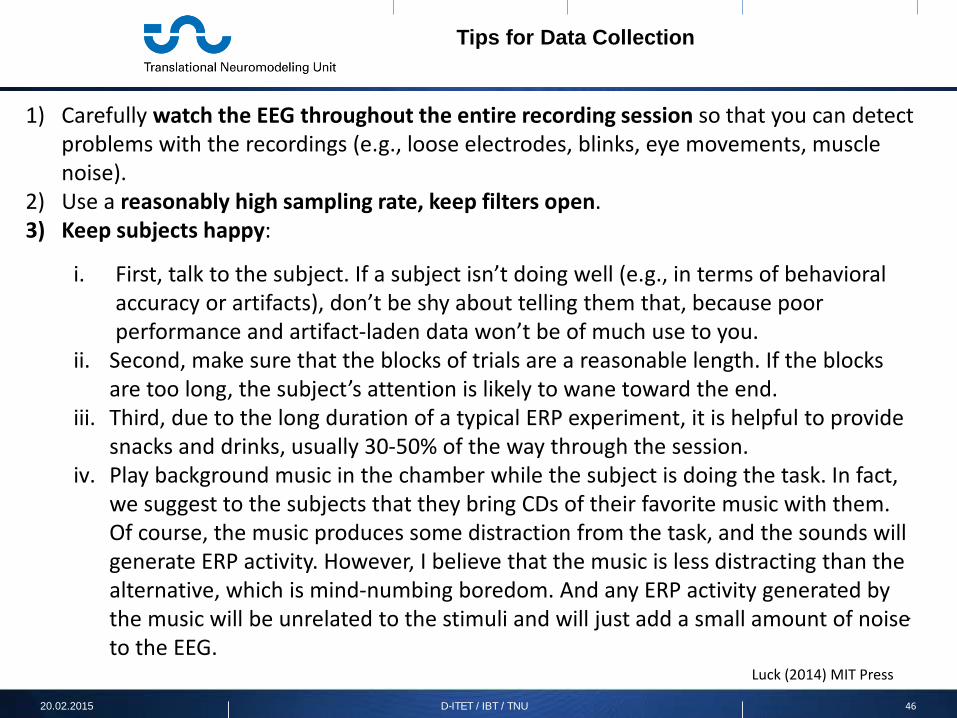
1) Carefully watch the EEG throughout the entire recording session so that you can detect problems with the recordings (e.g., loose electrodes, blinks, eye movements, muscle noise).
2) Use a reasonably high sampling rate, keep filters open. 3) Keep subjects happy:
i. First, talk to the subject. If a subject isn’t doing well (e.g., in terms of behavioral accuracy or artifacts), don’t be shy about telling them that, because poor performance and artifact-laden data won’t be of much use to you.
ii. Second, make sure that the blocks of trials are a reasonable length. If the blocks are too long, the subject’s attention is likely to wane toward the end.
iii. Third, due to the long duration of a typical ERP experiment, it is helpful to provide snacks and drinks, usually 30-50% of the way through the session.
iv. Play background music in the chamber while the subject is doing the task. In fact, we suggest to the subjects that they bring CDs of their favorite music with them. Of course, the music produces some distraction from the task, and the sounds will generate ERP activity. However, I believe that the music is less distracting than the alternative, which is mind-numbing boredom. And any ERP activity generated by the music will be unrelated to the stimuli and will just add a small amount of noise to the EEG.
20.02.2015 47 D-ITET / IBT / TNU
Thank you!
.
20.02.2015 48 D-ITET / IBT / TNU
Reading List
• [1] Chapters 1-9 from Mike X Cohen (2014) Analyzing neural time series data: Theory and
practice. MIT Press • [2] Chapter 16 from Steven J. Luck (2014) An Introduction to the Event-Related Potential
Technique. MIT Press • [3] Jackson AF, Bolger DJ. (2014) The neurophysiological bases of EEG and EEG measurement: a
review for the rest of us. Psychophysiology 51, 1061-1071.


![NSF Project EEG CIRCUIT DESIGN. Micro-Power EEG Acquisition SoC[10] Electrode circuit EEG sensing Interference.](https://static.documents.pub/doc/80x56/56649cfb5503460f949ccecd/nsf-project-eeg-circuit-design-micro-power-eeg-acquisition-soc10-electrode.jpg)


