Introduction Moments Skewness Kurtosis Coskewness and Cokurtosis Best Linear Unbiased Estimator Takeaways Week 1 Quantitative Analysis of Financial Markets Basic Statistics B Christopher Ting Christopher Ting http://www.mysmu.edu/faculty/christophert/ k: [email protected]T: 6828 0364 : LKCSB 5036 October 14, 2017 Christopher Ting QF 603 October 14, 2017 1/23
Transcript
Introduction Moments Skewness Kurtosis Coskewness and Cokurtosis Best Linear Unbiased Estimator Takeaways
Introduction Moments Skewness Kurtosis Coskewness and Cokurtosis Best Linear Unbiased Estimator Takeaways
Table of Contents
1 Introduction
2 Moments
3 Skewness
4 Kurtosis
5 Coskewness and Cokurtosis
6 Best Linear Unbiased Estimator
7 Takeaways
Christopher Ting QF 603 October 14, 2017 2/23
Introduction Moments Skewness Kurtosis Coskewness and Cokurtosis Best Linear Unbiased Estimator Takeaways
Introduction
' Covariance is between two random variables for second-ordermoments.
' What about higher-order moments?
' The third and fourth standardized cross central moments arereferred to as coskewness and cokurtosis, respectively.
' Higher-order cross moments can be very important in riskmanagement.
Christopher Ting QF 603 October 14, 2017 3/23
Introduction Moments Skewness Kurtosis Coskewness and Cokurtosis Best Linear Unbiased Estimator Takeaways
Learning Outcomes of QA02
Chapter 3.Michael Miller, Mathematics and Statistics for Financial Risk Management, 2nd Edition(Hoboken, NJ: John Wiley & Sons, 2013).
' Describe the four central moments of a statistical variable ordistribution: mean, variance, skewness and kurtosis.
' Interpret the skewness and kurtosis of a statistical distribution,and interpret the concepts of coskewness and cokurtosis.
' Describe and interpret the best linear unbiased estimator.
Christopher Ting QF 603 October 14, 2017 4/23
Introduction Moments Skewness Kurtosis Coskewness and Cokurtosis Best Linear Unbiased Estimator Takeaways
Moments
f The k-th moment of a random variable X is defined as
mk := E(Xk).
f The mean of X is also the first moment of X.
f The generalized concept of variance is
µk := E((X − µ)k
).
f We refer to µk as the k-th central moment of X. We say that themoment is central because it is centered on the mean.
Christopher Ting QF 603 October 14, 2017 5/23
Introduction Moments Skewness Kurtosis Coskewness and Cokurtosis Best Linear Unbiased Estimator Takeaways
Skewness
f The second central moment, variance, tells us how spread out arandom variable is around the mean.
f The third central moment tells us how symmetrical the distributionis around the mean.
f This standardized third central moment is known as skewness:
γ :=E((X − µ)3
)σ3
,
where σ is the standard deviation of X, and µ is the mean of X.
f A random variable that is symmetrical about its mean will havezero skewness. If the skewness of the random variable is positive(negative), we say that the random variable exhibits a positive(negative) skew.
Christopher Ting QF 603 October 14, 2017 6/23
Introduction Moments Skewness Kurtosis Coskewness and Cokurtosis Best Linear Unbiased Estimator Takeaways
Properties of Skewness
f Homework Assignment1 Show that E
((X − µ)3
)= E
(X3)− 3µσ2 − µ3.
2 If the skewness is zero, then it must be that E(X3)= µ
(3σ2 + µ2).
3 Assuming that f(x) is the probability density function. Prove thatthe above equation holds by computing
E(X3)=
∫ ∞−∞
x3f(x− µ)dx.
Note that since the skewness is zero, f(x) is necessarily an evenfunction.
f For many symmetrical continuous distributions, the mean,median, and mode all have the same value. Many continuousdistributions with negative skew have a mean that is less than themedian, which is less than the mode. But this rule of thumb doesnot always work.
Christopher Ting QF 603 October 14, 2017 7/23
Introduction Moments Skewness Kurtosis Coskewness and Cokurtosis Best Linear Unbiased Estimator Takeaways
Estimating Skewness
f The skewness of a random variable X, based on all nobservations, x1, x2, . . . , xn, can be calculated as
1
n
n∑i=1
(xi − µσ
)3
,
where µ is the population mean and σ is the population standarddeviation.
Christopher Ting QF 603 October 14, 2017 8/23
Introduction Moments Skewness Kurtosis Coskewness and Cokurtosis Best Linear Unbiased Estimator Takeaways
Finite-Sample Skewness Estimation
f When n is large, the sample skewness can be calculated as
1
n
n∑i=1
(xi − µ̂σ̂
)3
,
Note that the sample mean µ̂ and the standard deviation σ̂replace, respectively, the population mean and standard deviation.
f When n is not big, the following estimator is used instead:
n
(n− 1)(n− 2)
n∑i=1
(xi − µ̂σ̂
)3
,
Christopher Ting QF 603 October 14, 2017 9/23
Introduction Moments Skewness Kurtosis Coskewness and Cokurtosis Best Linear Unbiased Estimator Takeaways
Importance of Skewness
f Skewness is a very important concept in risk management. If thedistributions of returns of two investments are the same in allrespects, with the same mean and standard deviation, butdifferent skews, then the investment with more negative skew isgenerally considered to be more risky.
f Historical data suggest that many financial assets exhibit negativeskew.
Christopher Ting QF 603 October 14, 2017 10/23
Introduction Moments Skewness Kurtosis Coskewness and Cokurtosis Best Linear Unbiased Estimator Takeaways
Kurtosis
h For a random variable X, the kurtosis κ is defined as
κ :=E((X − µ)4
)σ4
.
The fourth central moment tells us how spread out a randomvariable is, especially the extreme points.
h Because the random variable with higher kurtosis has pointsfurther from the mean, we often refer to distribution with highkurtosis as fat-tailed .
Introduction Moments Skewness Kurtosis Coskewness and Cokurtosis Best Linear Unbiased Estimator Takeaways
Kurtosis and Risk
h From the risk management perspective, if the distribution ofreturns of two assets have the same mean, variance, andskewness but different kurtosis, then the distribution with thehigher kurtosis will tend to have more extreme points, and beconsidered more risky.
h Excess kurtosis is defined as the kurtosis minus 3, i.e.
κex := κ− 3.
h Distributions with positive excess kurtosis are termedleptokurtotic.
h Distributions with negative excess kurtosis are termedplatykurtotic.
Christopher Ting QF 603 October 14, 2017 12/23
Introduction Moments Skewness Kurtosis Coskewness and Cokurtosis Best Linear Unbiased Estimator Takeaways
Estimators of Kurtosis
h The kurtosis of a random variable X, based on all n observations,x1, x2, . . . , xn, can be calculated as
1
n
n∑i=1
(xi − µσ
)4
,
where µ is the population mean and σ is the population standarddeviation.
h When n is large, the sample kurtosis can be calculated as
1
n
n∑i=1
(xi − µ̂σ̂
)4
.
Christopher Ting QF 603 October 14, 2017 13/23
Introduction Moments Skewness Kurtosis Coskewness and Cokurtosis Best Linear Unbiased Estimator Takeaways
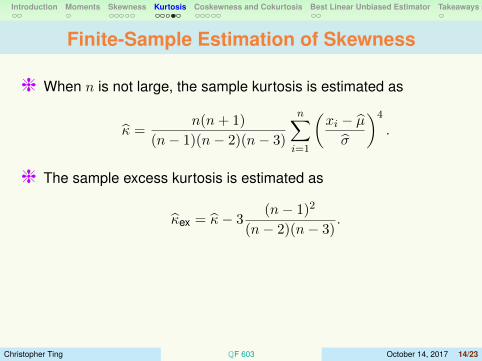
Finite-Sample Estimation of Skewness
h When n is not large, the sample kurtosis is estimated as
κ̂ =n(n+ 1)
(n− 1)(n− 2)(n− 3)
n∑i=1
(xi − µ̂σ̂
)4
.
h The sample excess kurtosis is estimated as
κ̂ex = κ̂− 3(n− 1)2
(n− 2)(n− 3).
Christopher Ting QF 603 October 14, 2017 14/23
Introduction Moments Skewness Kurtosis Coskewness and Cokurtosis Best Linear Unbiased Estimator Takeaways
Application of Skewness and Kurtosis
h A normally distributed random variable has 0 skewness and 0excess kurtosis.
h From the investment and risk management perspective, inaddition to mean and variance, a portfolio’s monthly return thathas a positive skewness and a negative excess kurtosis is moredesirable.
h Chart
κ̂ex-2 -1 1 2 3 4
γ̂
-2
-1
1
2
Christopher Ting QF 603 October 14, 2017 15/23
Introduction Moments Skewness Kurtosis Coskewness and Cokurtosis Best Linear Unbiased Estimator Takeaways
Equally Weighted Portfolio
i Covariance is a second-order linear relationship between a pair ofrandom variables.
i What about the third- and forth-order relationships?
i As an example of how higher-order cross moments can impactrisk assessment consider the fund returns for four fund managers,A, B, C, and D.
Time A B C D1 0.0% -3.8% -15.3% -15.3%2 -3.8% -15.3% -7.2% -7.2%3 -15.3% 3.8% 0.0% -3.8%4 -7.2% -7.2% -3.8% 15.3%5 3.8% 0.0% 3.8% 0.0%6 7.2% 7.2% 7.2% 7.2%7 15.3% 15.3% 15.3% 3.8%
Christopher Ting QF 603 October 14, 2017 16/23
Introduction Moments Skewness Kurtosis Coskewness and Cokurtosis Best Linear Unbiased Estimator Takeaways
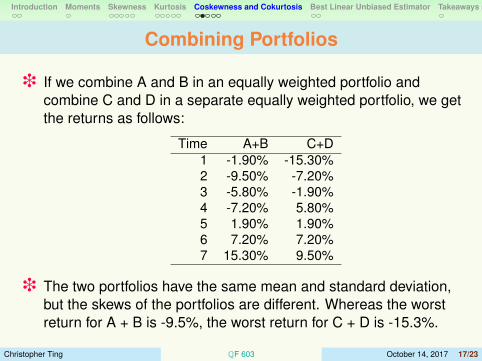
Combining Portfolios
i If we combine A and B in an equally weighted portfolio andcombine C and D in a separate equally weighted portfolio, we getthe returns as follows:
i The two portfolios have the same mean and standard deviation,but the skews of the portfolios are different. Whereas the worstreturn for A + B is -9.5%, the worst return for C + D is -15.3%.
Christopher Ting QF 603 October 14, 2017 17/23
Introduction Moments Skewness Kurtosis Coskewness and Cokurtosis Best Linear Unbiased Estimator Takeaways
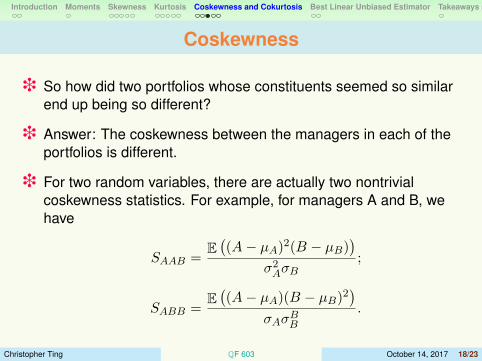
Coskewness
i So how did two portfolios whose constituents seemed so similarend up being so different?
i Answer: The coskewness between the managers in each of theportfolios is different.
i For two random variables, there are actually two nontrivialcoskewness statistics. For example, for managers A and B, wehave
SAAB =E((A− µA)2(B − µB)
)σ2AσB
;
SABB =E((A− µA)(B − µB)2
)σAσBB
.
Christopher Ting QF 603 October 14, 2017 18/23
Introduction Moments Skewness Kurtosis Coskewness and Cokurtosis Best Linear Unbiased Estimator Takeaways
Sample Coskewness
i The sample coskewness for the example is as follows:
Coskewness A+B C+DSXXY 0.99 -0.58SXY Y 0.58 -0.99
i What is the interpretation for this example?
Christopher Ting QF 603 October 14, 2017 19/23
Introduction Moments Skewness Kurtosis Coskewness and Cokurtosis Best Linear Unbiased Estimator Takeaways
General Cross Central Moments
i In general, for n random variables, the number of nontrivial crosscentral moments of order m is
km =(m+ n− 1)!
m!(n− 1)!− n.
i In this case, “nontrivial” means that we have excluded the crossmoments that involve only one variable (i.e., skewness andkurtosis).
i For example, when m = 4 and n, that is, co-kurtosis,
k4 =(4 + 2− 1)!
4!1!− 2 = 5− 2 = 3.
Indeed, there are 3 versions of cokurtosis: SXXXY , SXXY Y , andSXY Y Y .
Christopher Ting QF 603 October 14, 2017 20/23
Introduction Moments Skewness Kurtosis Coskewness and Cokurtosis Best Linear Unbiased Estimator Takeaways
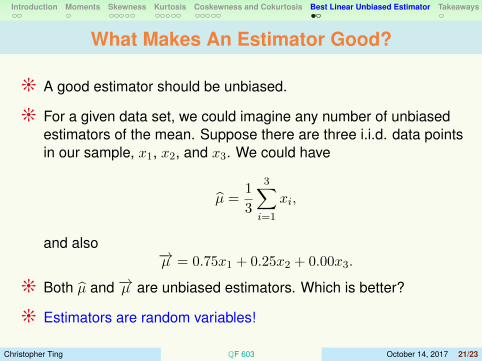
What Makes An Estimator Good?
j A good estimator should be unbiased.
j For a given data set, we could imagine any number of unbiasedestimators of the mean. Suppose there are three i.i.d. data pointsin our sample, x1, x2, and x3. We could have
µ̂ =1
3
3∑i=1
xi,
and also−→µ = 0.75x1 + 0.25x2 + 0.00x3.
j Both µ̂ and −→µ are unbiased estimators. Which is better?
j Estimators are random variables!
Christopher Ting QF 603 October 14, 2017 21/23
Introduction Moments Skewness Kurtosis Coskewness and Cokurtosis Best Linear Unbiased Estimator Takeaways
BLUE
j We can measure the variance of parameter estimators. Theestimator with the minimum variance is better as the accuracy ofthe estimator will be higher.
j If estimators can be written as a linear combination of the data, wecan often prove that a particular candidate has the minimumvariance among all the potential unbiased estimators. We call anestimator with these properties thebest linear unbiased estimator , or BLUE .
j All of the estimators for sample the mean, variance, covariance,skewness, and kurtosis are either BLUE or the ratio of BLUEestimators.
Christopher Ting QF 603 October 14, 2017 22/23
Introduction Moments Skewness Kurtosis Coskewness and Cokurtosis Best Linear Unbiased Estimator Takeaways
Summary
t Mean and variance are not sufficient; higher-order moments areimportant as well, in particular, skewness and kurtosis.
t For financial investment, fat right tails are best.
t For risk management, left fat tails bring nightmares.
t Covariance is the second-order cross central moment.
t Coskewness is the third-order cross central moment.
t Cokurtosis is the fourth-order cross central moment.