13
Back-on-Track WEEK 5: What are good trading shares? Chart Indicators Volume – The Price Volume Relationship
| Date post: | 23-Jun-2015 |
| Category: |
Documents |
| Upload: | balamory-trading-academy |
| View: | 107 times |
| Download: | 1 times |

Back-on-Track WEEK 5: What are good trading shares?
Chart Indicators Volume – The Price Volume Relationship
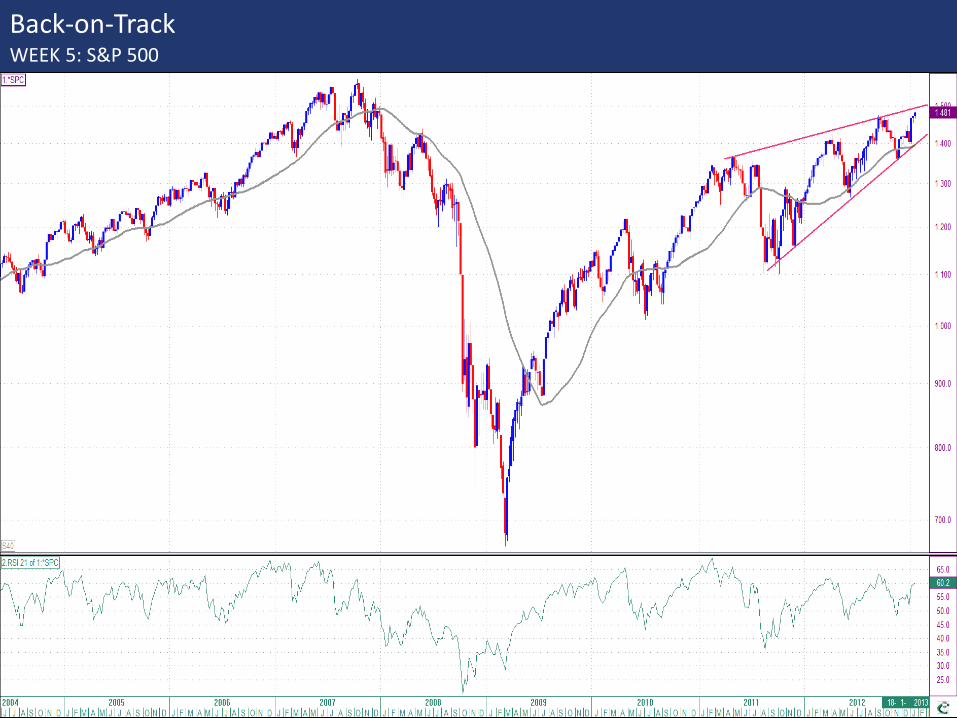
Back-on-Track WEEK 5: S&P 500
2
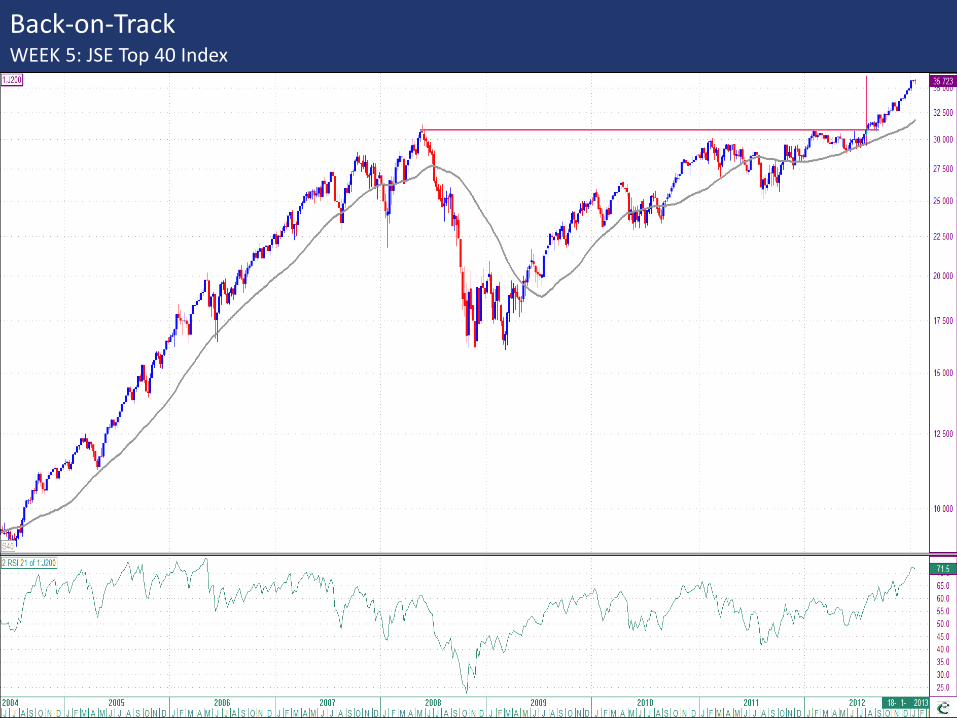
Back-on-Track WEEK 5: JSE Top 40 Index
3

Back-on-Track WEEK 5: JSE Top 40 Index
4

Back-on-Track WEEK 5: Euro dollar (This is the most important charts in financial markets!!)
5
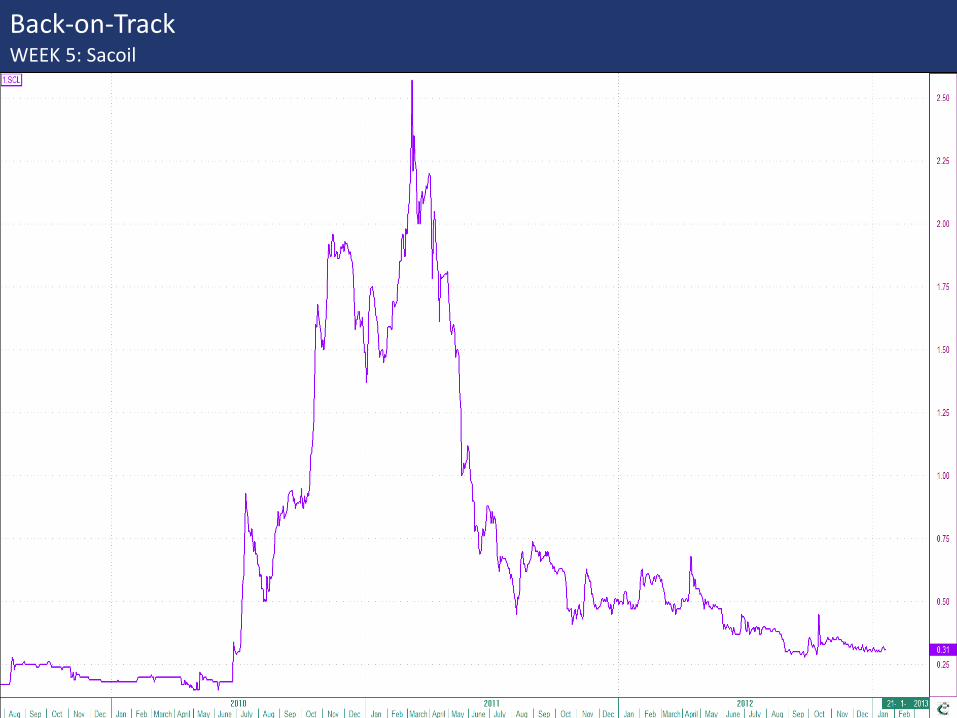
Back-on-Track WEEK 5: Sacoil
6

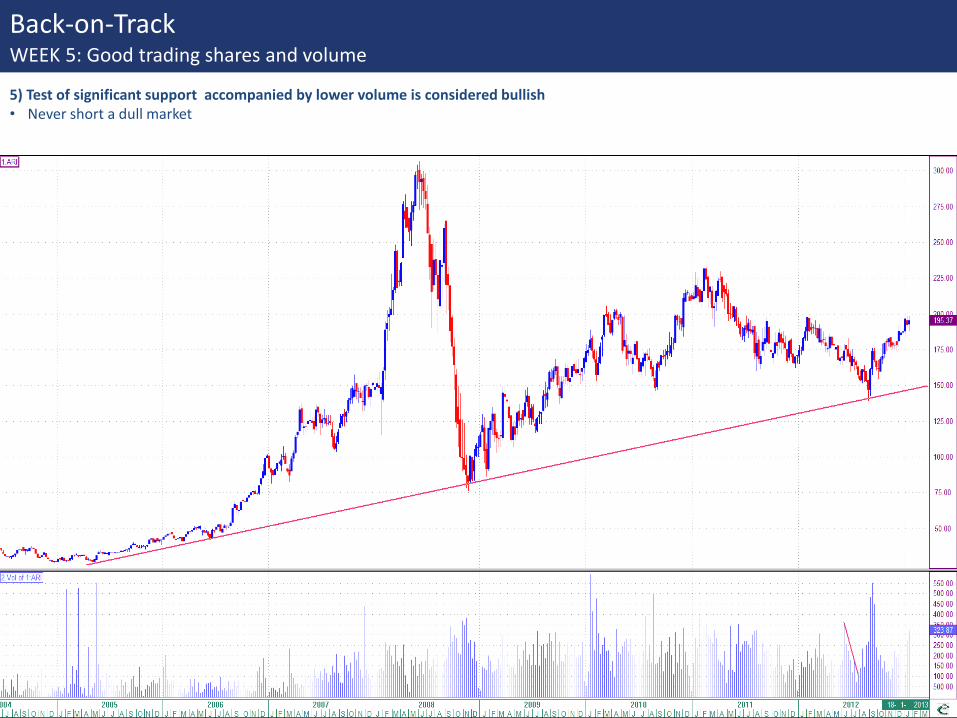
Back-on-Track WEEK 5: Good trading shares and volume
What constitutes a good trading share? Volume traded: guideline, should not be more than 10% of market Easily defined support and resistance: Prevents you from getting in at a bad level as well as gives you a narrow stop. Volatility: Opportunity costs of capital. Research: Easier to get a feel for a share if there is research available
7
A list of good trading shares: Resources: Billiton, Anglo American, Sasol, Kumba Iron Ore, Anglo American Platinum, Impala Platinum, AngloGold, Goldfields, Industrials: British American Tobacco, Sab Miller, Richemont, MTN, Naspers, Vodacom, Bidvest. Financials: Standard bank, First National Bank, Old Mutual, ABSA, Sanlam, Nedbank, Remgro, Retailers: Shoprite, Mr. Price, Truworths, Woolworths
What is an individuals most valuable commodity? Time: By allocating time to one activity prevents you from spending time doing other things. Opportunity costs: By buying a share, you prevent yourself from spending your cash elsewhere when other opportunities arise.

Back-on-Track WEEK 5: Good trading shares and volume Volume: • Number of shares traded on a particular period. • Normally displayed as a histogram. • Most indicators are a statistical manipulation of price. Volume is independent of price.
8
Why do we use volume? • When we look at independent indicators, it increases the probability of a reliable signal.
• If the evidence disagree, it warns us of the underlying weakness in the prevailing trend and that a reversal could be possible.
Principles of volume interpretation: 1) Volume normally goes with the trend. NB!!! • Uptrend: Volume should be expanding on upward movements and declining on price decreases • Downtrend: Volume should be contracting in up movements and expanding on down movements.

Back-on-Track WEEK 5: Good trading shares and volume
9
2) Volume normally leads price • A new high that is not confirmed by volume should be considered
a red flag. This can be viewed similar to the warning signs that divergence gives you.
• Rising prices and falling volume is abnormal and indicates a weak and suspicious rally. A share that is going up on falling volume indicates a rally based on a lack of selling pressure, not because buyers are enthusiastic. Look for strong support/resistance levels to Buy/Sell.

Back-on-Track WEEK 5: Good trading shares and volume
10
3) Exhaustion moves: • A parabolic rise in prices and a sharp increase in volume are
unsustainable, and eventually results in an exhaustion move. • Blow off and selling climax
4) Record volume coming off a major low is considered extremely bullish
Back-on-Track WEEK 5: Good trading shares and volume
11
5) Test of significant support accompanied by lower volume is considered bullish • Never short a dull market

Back-on-Track WEEK 5: Good trading shares and volume
12
6) After a period of price decline, Stable prices with abnormally high volume indicates accumulation. • If it breaks upwards after this period with expanding volume, it is considered extremely bullish.

Back-on-Track WEEK 5: Good trading shares and volume
Summary: • Volume levels should always be compared with the recent past.
• Volume should go with the trend
• If volume isn’t going in the direction of the trend, it is warning of a possible trend reversal.
13


