Morbidity and Mortality Weekly Report Weekly November 12, 2004 / Vol. 53 / No. 44 depar depar depar depar department of health and human ser tment of health and human ser tment of health and human ser tment of health and human ser tment of health and human services vices vices vices vices Centers for Disease Control and Prevention Centers for Disease Control and Prevention Centers for Disease Control and Prevention Centers for Disease Control and Prevention Centers for Disease Control and Prevention INSIDE 1038 Indoor Air Quality in Hospitality Venues Before and After Implementation of a Clean Indoor Air Law — Western New York, 2003 1041 Vaccination Coverage Among Children Entering School — United States, 2003–04 School Year 1044 Awareness of Family Health History as a Risk Factor for Disease — United States, 2004 1047 Preventive-Care Practices Among Adults with Diabetes — Puerto Rico, 2000–2002 1050 West Nile Virus Activity — United States, November 3–8, 2004 1051 Notices to Readers Great American Smokeout — November 18, 2004 In 2002, a total of 45.8 million U.S. adults (22.5%) were current smokers, a decrease from 24.1% in 1998, and an estimated 46 million adults were former smokers (1). For the first time, more adults had quit smoking than were still smoking (1). To assist in continuing this trend, the American Cancer Society (ACS) is sponsoring the 28th Great American Smokeout on November 18, 2004. Ciga- rette smokers are encouraged to quit smoking for at least 24 hours in the hope they might stop smoking. The likelihood of permanently quitting smoking is increased when effective therapies are used, such as phy- sician assistance, pharmacologic treatment, and behavioral counseling (2). In addition to individual methods, an environmental approach to reducing tobacco use involves increasing the excise tax for tobacco products, developing multicomponent mass media campaigns, fostering pro- vider reminder systems, using telephone quitlines, reducing patient out-of-pocket costs for effective cessa- tion therapies, and reducing exposure to secondhand smoke through smoking bans and restrictions (3). Addi- tional information about the Great American Smokeout is available at http://www.cancer.org or by telephone, 800-227-2345. References 1. CDC. Cigarette smoking among adults—United States, 2002. MMWR 2004;53:427–31. 2. Fiore MC, Bailey WC, Cohen SJ, et al. Treating tobacco use and dependence: clinical practice guidelines. Rockville, MD: US Department of Health and Human Services, Public Health Service; 2000. AHQR publication 00-0032. 3. CDC. Strategies for reducing exposure to environmental tobacco smoke, increasing tobacco-use cessation, and reducing initiation in communities and health-care systems: a report on recommen- dations of the Task Force on Community Preventive Services. MMWR 2000;49(No. RR-12):2–9. State-Specific Prevalence of Current Cigarette Smoking Among Adults — United States, 2003 Cigarette smoking causes approximately 440,000 deaths annually in the United States (1). To assess the prevalence of current cigarette smoking among adults, CDC analyzed data from the 2003 Behavioral Risk Factor Surveillance System (BRFSS) survey. This report summarizes the results of that analysis, which indicated substantial variation in cigarette smoking prevalence in the 50 states, the District of Columbia (DC), Guam, Puerto Rico, and the U.S. Virgin Islands (USVI) (range: 10.0%–34.0%). To further reduce the prevalence of smoking, states/areas should implement comprehensive to- bacco-control programs. BRFSS is a state-based, random-digit–dialed, telephone survey of the U.S. civilian, noninstitutionalized population aged >18 years. In 2003, the median state/area response rate was 53.2% (range: 34.4%–80.5%). Estimates were weighted by age and sex distributions for each state’s population, and 95% confidence intervals were calculated. BRFSS respondents were asked, “Have you smoked at least 100 cigarettes in your entire life?” and “Do you now smoke cigarettes every day, some
Transcript
Morbidity and Mortality Weekly Report
Weekly November 12, 2004 / Vol. 53 / No. 44
depardepardepardepardepartment of health and human sertment of health and human sertment of health and human sertment of health and human sertment of health and human servicesvicesvicesvicesvicesCenters for Disease Control and PreventionCenters for Disease Control and PreventionCenters for Disease Control and PreventionCenters for Disease Control and PreventionCenters for Disease Control and Prevention
INSIDE
1038 Indoor Air Quality in Hospitality Venues Before andAfter Implementation of a Clean Indoor Air Law —Western New York, 2003
1041 Vaccination Coverage Among Children Entering School —United States, 2003–04 School Year
1044 Awareness of Family Health History as a Risk Factor forDisease — United States, 2004
1047 Preventive-Care Practices Among Adults with Diabetes —Puerto Rico, 2000–2002
1050 West Nile Virus Activity — United States, November 3–8,2004
1051 Notices to Readers
Great American Smokeout —November 18, 2004
In 2002, a total of 45.8 million U.S. adults (22.5%)were current smokers, a decrease from 24.1% in 1998,and an estimated 46 million adults were former smokers(1). For the first time, more adults had quit smoking thanwere still smoking (1). To assist in continuing this trend,the American Cancer Society (ACS) is sponsoring the 28thGreat American Smokeout on November 18, 2004. Ciga-rette smokers are encouraged to quit smoking for at least24 hours in the hope they might stop smoking.
The likelihood of permanently quitting smoking isincreased when effective therapies are used, such as phy-sician assistance, pharmacologic treatment, and behavioralcounseling (2). In addition to individual methods, anenvironmental approach to reducing tobacco use involvesincreasing the excise tax for tobacco products, developingmulticomponent mass media campaigns, fostering pro-vider reminder systems, using telephone quitlines,reducing patient out-of-pocket costs for effective cessa-tion therapies, and reducing exposure to secondhandsmoke through smoking bans and restrictions (3). Addi-tional information about the Great American Smokeoutis available at http://www.cancer.org or by telephone,800-227-2345.
References1. CDC. Cigarette smoking among adults—United States, 2002.
MMWR 2004;53:427–31.2. Fiore MC, Bailey WC, Cohen SJ, et al. Treating tobacco use and
dependence: clinical practice guidelines. Rockville, MD: USDepartment of Health and Human Services, Public Health Service;2000. AHQR publication 00-0032.
3. CDC. Strategies for reducing exposure to environmental tobaccosmoke, increasing tobacco-use cessation, and reducing initiationin communities and health-care systems: a report on recommen-dations of the Task Force on Community Preventive Services.MMWR 2000;49(No. RR-12):2–9.
State-Specific Prevalence of CurrentCigarette Smoking Among Adults —
United States, 2003Cigarette smoking causes approximately 440,000 deaths
annually in the United States (1). To assess the prevalence ofcurrent cigarette smoking among adults, CDC analyzed datafrom the 2003 Behavioral Risk Factor Surveillance System(BRFSS) survey. This report summarizes the results of thatanalysis, which indicated substantial variation in cigarettesmoking prevalence in the 50 states, the District of Columbia(DC), Guam, Puerto Rico, and the U.S. Virgin Islands (USVI)(range: 10.0%–34.0%). To further reduce the prevalence ofsmoking, states/areas should implement comprehensive to-bacco-control programs.
BRFSS is a state-based, random-digit–dialed, telephonesurvey of the U.S. civilian, noninstitutionalized populationaged >18 years. In 2003, the median state/area response ratewas 53.2% (range: 34.4%–80.5%). Estimates were weightedby age and sex distributions for each state’s population, and95% confidence intervals were calculated. BRFSS respondentswere asked, “Have you smoked at least 100 cigarettes in yourentire life?” and “Do you now smoke cigarettes every day, some
SUGGESTED CITATIONCenters for Disease Control and Prevention. [Article Title].MMWR 2004;53:[inclusive page numbers].
The MMWR series of publications is published by theCoordinating Center for Health Information and Service(Proposed), Centers for Disease Control and Prevention(CDC), U.S. Department of Health and Human Services,Atlanta, GA 30333.
Centers for Disease Control and Prevention
Julie L. Gerberding, M.D., M.P.H.Director
Dixie E. Snider, M.D., M.P.H.(Acting) Chief of Science
Tanja Popovic, M.D., Ph.D.(Acting) Associate Director for Science
Coordinating Center for Health Informationand Service (Proposed)
James S. Marks, M.D., M.P.H.(Acting) Director
John W. Ward, M.D.Editor, MMWR Series
Suzanne M. Hewitt, M.P.A.Managing Editor, MMWR Series
Douglas W. Weatherwax(Acting) Lead Technical Writer/Editor
Stephanie M. MalloyJude C. RutledgeTeresa F. Rutledge
Writers/Editors
Lynda G. CupellMalbea A. LaPete
Visual Information Specialists
Kim L. Bright, M.B.A.Quang M. Doan, M.B.A.
Erica R. ShaverInformation Technology Specialists
Notifiable Disease Morbidity and 122 Cities Mortality DataRobert F. Fagan
Deborah A. AdamsFelicia J. ConnorLateka Dammond
Rosaline DharaDonna Edwards
Patsy A. HallPearl C. Sharp
days, or not at all?” Current smokers were defined as thosewho reported having smoked >100 cigarettes during their life-times and who currently smoke every day or some days.
In 2003, the median prevalence of current cigarette smok-ing among adults was 22.1% in the 50 states and DC (range:12.0% [Utah]–30.8% [Kentucky]) (Table). Smoking preva-lence was higher among men (median: 24.8%; range: 14.0%–33.8%) than women (median: 20.3%; range: 9.9%–28.1%)in the 50 states and DC. Smoking prevalence for both menand women was highest in Kentucky (men: 33.8%; women:28.1%) and lowest in Utah (men: 14.0%; women: 9.9%). Inareas other than the 50 states and DC, the median prevalenceof current cigarette smoking among adults was 13.6% (range:10.0% [USVI]–34.0% [Guam]).Reported by: J Bombard, MSPH, A Malarcher, PhD, M Schooley,MPH, A MacNeil, MPH, Office on Smoking and Health, NationalCenter for Chronic Disease Prevention and Health Promotion, CDC.
Editorial Note: Although the prevalence of current cigarettesmoking among U.S. adults has declined, the rate of declinehas not been rapid enough for the nation to achieve the 2010national health objective of <12% of adults smoking ciga-rettes (objective 27-1) (2,3). The median prevalence of adultsmoking decreased 1 percentage point from 2002 to 2003,and the national objective for 2010 was achieved in Utah andthe USVI. The high prevalence of current cigarette smokingin most of the remaining states/areas underscores the need forincreased efforts to reduce tobacco use.
The findings in this report are subject to at least three limi-tations. First, the BRFSS survey does not sample persons inhouseholds without telephones, a population that might bemore likely to smoke (4). Second, data for cigarette smokingare based on self-reports and are not validated with biochemi-cal tests. However, self-reported data on current smoking sta-tus have high validity (4). Third, the median response ratewas 53.2% (range: 34.4%–80.5%); lower response ratesindicate a potential for response bias. However, BRFSS esti-mates for cigarette smoking are comparable with current smok-ing estimates from other surveys with higher response rates (5).
Comprehensive tobacco control is effective in preventingand reducing tobacco use (6). CDC recommends the follow-ing evidence-based interventions as strategies within compre-hensive tobacco-control programs: clean indoor air laws,telephone support quitlines, media campaigns, increasedexcise taxes on tobacco products, insurance coverage for ces-sation counseling and pharmaceuticals, and health-care sys-tem changes that support cessation (7). Substantial variationexists across states in their use of these strategies. For example,in 2002, two states offered Medicaid coverage for all recom-mended medication and counseling treatments for tobaccodependence, whereas 11 states covered no tobacco-dependence
Vol. 53 / No. 44 MMWR 1037
treatments (8). In addition, the average cost of a single packof cigarettes (which includes state-based excise taxes) rangedfrom $3.10 in Kentucky to $5.54 in New York in 2003 (9).The majority of states offer telephone support quitlines, andresidents of all states soon will have access to a nationwidenetwork of quitlines. Finally, only six states (California,Connecticut, Delaware, Maine, Massachusetts, and New York)have comprehensive statewide bans in effect on smoking inindoor workplaces and public places.
The more funds that states spend on comprehensive tobacco-control programs, the greater the reduction in smoking (6).However, the amount of money that states spend for tobaccocontrol decreased 28% during the preceding 2 years to $541.1million, which is less than 3% of the estimated $19 billionstates expected to receive from tobacco excise taxes andtobacco settlement money in 2003 (10). For fiscal year 2004(i.e., July 1, 2003–June 31, 2004), only four states (Arkansas,Delaware, Maine, and Mississippi) were investing at least theminimum per capita amount that CDC recommends fortobacco-control programs (10). Efforts and resources mustbe expanded if more states are to reduce smoking prevalenceto <12% by 2010.References1. CDC. Annual smoking-attributable mortality, years of potential life
lost, and economic costs—United States 1995–1999. MMWR2002;51:300–3.
2. CDC. Cigarette smoking among adults—United States, 2002. MMWR2004;53:427–31.
3. US Department of Health and Human Services. Healthy people 2010(conference ed, in 2 vols). Washington, DC: US Department of Healthand Human Services; 2000. Available at http://www.health.gov/healthypeople.
4. Nelson DE, Holtzman D, Bolen J, Stanwyck CA, Mack KA. Reliabil-ity and validity of measures from the Behavioral Risk Factor Surveil-lance System (BRFSS). Social Prev Med 2001;46:S3–S42.
5. US Department of Health and Human Services. Women and smok-ing: a report of the Surgeon General. Rockville, MD: US Departmentof Health and Human Services, Public Health Service, Office of theSurgeon General; 2001:24–25.
6. Farrelly MC, Pechacek TP, Chaloupka FJ. The impact of tobacco con-trol program expenditures on aggregate cigarette sales: 1981–2000.Health Econ 2003;22:843–59.
7. Task Force on Community Preventive Services. Guide to communitypreventive services: tobacco use prevention and control. Am J PrevMed 2001;20(2 Suppl 1):1–87.
8. CDC. State Medicaid coverage for tobacco-dependence treatments—United States, 1994–2002. MMWR 2004;53:54–7.
9. Orzechowski W, Walker RC. The tax burden on tobacco, volume 38.Arlington, VA: Orzechowski and Walker; 2003.
10. Campaign for Tobacco-Free Kids, American Heart Association, Ameri-can Cancer Society, American Lung Association. A broken promise toour children: the 1998 state tobacco settlement five years later. Wash-ington, DC: Campaign for Tobacco-Free Kids; 2003. Available athttp://www.tobaccofreekids.org/reports/settlements/2004/fullreport.pdf.
TABLE. Prevalence of current cigarette smoking among adults*, bystate/area and sex — Behavioral Risk Factor Surveillance System,50 states, District of Columbia, Guam, Puerto Rico, and U.S. VirginIslands, 2003
Men Women TotalState/Area % (95% CI†) % (95% CI) % (95% CI)
Indoor Air Quality in HospitalityVenues Before and After
Implementation of a Clean IndoorAir Law — Western New York, 2003Secondhand smoke (SHS) contains more than 50 carcino-
gens (1). SHS exposure is responsible for an estimated 3,000lung cancer deaths and more than 35,000 coronary heart dis-ease deaths among never smokers in the United States eachyear (2), and for lower respiratory infections, asthma, suddeninfant death syndrome, and chronic ear infections amongchildren (3). Even short-term exposures to SHS, such as thosethat might be experienced by a patron in a restaurant or barthat allows smoking, can increase the risk of experiencing anacute cardiovascular event (4). Although population-based dataindicate declining SHS exposure in the United States overtime (5), SHS exposure remains a common but preventablepublic health hazard. Policies requiring smoke-free environ-ments are the most effective method of reducing SHS expo-sure (6). Effective July 24, 2003, New York implemented acomprehensive state law requiring almost all indoor work-places and public places (e.g., restaurants, bars, and otherhospitality venues) to be smoke-free. This report describes anassessment of changes in indoor air quality that occurred in20 hospitality venues in western New York where smoking orindirect SHS exposure from an adjoining room was observedat baseline. The findings indicate that, on average, levels ofrespirable suspended particles (RSPs), an accepted marker forSHS levels, decreased 84% in these venues after the law tookeffect. Comprehensive clean indoor air policies can rapidlyand effectively reduce SHS exposure in hospitality venues.
The specific class of RSP monitored was PM2.5 (i.e., par-ticulate matter that is <2.5 microns in diameter). Particles ofthis size are released in substantial amounts from burning ciga-rettes and are easily inhaled deep into the lungs. Baseline mea-surements were made during July 11–23 in a purposeful sampleof 22 hospitality venues in three counties in western New York.Sites were selected to provide a range of venue types, sizes,and locations. The sample consisted of seven bars, six bar/restaurants, five restaurants, two bowling alleys, a pool hall,and a bingo hall. The venues were located in popular down-town entertainment districts and suburban areas and rangedfrom small neighborhood bars to large bar/restaurant chains.
At baseline, smoking was occurring in 14 bars and restau-rants and four large recreation venues. Two bar/restaurantcombinations allowed smoking in the bar section but not inthe adjoining restaurant section. In these two venues, air qualitywas monitored separately in the restaurant and bar areas. Intwo restaurants, no smoking was occurring at baseline because
restaurants were already required to be smoke-free by localclean indoor air ordinances. Follow-up measurements of airquality were made in all 22 venues during September 9–November 1. The follow-up measurements were taken on thesame day of the week and at approximately the same time ofday as the measurements taken before the smoke-free law wasimplemented.
The median time spent in each venue for all 44 baselineand follow-up observations combined was 38 minutes (range:22–140 minutes). Measurements were taken at 1-secondintervals. The number of persons and the number of burningcigarettes in each venue were recorded every 10 minutes dur-ing sampling, and the average number of persons and theaverage number of burning cigarettes in each venue were cal-culated. The volume of each venue also was measured*, andthe cigarette density was calculated by dividing the averagenumber of burning cigarettes by the room volume.
An air monitor† was used to sample and record RSP levels.The monitor was placed in a central location on a table or barnear the height at which a person breathes air. The monitorrecorded continuous measurements, which were averaged overtime. The first and last minute of logged data were removed,and the remaining data points were averaged to provide anaverage concentration of PM2.5 within the venue. The per-centage change in PM2.5 levels was then determined by com-paring average PM2.5 levels in each venue before the law wentinto effect with levels after the law was implemented. TheWilcoxon signed-rank test was used to assess changes betweenpre-law and post-law PM2.5 levels, stratified by type of venue.
The average PM2.5 concentration was substantially lowerafter the law went into effect in every venue where smoking orindirect SHS exposure had been observed at baseline, with agrand mean reduction in PM2.5 concentration of 84% (324µg/m3 to 25 µg/m3; p<0.001) (Table). When stratified by thetype of venue sampled, the average PM2.5 concentrationdecreased 90% (412 µg/m3 to 27 µg/m3; p<0.001) in the 14bars and restaurants in which smoking was occurring atbaseline (including bar/restaurant J, which was the only venuewhere smoking was observed during the post-law sampling).The restaurant portions of the two bar/restaurants thatallowed smoking in the bar section but not in the restaurantsection experienced an average 58% decrease in PM2.5
* The Zircon DM S50 Sonic Measure® (Zircon Corporation, Campbell,California) was used to perform this measurement.
† The air monitor used was a TSI SidePak AM510 Personal Aerosol Monitor®
(TSI, Inc., St. Paul, Minnesota). The SidePak uses a built-in sampling pumpto draw air through the device, which then measures the real-time concentrationin milligrams per cubic meter of PM2.5. The SidePak was calibrated against aSHS-calibrated nephelometer, which had been previously calibrated and usedin similar studies. The SidePak was zero-calibrated before each use accordingto the manufacturer’s specifications.
know what matters.
Dispatch
up-to-the-minute: adj1 : extending up to the immediate present,
including the very latest information;
see also MMWR.
Centers for Disease Control and Prevention
Centers for Disease Control and Prevention
Centers for Disease Control and Prevention
Centers for Disease Control and Prevention
Centers for Disease Control and Prevention
MMWR Dispatch
Vol. 52 / April 29, 2003
Morbidity and Mortality Weekly ReportCDC’s interim surveillance case definition for severe acute
respiratory syndrome (SARS) has been updated to include
laboratory criteria for evidence of infection with the SARS-
associated coronavirus (SARS-CoV) (Figure, Box). In addi-
tion, clinical criteria have been revised to reflect the possible
spectrum of respiratory illness associated with SARS-CoV. Epi-
demiologic criteria have been retained. The majority of U.S.
cases of SARS continue to be associated with travel*, with
only limited secondary spread to household members or
health-care providers (1).
SARS has been associated etiologically with a novel
coronavirus, SARS-CoV (2,3). Evidence of SARS-CoV
infection has been identified in patients with SARS in several
countries, including the United States. Several new labora-
tory tests can be used to detect SARS-CoV. Serologic testing
for coronavirus antibody can be performed by using indirect
fluorescent antibody or enzyme-linked immunosorbent
assays that are specific for antibody produced after infection.
Although some patients have detectable coronavirus antibody
during the acute phase (i.e., within 14 days of illness onset),
definitive interpretation of negative coronavirus antibody tests
is possible only for specimens obtained >21 days after onset
of symptoms. A reverse transcriptase polymerase chain reac-
tion (RT-PCR) test specific for viral RNA has been positive
within the first 10 days after onset of fever in specimens from
some SARS patients, but the duration of detectable viremia
or viral shedding is unknown. RT-PCR testing can detect
SARS-CoV in clinical specimens, including serum, stool, and
nasal secretions. Finally, viral culture and isolation have both
been used to detect SARS-CoV. Absence of SARS-CoV anti-
body in serum obtained <21 days after illness onset, a nega-
tive PCR test, or a negative viral culture does not exclude
coronavirus infection.Reported U.S. cases of SARS still will be classified as sus-
pect or probable; however, these cases can be further classi-
fied as laboratory-confirmed or -negative if laboratory data
are available and complete, or as laboratory-indeterminate if
specimens are not available or testing is incomplete. Obtain-
ing convalescent serum samples to make a final determina-
tion about infection with SARS-CoV is critical.
No instances of SARS-CoV infection have been detected
in persons who are asymptomatic. However, data are insuffi-
cient to exclude the possibility of asymptomatic infection with
SARS-CoV and the possibility that such persons can trans-
mit the virus. Investigations of close contacts and health-care
workers exposed to SARS patients might provide informa-
tion about the occurrence of asymptomatic infected persons.
Similarly, the clinical manifestations of SARS might extend
Updated Interim Surveillance Case Definition for Severe Acute Respiratory Syndrome
(SARS) — United States, April 29, 2003
* In this updated case definition, Taiwan has been added to the areas with documented
or suspected community transmission of SARS; Hanoi, Vietnam is now an area
with recently documented or suspected community transmission of SARS.
FIGURE. Clinical and laboratory criteria for probable and
suspect severe acute respiratory syndrome (SARS) cases and
SARS-associated coronavirus (SARS-CoV) infection — United
States, April 29, 2003
Laboratory-confirmed UndeterminedNegative
Moderaterespiratoryillness
Severerespiratoryillness
Mildrespiratory*illness/Asymptomatic
Clin
ical
crit
eria
Laboratory criteria for SARS-CoV
Suspect case*Probable case*
Reported to World Health Organization
* Meets epidemiologic criteria.
1040 MMWR November 12, 2004
TABLE. Change in concentrations of respirable suspended particles after the implementation of a clean indoor air law, by venue —western New York, 2003
Cigarette density* Average PM2.5† level (µg/m3)
Before After Before After % reductionVenue Size (m3) July 24, 2003 July 24, 2003 July 24, 2003 July 24, 2003 in PM2.5
Bars and restaurants in whichsmoking was occurringBar A 349 0.86 0 353 56 84.1Bar B 453 1.32 0 375 20 94.7Bar C 225 1.34 0 1,375 52 96.2Bar D 319 0.94 0 386 35 90.9Bar E 245 0.86 0 104 28 73.1Bar F 339 3.25 0 569 26 95.4Bar G 335 1.79 0 681 13 98.1Bar/Restaurant H 299 1.34 0 425 10 97.6Bar/Restaurant I 321 1.56 0 198 21 89.3Bar/Restaurant J 551 1.45 0.09 597 83 86.1Bar/Restaurant K 479 0.42 0 62 10 83.9Bar/Restaurant L 318 0.52 0 352 6 98.0Bar/Restaurant M 786 0.25 0 54 11 79.6Restaurant N 95 3.15 0 233 6 97.4Mean§ 365 1.36 0.01 412 27 90.3
Other venues in whichsmoking was occurringBowling alley Q 5,930 0.03 0 35 13 62.9Bowling alley R 2,916 0.17 0 87 26 70.1Pool hall S 1,570 0.26 0 176 6 96.6Bingo hall T 3,704 0.40 0 105 26 75.2Mean§ 3,530 0.22 0 101 18 76.2
Grand mean** 1,003 1.01 0.01 324 25 84.3
Restaurants in which nosmoking and no indirectSHS exposure was occurringRestaurant U 446 0 0 6 6 0.0Restaurant V 337 0 0 41 40 2.4Mean§ 392 0 0 24 23 1.2
* Average number of burning cigarettes per 100 m3.† Particulate matter <2.5 microns in diameter.§ Results represent the average of the values for the venues listed in each category.¶ Restaurant O is attached to Bar A with little physical separation between the two spaces; Restaurant P is attached to Bar B but with substantial physical
separation between the two spaces.** For all venues where any smoking or indirect SHS exposure was occurring at baseline (i.e., venues A–T).
concentrations (156 µg/m3 to 31 µg/m3; p<0.001) after thelaw was implemented, even though they had only indirectSHS exposure at baseline. In the four other large recreationvenues, which had larger volumes and lower smoker densi-ties, the average PM2.5 concentration decreased 76% (101µg/m3 to 18 µg/m3). In contrast, the PM2.5 concentrationremained low and virtually constant in the two restaurantsthat were already smoke-free at baseline; these venues werenot included in the grand mean calculation.
Reported by: MJ Travers, KM Cummings, PhD, A Hyland, PhD,Dept of Health Behavior, Roswell Park Cancer Institute, Buffalo, NewYork. J Repace, MSc, Repace Associates, Bowie, Maryland. S Babb, MPH,T Pechacek, PhD, R Caraballo, PhD, Office on Smoking and Health,National Center for Chronic Disease Prevention and Health Promotion,CDC.
Editorial Note: The findings in this report indicate that astatewide law to eliminate smoking in enclosed workplacesand public places substantially reduced RSP levels in westernNew York hospitality venues. RSP levels were reduced in
Vol. 53 / No. 44 MMWR 1041
every venue that permitted smoking before the law was imple-mented, including venues in which only SHS from an adja-cent room was observed at baseline.
These findings are consistent with those of previous stud-ies. In Delaware, a similar decline in RSP levels was observedin eight hospitality venues after smoking was prohibited thereby state law (7). Previous studies also have assessed the healtheffects of smoke-free laws. One study indicated that respira-tory health improved rapidly among a sample of bartendersafter a state smoke-free workplace law was implemented inCalifornia (8), and another study reported a 40% reductionin acute myocardial infarction admissions to a regional hospi-tal during the 6 months that a local smoke-free ordinance wasin effect in Helena, Montana (9). The results of these studies(both those assessing changes in indoor air quality and thoseassessing changes in health) suggest that improvements canoccur within months of policy implementation.
The findings in this report are subject to at least two limita-tions. First, the venues sampled were not necessarily represen-tative of venues in western New York. However, they didprovide a range of venue types, sizes, and locations. Second,SHS is not the only source of indoor particulate matter. How-ever, although ambient particle concentrations and cookingare additional sources of indoor particle levels, secondhandsmoke is the largest contributor to indoor RSP pollution (3).
Eliminating nonsmoker exposure to SHS is one of the fourgoals of comprehensive state tobacco-control programs, as setforth in CDC’s Best Practices for Comprehensive Tobacco Con-trol Programs (10). The results of the study described in thisreport indicate that a comprehensive statewide ban on smok-ing in indoor workplaces and public places can substantiallyreduce SHS exposure in these settings. Six states (California,Connecticut, Delaware, Maine, Massachusetts, and New York)currently meet the national health objective for 2010 callingfor implementation of such laws. These six states account forapproximately 23% of the U.S. population. Rhode Island alsohas adopted such a law, but the law does not take full effectuntil 2006. To further reduce the nearly 40,000 deaths amongnever smokers caused by SHS exposure each year, similarcomprehensive laws are needed in the other 43 states and theDistrict of Columbia.References1. National Toxicology Program. 9th report on carcinogens. Research
Triangle Park, NC: US Department of Health and Human Services,National Institute of Environmental Health Sciences; 2000.
2. CDC. Annual smoking-attributable mortality, years of potential lifelost, and economic costs—United States, 1995–1999. MMWR2002;51:300–3.
3. National Cancer Institute. Health effects of exposure to environmen-tal tobacco smoke: the report of the California Environmental Protec-tion Agency. Bethesda, MD: US Department of Health and HumanServices, National Institutes of Health, National Cancer Institute; 1999.
4. Pechacek TF, Babb S. Commentary: how acute and reversible are thecardiovascular risks of secondhand smoke? BMJ 2004;328:980–3.
5. CDC. Second national report on human exposure to environmentalchemicals. Atlanta, GA: US Department of Health and Human Ser-vices, CDC; 2003.
6. CDC. Reducing tobacco use: a report of the Surgeon General. Atlanta,GA: US Department of Health and Human Services, CDC; 2000.
7. Repace J. Respirable particles and carcinogens in the air of Delawarehospitality venues before and after a smoking ban. J Occup EnvironMed 2004;46:887–905.
8. Eisner MD, Smith AK, Blanc PD. Bartenders’ respiratory health afterestablishment of smoke-free bars and taverns. JAMA 1998;280:1909–14.
9. Sargent RP, Shepard RM, Glantz SA. Reduced incidence of admis-sions for myocardial infarction associated with public smoking ban:before and after study. BMJ 2004;328:977–80.
10. CDC. Best practices for comprehensive tobacco control programs—August 1999. Atlanta, GA: US Department of Health and HumanServices, CDC; 1999. Available at http://www.cdc.gov/tobacco/bestprac.htm.
Vaccination Coverage AmongChildren Entering School —
United States, 2003–04 School YearOne of the national health objectives for 2010 is to sustain
>95% vaccination coverage among children in kindergartenthrough first grade (objective 14-23) (1). To determine thepercentage of vaccination coverage among children enteringkindergarten, data on vaccination coverage were analyzed fromreports submitted to the National Immunization Program bystates, the District of Columbia (DC)*, and eight current orformer U.S. territories for the 2003–04 school year. Thisreport summarizes the results of that analysis, which deter-mined that coverage for all vaccines except hepatitis B (HepB)and varicella was reported at >90% in 45 areas. However, thevaccines required in each reporting area and the methods forsurveying kindergarten-aged children vary substantially; inseven states, <20% of eligible children were surveyed. Thewide variations in survey populations underscore the need forCDC to continue working with immunization programs instates, DC, and current or former territories to improvesurvey methods and automate reporting of data.
For the 2003–04 school year, all states except one submit-ted reports of vaccination coverage levels for children enter-ing kindergarten. Fifty reports included coverage for poliovirusvaccine, diphtheria and tetanus toxoids and pertussis vaccine,diphtheria and tetanus toxoids and acellular pertussis vaccine,
* For this report, DC is included in state totals.
or diphtheria and tetanus toxoids (DTP/DTaP/DT), measlesvaccine, and rubella vaccines; 49 reports included coveragefor mumps vaccine (Table 1). Coverage for HepB vaccine wasincluded in 43 reports, and coverage for varicella vaccine wasincluded in 33 state reports. DC reported on all of the vacci-nation coverages. When determining coverage, up-to-date(UTD) status was used rather than number of doses becausethe doses required to be UTD vary depending on timing ofvaccinations, area requirements regarding number of doses,and brand of vaccines.
The number of state reports based on 100% of childrenentering kindergarten increased from 18 in the 2002–03 schoolyear to 22 in 2003–04 (2). In an additional 21 states, cover-age was assessed in surveys of >80% of eligible children. Inthe remaining seven states, coverage was assessed in surveys of<20% of eligible children (range: 0.5%–18.5%). Nationalestimates of coverage were calculated by weighting each state’scoverage estimate by the size of the state’s kindergartenenrollment.
Coverage for all vaccines except HepB and varicella wasreported at 90%–95% in 16 (31.3%) states and at >95% in29 (56.9%) states (Table 1). Nationally, coverage was reportedat >95% for all vaccines except varicella, for which coveragewas 93.3%.
Five (63%) of the eight current or former U.S. territoriesreported data for the 2003–04 school year. All five reportsincluded coverage for poliovirus vaccine, DTP/DTaP/DTvaccine, and vaccines for measles, mumps, rubella, and HepB(Table 2). Two territories reported coverage for 1 dose of vari-cella vaccine. The percentage of children surveyed by the cur-rent or former U.S. territories ranged from 10.0% to 100.0%.Coverage for all vaccines except DTP/DTaP/DT vaccine wasreported to be >86%.Reported by: B Lyons, MPH, C Stanwyck, PhD, Immunization SvcsDiv; M McCauley, MTSC, National Immunization Program, CDC.
Editorial Note: CDC has increased efforts to help states andcurrent or former U.S. territories collect and report data onvaccination coverage among children entering school by pro-viding a new online reporting system, available since the2002–03 school year. Anecdotal reports from states indicatethat the online reporting system, which automates data man-agement and calculation tasks, has made it easier for states toreport their coverage. CDC also has encouraged greater stan-dardization of reporting; unlike previous reports, this reportis based only on coverage among children entering kindergar-ten, rather than on a mix of those children and first graders.
Online
know what matters.
e ncore.Week after week, MMWR Online plays an important role in helping
you stay informed. From the latest CDC guidance to breaking
health news, count on MMWR Online to deliver the news you
need, when you need it.
Log on to cdc.gov/mmwr and enjoy MMWR performance.
Vol. 53 / No. 44 MMWR 1043
TABLE 1. Estimated vaccination coverage among children enrolled in kindergarten, by vaccine and state*— Annual SchoolSurveillance, United States, 2003–04 school year
* Includes District of Columbia.† Percentage of eligible children included in the survey.§ Diphtheria and tetanus toxoids and pertussis vaccine, diphtheria and tetanus toxoids and acellular pertussis vaccine, or diphtheria and tetanus toxoids.¶ Hepatitis B vaccine.
** Data not available.
1044 MMWR November 12, 2004
TABLE 2. Estimated vaccination coverage among children enrolled in kindergarten, by vaccine and territory — Annual SchoolSurveillance, current or former U.S. territories, 2003–04 school year
* Percentage of eligible children included in the survey.† Diphtheria and tetanus toxoids and pertussis vaccine, diphtheria and tetanus toxoids and acellular pertussis vaccine, or diphtheria and tetanus toxoids.
§ Hepatitis B vaccine.
¶ Data not available.
State laws requiring proof of vaccination before enteringschool have been referred to as a “safety net” for the U.S. vac-cination program because they ensure that no child is missed(3). This safety net relies on the efforts of school nurses, teach-ers, and others to identify children who are not UTD. Find-ings of uniformly high nationwide coverage during the2002–03 and 2003–04 school years underscore the success ofschool entry requirements in boosting vaccine coverage. Child-hood vaccination coverage is also measured nationally amongchildren aged 19–35 months (4). Higher percentages of chil-dren are UTD at kindergarten entry than at younger ages,suggesting that school entry laws are a key to ensuring highcoverage.
The findings in this report are subject to at least two limita-tions. First, methods for assessing vaccination coverage amongchildren entering school vary because state and local lawsdetermine which vaccines and doses are required, and sam-pling methods differ. The substantial variation in samplingmethods among states limits the comparability of these data.Second, children attending private schools and those who arehome-schooled were not surveyed by all states. The differencein vaccination rates between children schooled at home andchildren in traditional school environments is unknown.
Additional information about assessing and reporting vac-cination coverage among children entering school is availablefrom the National Immunization Program Immunization In-formation Hotline, telephone 800-232-2522 (English) or800-232-0233 (Spanish), or by e-mail at [email protected]. US Department of Health and Human Services. Healthy people 2010
(conference ed, in 2 vols). Washington, DC: US Department of Healthand Human Services; 2000. Available at http://www.health.gov/healthypeople.
2. CDC. Vaccination coverage among children entering school—UnitedStates, 2002–03 school year. MMWR 2003;52:791–3.
3. Orenstein WA, Bernier RH. Surveillance. Information for action. PediatrClin North Am 1990;37:709–34.
4. CDC. National, state, and urban area vaccination levels among chil-dren aged 19–35 months—United States, 2003. MMWR 2004;53:658–61.
Awareness of Family Health Historyas a Risk Factor for Disease —
United States, 2004Persons who have close relatives with certain diseases (e.g.,
heart disease, diabetes, and osteoporosis) are more likely todevelop those diseases themselves (1). Family health history isan important risk factor that reflects inherited genetic suscep-tibility, shared environment, and common behaviors. Althoughclinicians are trained to collect family histories, substantialbarriers exist to obtaining this information in primary carepractice (e.g., lack of time or lack of reimbursement) (2). Topromote the use of family history as a screening tool for dis-ease prevention and health promotion, several initiatives havecalled for new self-administered family history collection toolsand educational programs to help clinicians interpret andapply family history information to patient care (3,4). Toassess attitudes, knowledge, and practices of U.S. residentsregarding their family health histories, CDC analyzed datafrom the 2004 HealthStyles Survey. This report summarizesthe results of that analysis, which indicated that although96.3% of survey respondents believe their family history isimportant for their own health, few have actively collectedhealth information from their relatives to develop a familyhistory. Targeted public health efforts are needed to 1) helppersons collect family history information to share with theirhealth-care providers and 2) educate and assist providers tointerpret and apply this information effectively.
HealthStyles is an annual mail survey of the U.S. popula-tion aged >18 years that examines health-related attitudesand behaviors (5). The survey is designed and conducted byPorter Novelli (Washington, DC), with technical assistancefrom health organizations, including CDC. In July andAugust 2004, a stratified random sample of 6,175 respon-dents was selected from approximately 600,000 householdspreviously recruited to participate in a consumer marketingsurvey. In return for their participation, respondents were givensmall gifts (e.g., a 20-minute calling card) and entered into asweepstakes drawing. Of the 6,175 households contacted bymail, 4,345 (70.4%) returned the survey. Survey data wereweighted to match the 2003 Current Population Surveyestimates relative to age, race/ethnicity, sex, income, andhousehold size.
The survey included the following twogeneral questions related to family history:1) “How important do you think knowl-edge of your family’s health history is toyour personal health?” (possible responseswere “very important,” “somewhat impor-tant,” “not at all important,” or “not sure”)and 2) “Have you ever actively collectedheath information from your relatives forpurposes of developing a family health his-tory?” The likelihood of collecting a familyhealth history was evaluated in relation topersonal characteristics by using a multi-variable logistic regression model. In addi-tion, the 2004 HealthStyles Survey had aspecial focus on type 2 diabetes, so fivequestions were included to assess family his-tory of this condition: 1) “Has your motherever been diagnosed with type 2 diabetes?”2) “Has your father ever been diagnosedwith type 2 diabetes?” 3) “How many ofyour brothers and sisters were diagnosedwith type 2 diabetes?” 4) “How many ofyour mother’s relatives (her sisters, broth-ers, and parents) were diagnosed with type2 diabetes?” and 5) “How many of yourfather’s relatives (his sisters, brothers, andparents) were diagnosed with type 2 diabe-tes?” Knowledge of family history of type2 diabetes was assessed by comparing “yes”or “no” responses with “don’t know”responses.
Of the 4,345 respondents, 3,063 (70.5%) were non-Hispanic whites and 3,012 (69.3%) were aged 18–54 years;2,732 (62.9%) had at least some college education, and 3,395(78.1%) reported ever being married (Table). Slightly morethan half of all respondents were female (2,246; 51.7%) andreported annual incomes >$40,000 (2,355; 54.2%). Almostall of the respondents (4,183; 96.3%) considered knowledgeof family history either very important (3,151; 72.5%) orsomewhat important (1,032; 23.8%) to their personal health.Women were slightly more likely than men to report that fam-ily history was very important to their own health; equal pro-portions of men and women considered family historysomewhat important. Respondents who had a high schooleducation or less or who were aged >55 years were less likelyto report that family history was important for their own
TABLE. Number and percentage of survey respondents* who actively collected healthinformation on relatives to develop a family health history, by selected characteristics —HealthStyles Survey, United States, 2004
No. ofrespondents
who collectedNo. of family health Odds
Characteristic respondents information (%) ratio† (95% CI§)
Personal history oftype 2 diabetesNo 3,851 1,124 (29.2) 1.00 (ref)Yes 419 156 (37.2) 1.53 (1.22–1.93)
* N = 4,345.†
Multivariate logistic regression model included the following variables: sex, race/ethnicity, age, mari-tal status, education, income, and personal history of type 2 diabetes. All variables were weighted tomatch 2003 Current Population Survey estimates relative to age, race/ethnicity, sex, income, andhousehold size.
§Confidence interval.
¶Reference value.
1046 MMWR November 12, 2004
health. Although the majority of respondents reported thatfamily history was important, substantially fewer persons(1,296; 29.8%) reported actively collecting information todevelop a family health history (Figure). Those who had col-lected a family health history were more likely to be female,previously or currently married, and to have more than a highschool education. Respondents with a personal history of type2 diabetes were also more likely to have collected health infor-mation from their relatives (Table).
Respondents’ knowledge of family history of type 2 diabe-tes varied by type of relative (Figure). Moreover, more respon-dents reported knowing the type 2 diabetes status of theirsiblings (94.5%) and mother (91.2%) than of their father(87.8%; p<0.0001). Similarly, a greater percentage of respon-dents reported knowing the type 2 diabetes status of maternalrelatives (77.0%) than paternal relatives (70.4%; p<0.0001).Non-Hispanic white race/ethnicity and higher education andincome levels were positively associated with knowledge offamily history of type 2 diabetes.Reported by: PW Yoon, ScD, MT Scheuner, MD, M Gwinn, MD,MJ Khoury, MD, PhD, Office of Genomics and Disease Prevention;C Jorgensen, DrPH, Div of Cancer Prevention and Control, NationalCenter for Chronic Disease Prevention and Health Promotion; S Hariri,PhD, S Lyn, MD, EIS officers, CDC.
Editorial Note: The findings in this report indicate that 96.3%of respondents considered knowledge of family historyimportant to their personal health and that 70.0%–94.5%could report the type 2 diabetes status of their relatives,depending on the type of relative. However, only 29.8%
reported actively collecting health information from their rela-tives to develop a family health history. This suggests that manypersons know their family health histories but are not activelycollecting the information. The analysis also suggests that cer-tain population characteristics (e.g., sex, race, education, andsocioeconomic status) might affect attitudes, knowledge, andpractices regarding family health history.
The findings of this analysis are subject to at least two limi-tations. First, the HealthStyles Survey is subject to selectionbias because the survey population is not a randomly drawnsample of the U.S. population. The results from this surveyshould be compared with data from population-based sur-veys, such as the Behavioral Risk Factor Surveillance Systemsurvey (6). Second, the assessment of awareness of disease sta-tus among relatives was limited to type 2 diabetes. Familyhistory of other common diseases (e.g., cardiovascular diseasesand cancer) should be assessed.
Most diseases are the result of complex interactions betweengenetic and environmental factors (7). Family health historyreflects these interactions and helps predict risk for certaindisorders, including birth defects, asthma, cardiovascular dis-ease, cancer, diabetes, depression, Alzheimer’s disease, andosteoporosis (1,8) For example, an evaluation of the risk forcoronary heart disease (CHD) using a high school–based fam-ily history project determined that family history of CHDand stroke was identified in only 14% and 11% of families,respectively; however, these families accounted for 72% of allearly-onset CHD and 86% of early stroke events (9).
Although family history can identify persons at increasedrisk for disease, its potential as a screening tool has not beenrealized in clinical and public health practice (2). An observa-tional study of primary care physicians indicated that familyhistories were discussed about half the time at new visits and22% of the time during follow-up visits (10). The averageduration of the family history discussion was 2.5 minutes andfocused more often on psychosocial concerns than on otherhealth matters. To improve the use of family history in theclinical setting, the barriers to providers’ collection and inter-pretation of a family history must be addressed.
The Department of Health and Human Services is high-lighting the importance of family history for disease preven-tion with the U.S. Surgeon General’s Family History Initiative.This initiative has proposed that Thanksgiving Day be desig-nated a National Family History Day in which persons col-lect their family health histories. A new web-based tool, MyFamily Health Portrait (http://www.hhs.gov/familyhistory),
FIGURE. Percentage of respondents* reporting importance offamily history to their personal health, knowledge of familyhistory of type 2 diabetes, and collection of family historyinformation — HealthStyles Survey, United States, 2004
* N = 4,345.†
Family history of type 2 diabetes.
VeryImportant
SomewhatImportant
0
10
20
30
40
50
60
70
80
90
100
Importance offamily history
Knowledge of familyhistory for mother,father, or siblings
†Knowledge of familyhistory for maternalor paternal relatives
enables persons to collect family history for six diseases (CHD,stroke, diabetes, and colorectal, breast, and ovarian cancer)and identify additional diseases that occur in their families.After the family history information is completed, a report isgenerated that includes a pedigree drawing, a listing of thefamily history data entered, and a statement about the impor-tance of sharing the history with their health-care providers.My Family Health Portrait is based on a self-administered toolbeing developed by CDC that will enable collection of familyhealth history and provide recommendations tailored to thelevel of familial risk. In 2005, the CDC tool will be evaluatedin clinical settings. Information about the tool can be foundat http://www.cdc.gov/genomics/activities/ogdp/2003/chap06.htm.
Although national efforts have begun to promote the col-lection and use of family history information, the HealthStylesSurvey data presented in this report suggest that certain sub-groups of the population might benefit from targeted pro-grams to raise awareness about the collection and recordingof family health histories.References1. Bennett RL. The practical guide to the genetic family history. New
York, NY: John Wiley & Sons, Inc.; 1999.2. Rich EC, Burke W, Heaton CJ, et al. Reconsidering the family history
in primary care. J Gen Inter Med 2004;19:273–80.3. Yoon PW, Scheuner MT, Khoury MJ. Research priorities for evaluat-
ing family history in the prevention of common chronic diseases. AmJ Prev Med 2003;24:128–35.
4. National Coalition for Health Professional Education in Genetics.Genetic family history resources. Lutherville, MD: National Coali-tion for Health Professional Education in Genetics; 2004. Available athttp://www.nchpeg.org.
5. Pollard WE. Use of consumer panel survey data for public health com-munication planning: an evaluation of survey results. American Statis-tical Association Proceedings of the Section on Health Policy Statistics2002:2720–4.
6. Balluz L, Ahluwalia IB, Murphy W, Mokdad A, Giles W, Harris VB.Surveillance for certain health behaviors among selected local areas—United States, Behavioral Risk Factor Surveillance System, 2002.MMWR 2004;53(No. SS-5).
7. Khoury MJ. Genetic epidemiology. In: Rothman KJ , Greenland S,eds. Modern epidemiology. Philadelphia, PA: Lippincott-Raven; 1998.
8. Scheuner MT, Wang SJ, Raffel LJ, Larabell SK, Rotter JI. Family his-tory: a comprehensive genetic risk assessment method for the chronicconditions of adulthood. Am J Med Genet 1997;71:315–24.
9. Hunt SC, Gwinn M, Adams TD. Family history assessment: strategiesfor prevention of cardiovascular disease. Am J Prev Med 2003;24:136–42.
10. Acheson LS, Wiesner GL, Zyzanski SJ, Goodwin MA, Stange KC.Family history-taking in community family practice: implications forgenetic screening. Genet Med 2000;2:180–5.
Preventive-Care Practices AmongAdults with Diabetes —Puerto Rico, 2000–2002
Preventive-care practices among persons with diabetes canprevent or delay complications such as eye disease, kidney dis-ease, or nerve damage that is a precursor to disabling footdisease (1,2). However, the level of diabetes-related preven-tive care is inadequate in the United States (3–6), and littlehas been reported about preventive care in Puerto Rico, wherean estimated 10% of adults have diagnosed diabetes (7). CDCanalyzed data from 2000, 2001, and 2002 Behavioral RiskFactor Surveillance System (BRFSS) surveys to assess the per-centage of adults with diabetes in Puerto Rico who engagedin five selected preventive-care practices. This report summa-rizes the results of that analysis, which indicated that, withthe exception of hemoglobin A1c testing, the percentages ofadults engaging in preventive-care practices were lower thanthe target percentages* set by U.S. national health objectivesfor 2010 (8).
BRFSS conducts state-based, random-digit–dialed telephonesurveys of the U.S. civilian, noninstitutionalized populationaged >18 years in all 50 states, the District of Columbia, PuertoRico, and other U.S. territories. For this analysis, respondentswere considered to have diabetes if they answered “yes” to thequestion, “Has a doctor ever told you that you have diabe-tes?” Women who were told they had diabetes, but only dur-ing pregnancy, were classified as not having diabetes. Personswho reported they had diabetes were asked questions fromthe BRFSS diabetes module on preventive-care practices,including: “About how many times in the past 12 months hasa health professional checked you for hemoglobin A1c?”“When was the last time you had an eye exam in which thepupils were dilated?” “About how many times in the last yearhas a health professional checked your feet for any sores orirritations?” “Have you ever taken a course in how to manageyour diabetes yourself?” and “About how often do you checkyour blood for glucose or sugar?”
The response rate to the BRFSS survey in Puerto Rico was65.3% in 2000, 81.5% in 2001, and 75.2% in 2002. Datawere aggregated for 2000–2002 to obtain reliable estimates
* Hemoglobin A1c testing at least twice a year, 65% (objective 5-12†); annualdilated eye examination, 75% (objective 5-13); annual foot examination, 75%(objective 5-14); ever having education on diabetes self-management, 60%(objective 5-1); and self-monitoring of blood glucose at least once daily, 60%(objective 5-17).
† Objective 5-12 was revised since its original publication.
TABLE. Percentage of adults with diabetes who engaged in a preventive-care practice, by age group, sex, and practice —Behavioral Risk Factor Surveillance System, Puerto Rico, 2000–2002
Education Self-monitoringHemoglobin Dilated on diabetes of blood A1c testing* eye examination Foot examination self-management glucose (SMBG)
* At least twice a year for hemoglobin A1c testing, annually for dilated eye and foot examinations, ever for education on diabetes self-management, and atleast daily for self-monitoring of blood glucose.
†Confidence interval.
§Age-adjusted to the 2000 U.S. standard population.
FIGURE 1. Percentage* of adults with diabetes who engagedin each of five preventive-care practices, compared withpercentage targeted by national health objectives for 2010 —Behavioral Risk Factor Surveillance System, Puerto Rico,2000–2002
* Age-adjusted to the 2000 U.S. standard population.†
National health objective.
0
20
40
60
80
100
Hemoglobin A1ctesting at least
twice a year
Annualdilated eye
examination
Annualfoot
examination
Education ondiabetes self-management
Daily self-monitoring ofblood glucose
Per
cent
age
Preventive-care practice
60%60%
75%
65%
75%
†
and weighted to reflect the age and sex distribution of thePuerto Rican population. The percentages of persons withdiabetes who engaged in each of the five preventive-care prac-tices as frequently as recommended (i.e., hemoglobin A1c test-ing at least twice a year, eye and foot examinations at leastannually, formal diabetes education ever, and self-monitoringof blood glucose [SMBG] at least daily) were age-adjusted tothe 2000 U.S. standard population for comparison with U.S.national health objectives for 2010 (8). Percentages were cal-culated for specific age and sex groups, and a t-test was per-formed to determine whether differences between groups werestatistically significant. In addition, the total number of pre-ventive-care practices per person was examined. For all analy-ses, statistical software was used to obtain standard errors andcalculate 95% confidence intervals (CIs).
During 1998–2002, 10.0% of adults in Puerto Rico haddiagnosed diabetes; prevalence was highest (25.3%) amongthose aged >65 years (7). However, during 2000–2002, thepercentages of adults with diabetes in Puerto Rico whoengaged in preventive-care practices as frequently as recom-mended, with the exception of hemoglobin A1c testing, werelower than U.S. national health objectives for 2010 (Figure 1).The age-adjusted percentage for hemoglobin A1c testing atleast twice a year was 67.3%, compared with the national tar-get of 65%. Age-adjusted percentages for annual eye and footexaminations were 54.6% and 45.6%, respectively, versus thetarget of 75% for both practices; percentages for ever havingreceived diabetes self-management education and for dailySMBG were 28.1% and 22.6%, respectively, versus a nationaltarget of 60% for both.
The percentage of adults receiving A1c testing at least twicea year was higher than the U.S. national target for 2010 forboth men (69.0%) and women (65.7%) and for persons aged18–64 years and those aged >65 years; however, the percent-
age was significantly lower in the 18–64 age group (65.5%versus 76.2%; p<0.05) (Table). The percentage who receivedannual foot examinations also was significantly lower amongthose aged 18–64 years than among those aged >65 years(43.8% versus 54.6%; p<0.05). However, for the other threepreventive-care practices, no significant differences by agewere observed. For all of the practices, the percentages formen and women were similar.
Of the five preventive-care practices analyzed, 63.0% ofadults with diabetes in Puerto Rico reported engaging in twoor fewer practices, and 13.5% reported engaging in no pre-ventive-care practices (Figure 2). A total of 37.0% of adultsreported engaging in three or more practices, and 3.3%reported engaging in all five.
Vol. 53 / No. 44 MMWR 1049
FIGURE 2. Percentage of adults with diabetes who engagedin 0–5 preventive-care practices — Behavioral Risk FactorSurveillance System, Puerto Rico, 2000–2002
0
5
10
15
20
25
30
0 1 2 3 4 5
Number
Per
cent
age
something yet to learn.""The wisest mind has
MMWR Continuing Education
makes it possible for you to stay
current on relevant public health
and clinical topics– online and
at no charge.
Review course descriptions,
take exams, track your results,
and receive course certificates–
all from your own computer,
when and where your sche-
dule allows.
MMWR CE
A wise choice.
cdc.gov/mmwr
George Santayana
ContinuingEducation
Reported by: Z Kianes-Pérez, MS, M Pérez-Padua, L Pérez-Rivera,MPHE, Diabetes Prevention and Control Program, Puerto Rico Deptof Health. NR Burrows, MPH, RV Díaz-Kenney, MPH, LS Geiss, MA,Div of Diabetes Translation, National Center for Chronic DiseasePrevention and Health Promotion, CDC.
Editorial Note: Effective interventions are available that canprevent or delay diabetes complications (1,2). Consistent withprevious reports of diabetes-related preventive care in theUnited States (3–6), the findings in this report indicate thatthe percentages of adults with diabetes in Puerto Rico whoengage in preventive-care practices, with the exception of A1ctesting, were lower than U.S. national health targets for 2010.Fewer than 5% of adults with diabetes engaged in all five prac-tices. Improvement in diabetes care, particularly in self-man-agement education and in SMBG, is needed to achieve theU.S. national health objectives for 2010 and to reduce diabe-tes complications. In addition, younger persons with diabetesneed interventions to improve their preventive care.
The findings in this report are subject to at least three limi-tations. First, BRFSS collects data through telephone surveysthat do not include institutionalized persons (e.g., nursinghome residents) or persons without telephones. As a result,the percentages of persons with diabetes who engaged in pre-ventive-care practices in this report might be higher thanthe actual percentages because persons without telephones aremore likely to have lower levels of education and less likely toreceive preventive care (3–6). Second, self-reported data aresubject to recall bias, and the effect of this bias on the magni-tude and direction of the results is unknown. Such bias mightcause preventive-care practices to be either under- oroverreported. Finally, BRFSS response rates in Puerto Ricoranged from 65.3% to 81.5% during the study period; how-ever, compared with census data, BRFSS data have minimalbias (9).
1050 MMWR November 12, 2004
Since 1997, CDC has provided funding to the DiabetesPrevention and Control Program (DPCP) in Puerto Rico.DPCP adapted the Spanish version of CDC’s train-the-trainerprogram, Diabetes Today (La Comunidad en Acción), to thePuerto Rican culture; the program is used to guide health pro-fessionals and community leaders in training lay health work-ers (promotores), improving diabetes self-management, andpreventing diabetes complications. DPCP also develops pro-tocols for standards of care and diabetes education materials,sponsors mass media and face-to-face educational campaignsfocused on diabetes prevention and control, and collaborateswith the Puerto Rico Diabetes Advisory Council and com-munity-based organizations to improve diabetes care.
DPCP implemented the Puerto Rico Diabetes SurveillanceSystem by using data from the BRFSS diabetes module andinformation from health insurance companies on diabetes, itscomplications, and use of health-care services. The BRFSSdiabetes module is also used to evaluate program objectivesand activities. Continued surveillance is essential to monitorthe effectiveness of measures to improve levels of preventive-care practices among persons with diabetes in Puerto Rico.References1. UK Prospective Diabetes Study Group. Intensive blood-glucose control
with sulphonylureas or insulin compared with conventional treatmentand risk of complications in patients with type 2 diabetes (UKPDS 33).Lancet 1998;352:839–55.
2. Narayan KM, Gregg EW, Fagot-Campagna A, Engelgau MM, Vinicor F.Diabetes—a common, growing, serious, costly, and potentially prevent-able public health problem. Diabetes Res Clin Pract 2000;50(Suppl 2):S77–84.
3. CDC. Preventive-care practices among persons with diabetes—UnitedStates, 1995 and 2001. MMWR 2002;51:965–9.
4. Saaddine JB, Engelgau MM, Beckles GL, Gregg EW, Thompson TJ,Venkat Narayan KM. A diabetes report card for the United States: qual-ity of care in the 1990s. Ann Intern Med 2002;136:565–74.
5. CDC. Levels of diabetes-related preventive-care practices—United States,1997–1999. MMWR 2000;49:954–8.
6. Beckles GL, Engelgau MM, Narayan KM, Herman WH, Aubert RE,Williamson DF. Population-based assessment of the level of care amongadults with diabetes in the U.S. Diabetes Care 1998;21:1432–8.
7. CDC. Prevalence of diabetes among Hispanics—selected areas, 1998–2002. MMWR 2004;53:941–4.
8. US Department of Health and Human Services. Healthy people 2010(conference ed, in 2 vols). Washington, DC: US Department of Healthand Human Services; 2000. Available at http://www.health.gov/healthypeople.
9. Nelson DE, Holtzman D, Bolen J, Stanwyck CA, Mack KA. Reliabilityand validity of measures from the Behavioral Risk Factor SurveillanceSystem (BRFSS). Social Prev Med 2001;46:S3–S42.
West Nile Virus Activity —United States, November 3–8, 2004During November 3–8, a total of 41 cases of human West
Nile virus (WNV) illness were reported from seven states(California, Maryland, Minnesota, New Mexico, Oregon,Tennessee, and Texas).
During 2004, 40 states and the District of Columbia (DC)have reported 2,282 cases of human WNV illness to CDCthrough ArboNET (Figure and Table). Of these, 737 (32%)cases were reported in California, 381 (17%) in Arizona, and276 (12%) in Colorado. A total of 1,318 (59%) of the 2,251cases for which such data were available occurred in males;the median age of patients was 52 years (range: 1 month–99years). Date of illness onset ranged from April 23 to October31; a total of 77 cases were fatal.
A total of 195 presumptive West Nile viremic blood donors(PVDs) have been reported to ArboNET in 2004. Of these,68 (35%) were reported in California; 38 (19%) in Arizona;16 in Texas; 15 in New Mexico; seven in Colorado; six each inLouisiana and Oklahoma; five in Nevada; four in Georgiaand Iowa; three each in Florida, Michigan, and South Dakota;two each in Minnesota, Mississippi, Missouri, and Wiscon-sin; and one each in Delaware, Kentucky, Maryland, Nebraska,New Jersey, New York, North Dakota, Oregon, and Pennsyl-vania. Of the 195 PVDs, three persons aged 35, 69, and 77years subsequently had neuroinvasive illness, and 48 persons(median age: 52 years; range: 17–73 years) subsequently hadWest Nile fever.
FIGURE. Areas reporting West Nile virus (WNV) activity —United States, 2004*
* As of 3 a.m., Mountain Standard Time, November 8, 2004.
Total 809 935 538 2,282 77* As of November 8, 2004.† Cases with neurologic manifestations (i.e., West Nile meningitis, West
Nile encephalitis, and West Nile myelitis).§ Cases with no evidence of neuroinvasion.¶ Illnesses for which sufficient clinical information was not provided.
** Total number of human cases of WNV illness reported to ArboNet bystate and local health departments.
Arizona and Wyoming; and 14 unidentified animal species innine states (Arizona, Idaho, Illinois, Iowa, Kentucky, Missouri,Nevada, New York, and South Carolina). WNVseroconversions have been reported in 1,409 sentinel chickenflocks in 14 states (Alabama, Arizona, Arkansas, California,Delaware, Florida, Iowa, Louisiana, Nebraska, Nevada, NorthCarolina, Pennsylvania, South Dakota, and Utah) and in 25wild hatchling birds in Missouri and Ohio. Four seropositivesentinel horses were reported in Minnesota and Puerto Rico.A total of 8,131 WNV-positive mosquito pools have beenreported in 38 states, DC, and New York City.
Additional information about national WNV activity isavailable from CDC at http://www.cdc.gov/ncidod/dvbid/westnile/index.htm and at http://westnilemaps.usgs.gov.
Notice to Readers
Maps of National, State, and County DataNow Available on CDC WONDER
Two CDC online data-access systems, WONDER (Wide-ranging Online Data for Epidemiologic Research) andGATHER (Geographic Analysis Tool for Health and Envi-ronmental Research), have collaborated to produce maps forWONDER data-query applications. WONDER users cannow create maps for each data element measured, selectquantiles or set custom break-points for data groups, choosewhether to display highways and rivers, add labels, and choosea color scheme. Maps are available for the following WON-DER data requests:
• census population estimates (http://wonder.cdc.gov/censj.html)
• bridged-race population estimates (http://wonder.cdc.gov/bridged-racej.html)
• natality (births) (http://wonder.cdc.gov/nataj.html)Mapping capability will eventually be available for other data-query applications with location data elements.
WONDER (available at http://wonder.cdc.gov) is anInternet system that makes CDC information resources andpublic health information available to public health profes-sionals and the general public. GATHER (available at http://gis.cdc.gov/atsdr/default.asp) uses spatial analysis tools forpublic health applications, and is a product of CDC’s Geo-graphic Research, Analysis, and Services Program of theNational Center for Environmental Health/Agency for ToxicSubstances and Disease Registry.
In addition, 5,562 dead corvids and 1,401 other dead birdswith WNV infection have been reported from 46 states andNew York City during 2004. WNV infections have beenreported in horses in 37 states; one bat in Wisconsin; ninedogs in Nevada, New Mexico, and Wisconsin; six squirrels in
Guidance on Initial Responses toSuspicious Letters and Packages
Law enforcement agencies and emergency responders arecharged with investigation of suspicious letters and packagesin the United States. Those responding are at risk frompotential exposure to biologic agents, chemical substances, or
radiologic materials. Guidelines for responding to five differ-ent types of situations (e.g., letter with unknown powder-likesubstance and threatening communication) have been devel-oped by the Federal Bureau of Investigation, Department ofHomeland Security, and Department of Health andHuman Services/CDC. This guidance is now available athttp://www.bt.cdc.gov/planning/pdf/suspicious-package-biothreat.pdf.
* No rubella cases were reported for the current 4-week period yielding a ratio for week 44 of zero (0).† Ratio of current 4-week total to mean of 15 4-week totals (from previous, comparable, and subsequent 4-week periods for the past 5 years). The point where the hatched area
begins is based on the mean and two standard deviations of these 4-week totals.
-: No reported cases.* Incidence data for reporting years 2003 and 2004 are provisional and cumulative (year-to-date).†
Not notifiable in all states.§
Updated weekly from reports to the Division of Vector-Borne Infectious Diseases, National Center for Infectious Diseases (ArboNet Surveillance).¶
Updated monthly from reports to the Division of HIV/AIDS Prevention — Surveillance and Epidemiology, National Center for HIV, STD, and TB Prevention.Last update September 26, 2004.
** Updated weekly from reports to the Division of Viral and Rickettsial Diseases, National Center for Infectious Diseases.††
Of 23 cases reported, 10 were indigenous, and 13 were imported from another country.§§
Of 51 cases reported, 31 were indigenous, and 20 were imported from another country.¶¶
Not previously notifiable.
TABLE I. Summary of provisional cases of selected notifiable diseases, United States, cumulative, week ending November 6, 2004 (44th Week)*
Cum. Cum. Cum. Cum.2004 2003 2004 2003
FIGURE I. Selected notifiable disease reports, United States, comparison of provisional 4-week totals November 6, 2004, withhistorical data
DISEASE DECREASE INCREASECASES CURRENT
4 WEEKS
Ratio (Log scale)†
Beyond historical limits
4210.50.250.125
216
302
42
79
1
37
12
760
0
Hepatitis A, acute
Hepatitis B, acute
Hepatitis C, acute
Legionellosis
Measles, total
Mumps
Pertussis
Rubella
Meningococcal disease
0.06250.03125
*
Anthrax - - HIV infection, pediatric†¶ 126 179Botulism: - - Influenza-associated pediatric mortality** - NA
N: Not notifiable. U: Unavailable. -: No reported cases. C.N.M.I.: Commonwealth of Northern Mariana Islands.* Incidence data for reporting years 2003 and 2004 are provisional and cumulative (year-to-date).† Chlamydia refers to genital infections caused by C. trachomatis.§ Updated weekly from reports to the Division of Vector-Borne Infectious Diseases, National Center for Infectious Diseases (ArboNet Surveillance).¶ Updated monthly from reports to the Division of HIV/AIDS Prevention — Surveillance and Epidemiology, National Center for HIV, STD, and TB Prevention. Last update
September 26, 2004.** Contains data reported through National Electronic Disease Surveillance System (NEDSS).
TABLE II. Provisional cases of selected notifiable diseases, United States, weeks ending November 6, 2004, and November 1, 2003(44th Week)*
Encephalitis/MeningitisAIDS Chlamydia† Coccidiodomycosis Cryptosporidiosis West Nile§
Guam 2 5 - 527 - - - - - -P.R. 595 940 2,858 2,255 N N N N - -V.I. 10 31 272 351 - - - - - -Amer. Samoa U U U U U U U U U UC.N.M.I. 2 U 32 U - U - U - U
Vol. 53 / No. 44 MMWR 1055
N: Not notifiable. U: Unavailable. - : No reported cases.* Incidence data for reporting years 2003 and 2004 are provisional and cumulative (year-to-date).
TABLE II. (Continued) Provisional cases of selected notifiable diseases, United States, weeks ending November 6, 2004, and November 1, 2003(44th Week)*
Guam N N - - - - - 2 - 55P.R. - 1 - - - - 110 282 212 239V.I. - - - - - - - - 80 77Amer. Samoa U U U U U U U U U UC.N.M.I. - U - U - U - U 3 U
1056 MMWR November 12, 2004
N: Not notifiable. U: Unavailable. -: No reported cases.* Incidence data for reporting years 2003 and 2004 are provisional and cumulative (year-to-date).
TABLE II. (Continued) Provisional cases of selected notifiable diseases, United States, weeks ending November 6, 2004, and November 1, 2003(44th Week)*
Haemophilus influenzae, invasive Hepatitis
All ages Age <5 years (viral, acute), by type
All serotypes Serotype b Non-serotype b Unknown serotype ACum. Cum. Cum. Cum. Cum. Cum. Cum. Cum. Cum. Cum.
Guam - - - - - - - - - 2P.R. - 1 - - - - - 1 23 73V.I. - - - - - - - - - -Amer. Samoa U U U U U U U U U UC.N.M.I. - U - U - U - U - U
Vol. 53 / No. 44 MMWR 1057
N: Not notifiable. U: Unavailable. -: No reported cases.* Incidence data for reporting years 2003 and 2004 are provisional and cumulative (year-to-date).
TABLE II. (Continued) Provisional cases of selected notifiable diseases, United States, weeks ending November 6, 2004, and November 1, 2003(44th Week)*
Hepatitis (viral, acute), by typeB C Legionellosis Listeriosis Lyme disease
Guam - 9 - 5 - - - - - -P.R. 49 116 - - 1 - - - N NV.I. - - - - - - - - - -Amer. Samoa U U U U U U U U U UC.N.M.I. - U - U - U - U - U
1058 MMWR November 12, 2004
N: Not notifiable. U: Unavailable. - : No reported cases.* Incidence data for reporting years 2003 and 2004 are provisional and cumulative (year-to-date).
TABLE II. (Continued) Provisional cases of selected notifiable diseases, United States, weeks ending November 6, 2004, and November 1, 2003(44th Week)*
Guam - 1 - - - 1 - - - -P.R. - 2 7 9 6 4 53 65 N NV.I. - - - - - - - - - -Amer. Samoa U U U U U U U U U UC.N.M.I. - U - U - U - U - U
Vol. 53 / No. 44 MMWR 1059
N: Not notifiable. U: Unavailable. - : No reported cases.* Incidence data for reporting years 2003 and 2004 are provisional and cumulative (year-to-date).
TABLE II. (Continued) Provisional cases of selected notifiable diseases, United States, weeks ending November 6, 2004, and November 1, 2003(44th Week)*
Streptococcus pneumoniae, invasiveStreptococcal disease, Drug resistant,
Salmonellosis Shigellosis invasive, group A all ages Age <5 yearsCum. Cum. Cum. Cum. Cum. Cum. Cum. Cum. Cum. Cum.
PACIFIC 4,184 4,524 1,404 2,280 341 539 94 4 - -Wash. 488 494 96 147 53 56 - - N NOreg. 376 369 68 201 N N N N N NCalif. 2,945 3,410 1,191 1,883 183 369 N N N NAlaska 53 62 6 9 - - - - N NHawaii 322 189 43 40 105 114 94 4 - -
Guam - 40 - 33 - - - - - -P.R. 238 564 8 27 N N N N N NV.I. - - - - - - - - - -Amer. Samoa U U U U U U U U U UC.N.M.I. 3 U - U - U - U - U
1060 MMWR November 12, 2004
N: Not notifiable. U: Unavailable. - : No reported cases.* Incidence data for reporting years 2003 and 2004 are provisional and cumulative (year-to-date).
TABLE II. (Continued) Provisional cases of selected notifiable diseases, United States, weeks ending November 6, 2004, and November 1, 2003(44th Week)*
Guam - 1 - - - 48 - - - 121P.R. 138 182 5 14 84 95 - - 251 513V.I. 4 1 - - - - - - - -Amer. Samoa U U U U U U U U U UC.N.M.I. 2 U - U 10 U - U - U
Vol. 53 / No. 44 MMWR 1061
U: Unavailable. -:No reported cases.* Mortality data in this table are voluntarily reported from 122 cities in the United States, most of which have populations of >100,000. A death is reported by the place of its
occurrence and by the week that the death certificate was filed. Fetal deaths are not included.† Pneumonia and influenza.§ Because of changes in reporting methods in this Pennsylvania city, these numbers are partial counts for the current week. Complete counts will be available in 4 to 6 weeks.¶ Total includes unknown ages.
TABLE III. Deaths in 122 U.S. cities,* week ending November 6, 2004 (44th Week)All causes, by age (years) All causes, by age (years)
All P&I† All P&I†
Reporting Area Ages >65 45–64 25–44 1–24 <1 Total Reporting Area Ages >65 45–64 25–44 1–24 <1 Total
NEW ENGLAND 445 316 92 17 9 11 33Boston, Mass. 132 89 32 5 2 4 15Bridgeport, Conn. 29 20 5 4 - - 3Cambridge, Mass. 13 9 3 1 - - 1Fall River, Mass. 35 22 8 2 3 - 1Hartford, Conn. 72 48 17 5 2 - 4Lowell, Mass. 22 15 7 - - - 1Lynn, Mass. 15 11 3 1 - - -New Bedford, Mass. 24 20 3 - 1 - 1New Haven, Conn. U U U U U U UProvidence, R.I. U U U U U U USomerville, Mass. 2 2 - - - - -Springfield, Mass. 44 27 9 2 - 6 4Waterbury, Conn. 27 23 3 1 - - 2Worcester, Mass. 74 61 10 1 1 1 5
E.N. CENTRAL 1,230 860 258 64 21 27 91Akron, Ohio 60 43 11 5 - 1 13Canton, Ohio 39 29 7 3 - - 1Chicago, Ill. 315 194 78 27 6 10 24Cincinnati, Ohio 67 51 10 3 1 2 4Cleveland, Ohio 230 181 35 8 3 3 8Columbus, Ohio 188 117 50 11 6 4 12Dayton, Ohio U U U U U U UDetroit, Mich. 138 78 43 13 1 3 11Evansville, Ind. 35 24 9 - 2 - 2Fort Wayne, Ind. 62 52 9 - 1 - 6Gary, Ind. U U U U U U UGrand Rapids, Mich. 97 61 24 6 4 2 12Indianapolis, Ind. U U U U U U ULansing, Mich. U U U U U U UMilwaukee, Wis. 84 55 21 5 - 3 10Peoria, Ill. 49 34 11 4 - - 4Rockford, Ill. 68 42 19 4 1 2 4South Bend, Ind. 54 42 5 4 - 3 3Toledo, Ohio 108 85 15 2 2 4 5Youngstown, Ohio U U U U U U U
W.N. CENTRAL 440 293 98 25 18 6 20Des Moines, Iowa 53 40 7 4 2 - 3Duluth, Minn. U U U U U U UKansas City, Kans. U U U U U U UKansas City, Mo. 93 65 19 7 2 - 3Lincoln, Nebr. 29 21 5 2 - 1 1Minneapolis, Minn. U U U U U U UOmaha, Nebr. 84 63 19 1 1 - 8St. Louis, Mo. 84 46 26 5 6 1 1St. Paul, Minn. U U U U U U UWichita, Kans. 97 58 22 6 7 4 4
W.S. CENTRAL 783 495 186 62 21 19 33Austin, Tex. 77 52 14 4 2 5 2Baton Rouge, La. U U U U U U UCorpus Christi, Tex. 43 29 7 3 1 3 2Dallas, Tex. 218 126 56 26 7 3 12El Paso, Tex. 65 42 12 8 1 2 6Ft. Worth, Tex. 109 65 30 9 3 2 5Houston, Tex. 347 216 85 30 12 4 23Little Rock, Ark. U U U U U U UNew Orleans, La. 54 40 14 - - - -San Antonio, Tex. 252 162 57 21 9 3 22Shreveport, La. 86 51 24 3 5 3 6Tulsa, Okla. 131 90 29 9 2 1 -
MOUNTAIN 840 552 186 64 18 19 66Albuquerque, N.M. 114 80 27 4 2 1 10Boise, Idaho 52 29 14 4 3 2 4Colo. Springs, Colo. 65 47 11 5 2 - 4Denver, Colo. 105 59 24 14 4 4 12Las Vegas, Nev. 245 158 57 23 3 4 15Ogden, Utah 31 23 5 - - 3 1Phoenix, Ariz. 93 53 27 7 1 4 6Pueblo, Colo. 25 20 4 1 - - 4Salt Lake City, Utah 110 83 17 6 3 1 10Tucson, Ariz. U U U U U U U
PACIFIC 543 364 117 30 18 14 38Berkeley, Calif. 8 5 2 1 - - -Fresno, Calif. 66 49 12 4 - 1 7Glendale, Calif. 20 17 2 1 - - 1Honolulu, Hawaii 72 56 8 5 2 1 8Long Beach, Calif. 59 36 16 2 1 4 4Los Angeles, Calif. U U U U U U UPasadena, Calif. U U U U U U UPortland, Oreg. 129 88 25 11 2 3 13Sacramento, Calif. U U U U U U USan Diego, Calif. 162 107 34 12 5 4 14San Francisco, Calif. 115 63 36 15 1 - 12San Jose, Calif. U U U U U U USanta Cruz, Calif. 34 19 7 5 1 2 3Seattle, Wash. 89 61 21 2 3 2 4Spokane, Wash. 52 40 12 - - - 6Tacoma, Wash. 105 70 23 3 8 1 5
TOTAL 8,129¶ 5,389 1,828 529 206 172 518
MMWR
The Morbidity and Mortality Weekly Report (MMWR) Series is prepared by the Centers for Disease Control and Prevention (CDC) and is available free of chargein electronic format and on a paid subscription basis for paper copy. To receive an electronic copy each week, send an e-mail message to [email protected]. Thebody content should read SUBscribe mmwr-toc. Electronic copy also is available from CDC’s World-Wide Web server at http://www.cdc.gov/mmwr or from CDC’sfile transfer protocol server at ftp://ftp.cdc.gov/pub/publications/mmwr. To subscribe for paper copy, contact Superintendent of Documents, U.S. GovernmentPrinting Office, Washington, DC 20402; telephone 202-512-1800.
Data in the weekly MMWR are provisional, based on weekly reports to CDC by state health departments. The reporting week concludes at close of business onFriday; compiled data on a national basis are officially released to the public on the following Friday. Address inquiries about the MMWR Series, including materialto be considered for publication, to Editor, MMWR Series, Mailstop E-96, CDC, 1600 Clifton Rd., N.E., Atlanta, GA 30333; telephone 888-232-3228.
All material in the MMWR Series is in the public domain and may be used and reprinted without permission; citation as to source, however, is appreciated.
All MMWR references are available on the Internet at http://www.cdc.gov/mmwr. Use the search function to find specific articles.
Use of trade names and commercial sources is for identification only and does not imply endorsement by the U.S. Department of Health and Human Services.
References to non-CDC sites on the Internet are provided as a service to MMWR readers and do not constitute or imply endorsement of these organizations ortheir programs by CDC or the U.S. Department of Health and Human Services. CDC is not responsible for the content of these sites. URL addresses listed inMMWR were current as of the date of publication.
✩ U.S. Government Printing Office: 2005-733-116/00056 Region IV ISSN: 0149-2195


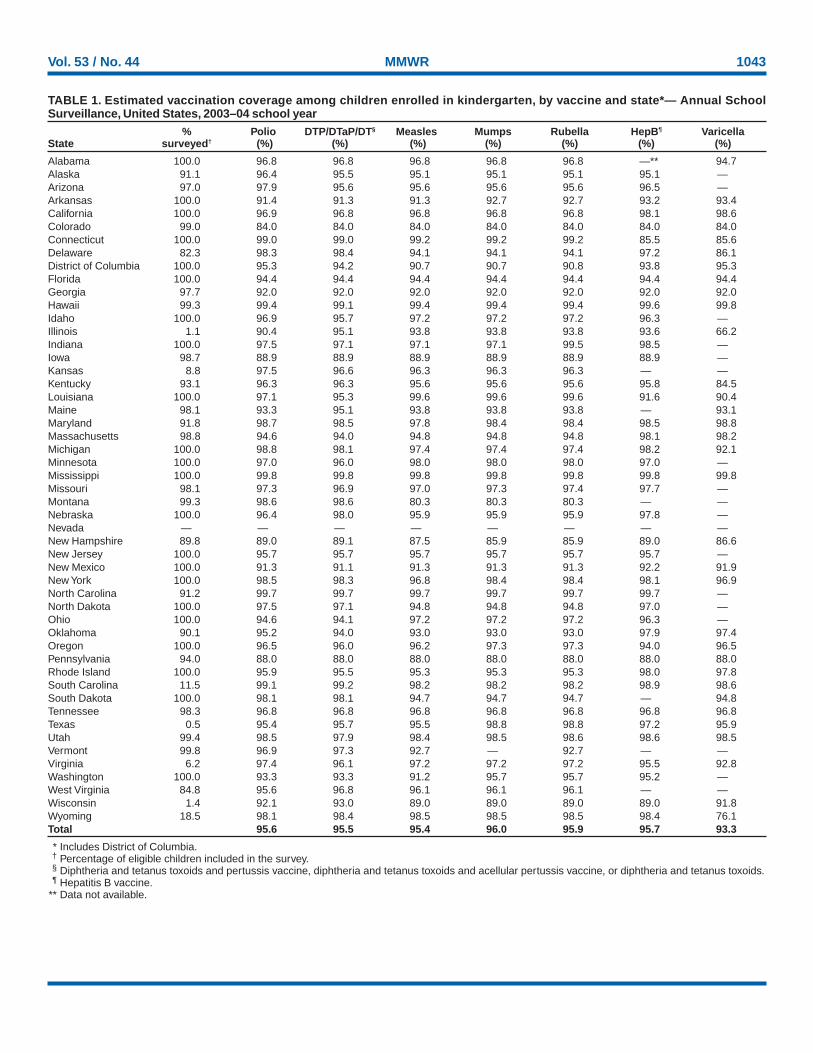


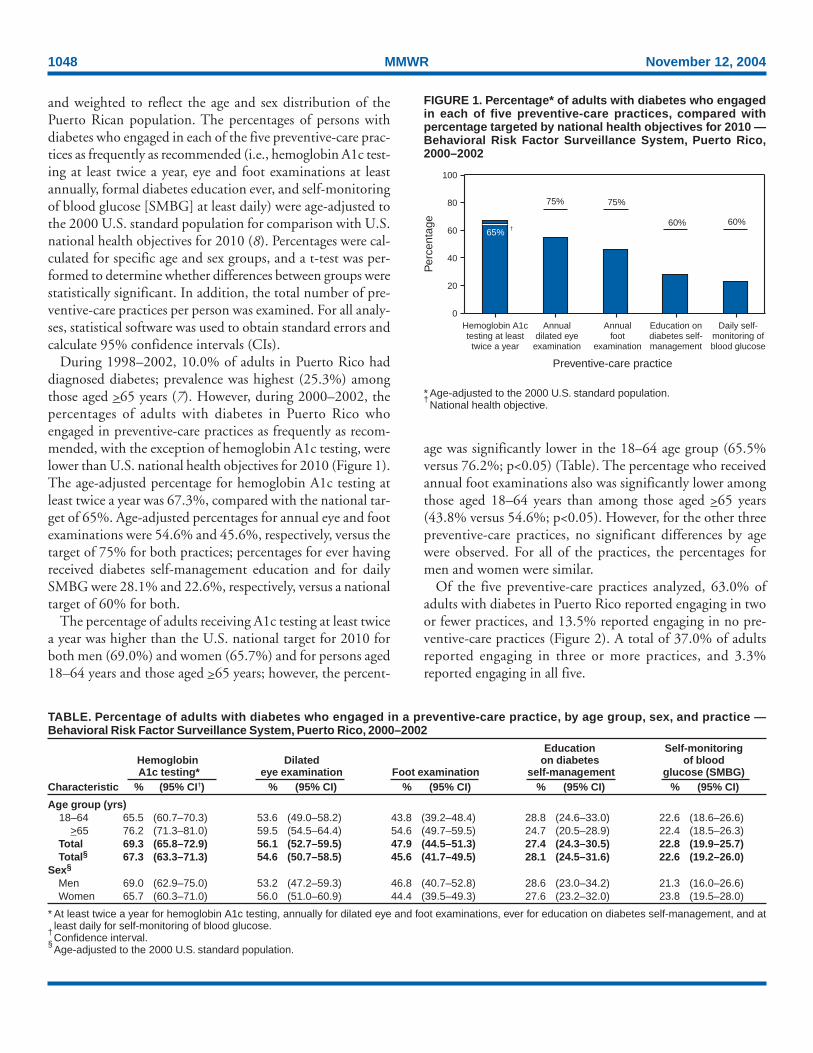
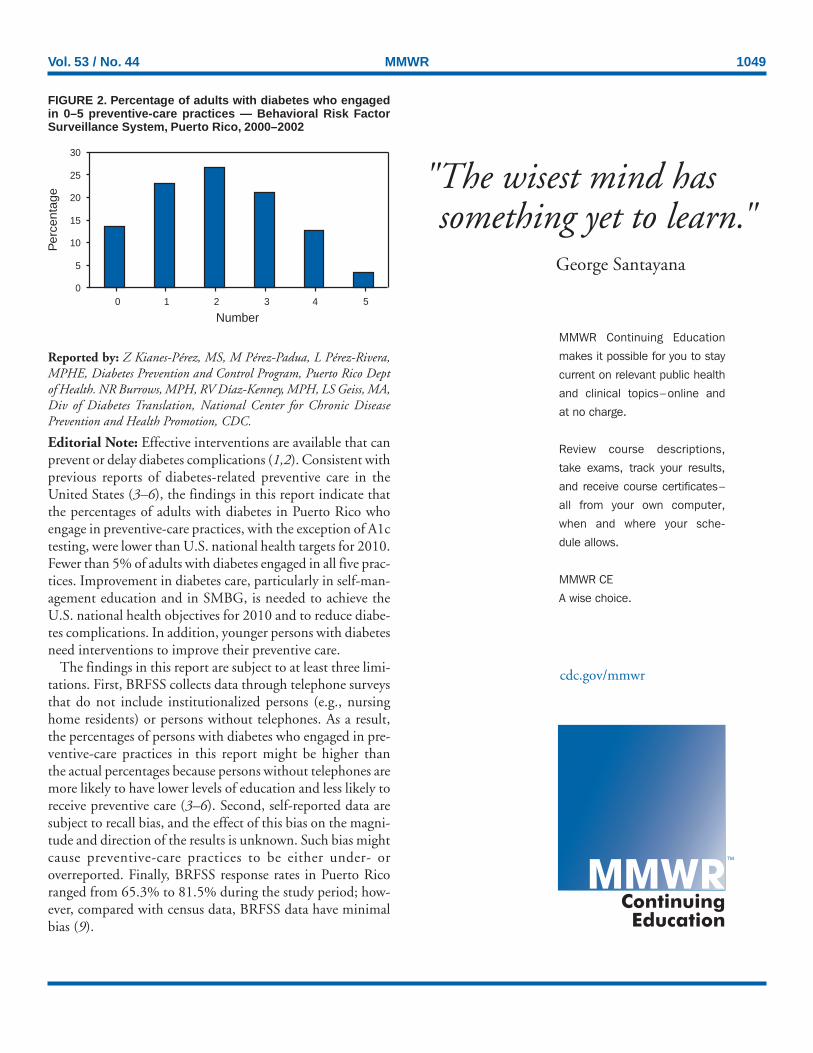
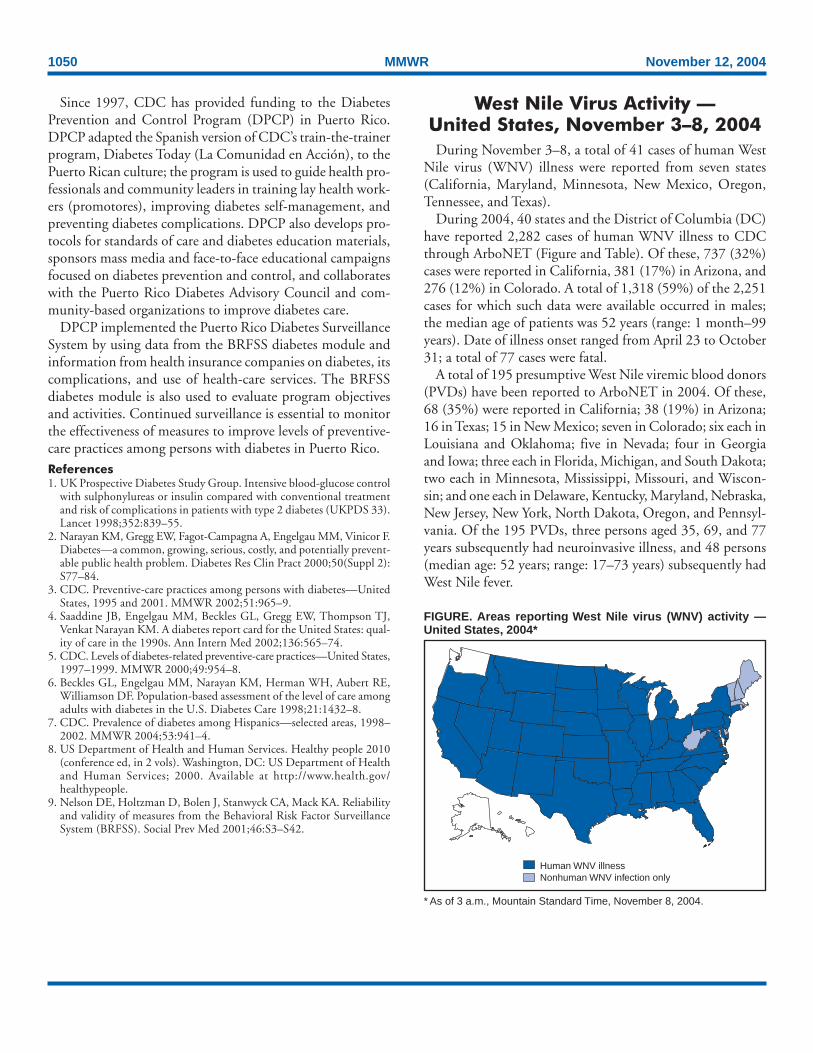


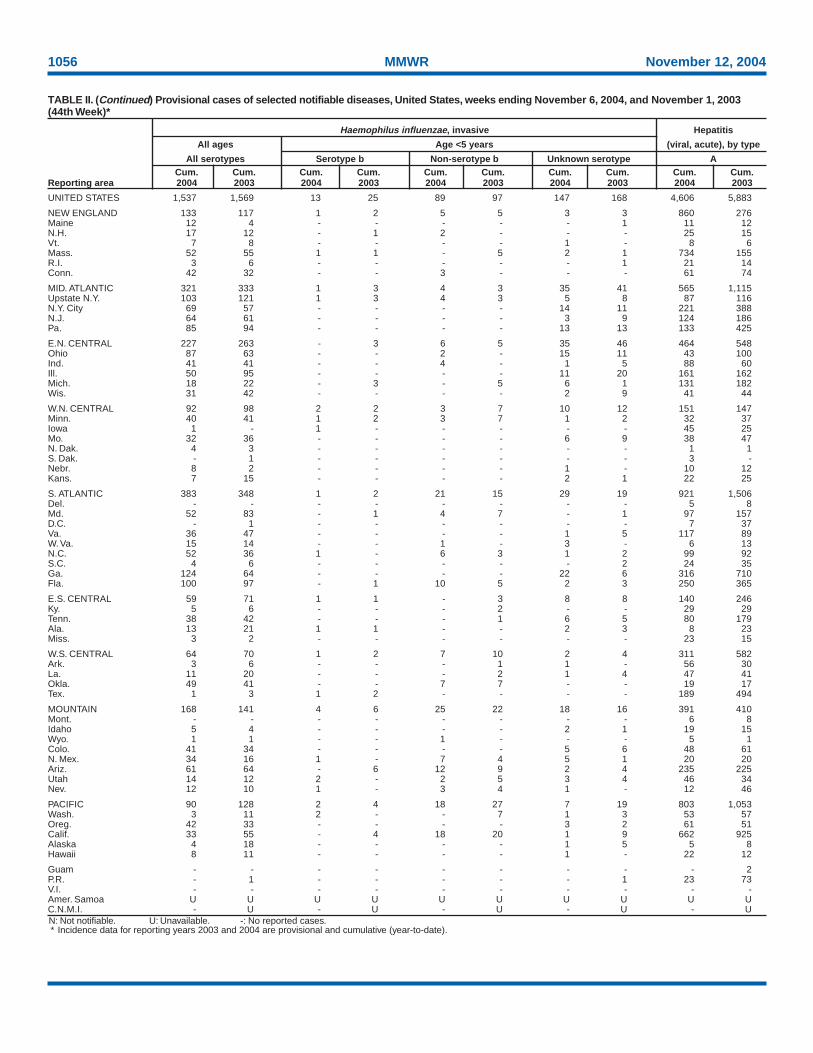
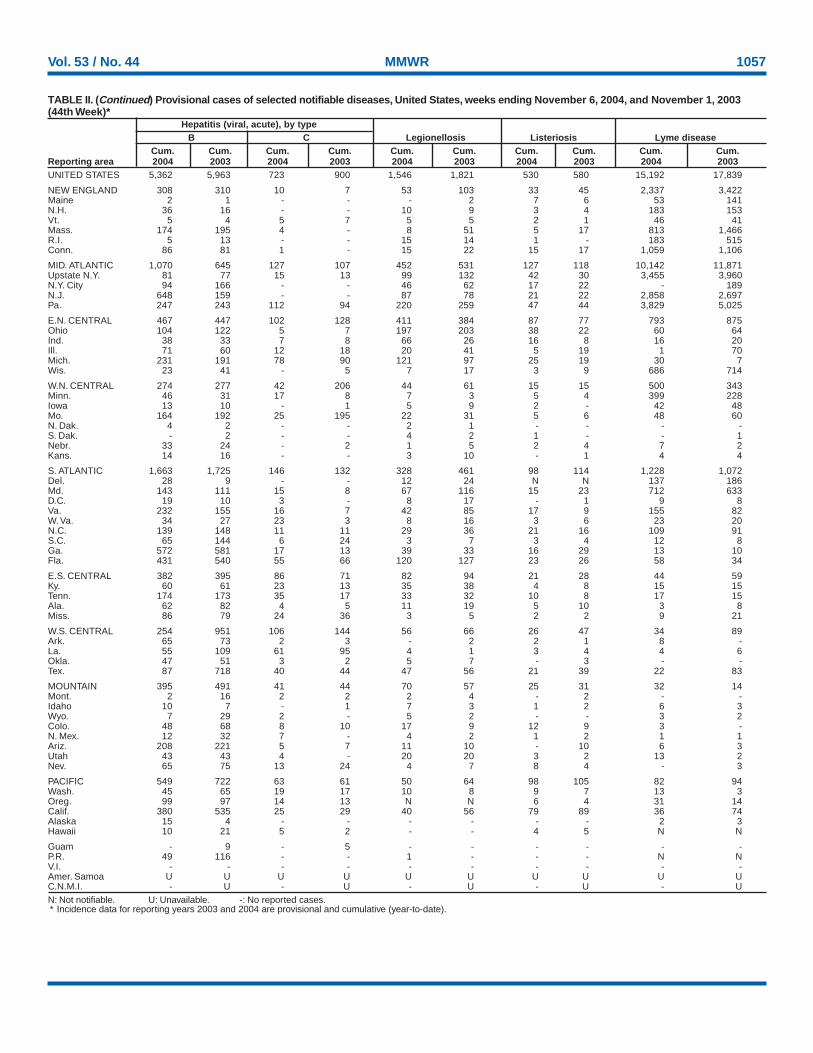

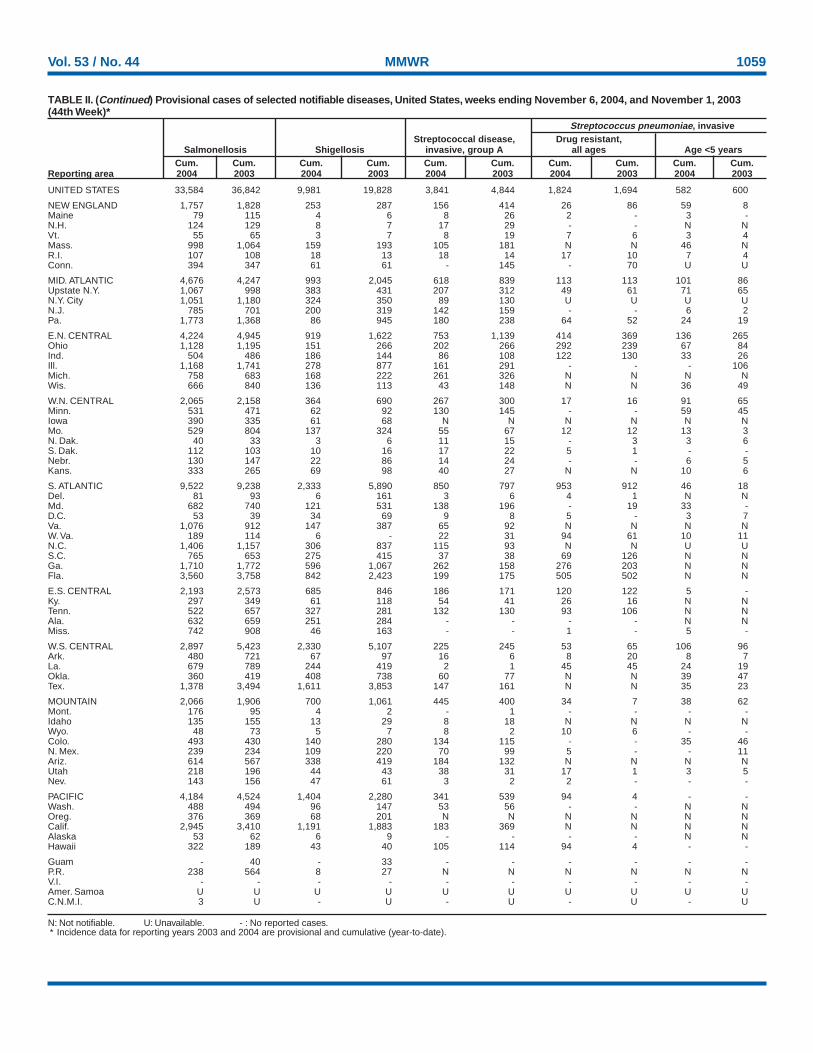
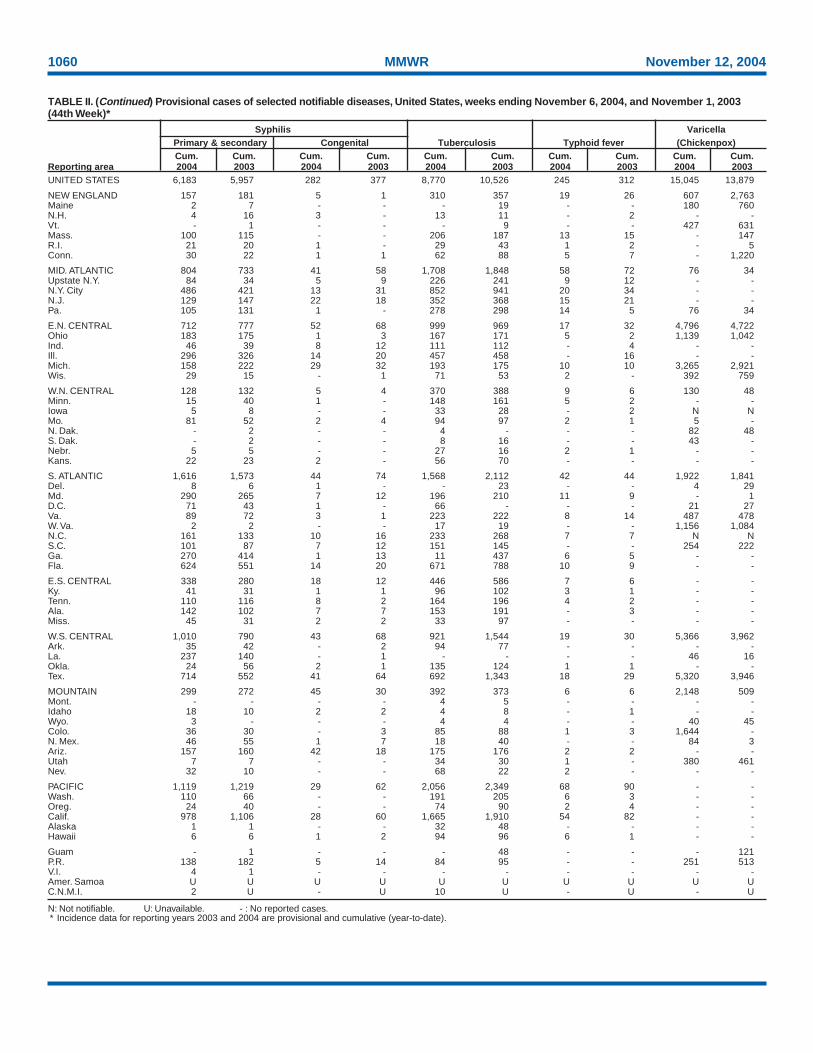


![2004 10:53:53 PM] - web.stanford.eduweb.stanford.edu/class/sbio228/public/lectures/Lecture5/SB228_Lec… · [2/5/2004 10:53:54 PM]](https://static.documents.pub/doc/80x56/5f06d37e7e708231d419edbb/2004-105353-pm-web-252004-105354-pm.jpg)


