4
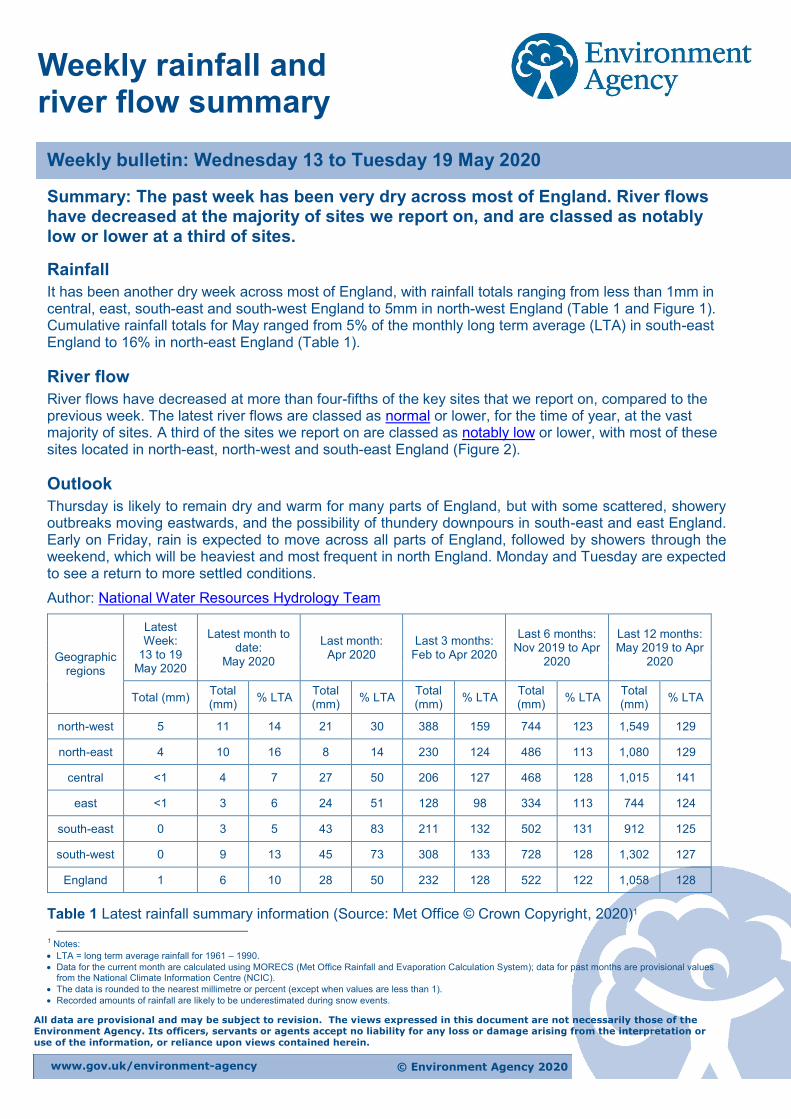
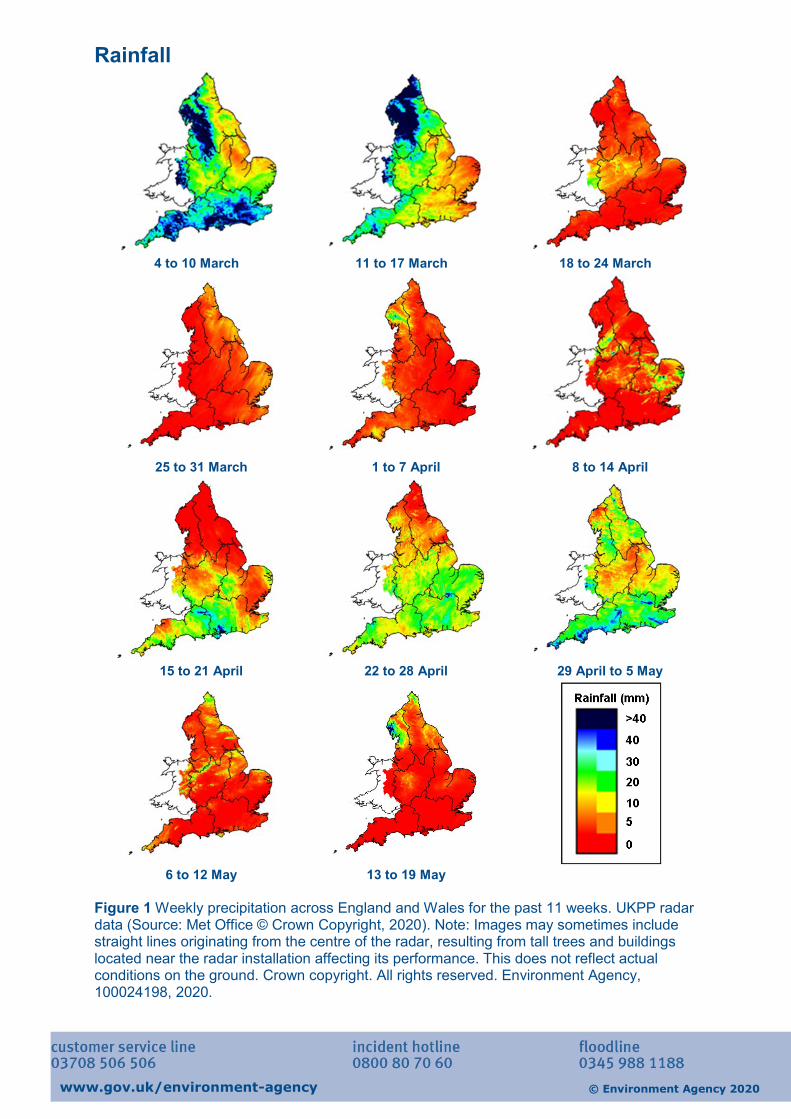
© Environment Agency 2020 www.gov.uk/environment-agency All data are provisional and may be subject to revision. The views expressed in this document are not necessarily those of the Environment Agency. Its officers, servants or agents accept no liability for any loss or damage arising from the interpretation or use of the information, or reliance upon views contained herein. Weekly rainfall and river flow summary Weekly bulletin: Wednesday 13 to Tuesday 19 May 2020 Summary: The past week has been very dry across most of England. River flows have decreased at the majority of sites we report on, and are classed as notably low or lower at a third of sites. Rainfall It has been another dry week across most of England, with rainfall totals ranging from less than 1mm in central, east, south-east and south-west England to 5mm in north-west England (Table 1 and Figure 1). Cumulative rainfall totals for May ranged from 5% of the monthly long term average (LTA) in south-east England to 16% in north-east England (Table 1). River flow River flows have decreased at more than four-fifths of the key sites that we report on, compared to the previous week. The latest river flows are classed as normal or lower, for the time of year, at the vast majority of sites. A third of the sites we report on are classed as notably low or lower, with most of these sites located in north-east, north-west and south-east England (Figure 2). Outlook Thursday is likely to remain dry and warm for many parts of England, but with some scattered, showery outbreaks moving eastwards, and the possibility of thundery downpours in south-east and east England. Early on Friday, rain is expected to move across all parts of England, followed by showers through the weekend, which will be heaviest and most frequent in north England. Monday and Tuesday are expected to see a return to more settled conditions. Author: National Water Resources Hydrology Team Geographic regions Latest Week: 13 to 19 May 2020 Latest month to date: May 2020 Last month: Apr 2020 Last 3 months: Feb to Apr 2020 Last 6 months: Nov 2019 to Apr 2020 Last 12 months: May 2019 to Apr 2020 Total (mm) Total (mm) % LTA Total (mm) % LTA Total (mm) % LTA Total (mm) % LTA Total (mm) % LTA north-west 5 11 14 21 30 388 159 744 123 1,549 129 north-east 4 10 16 8 14 230 124 486 113 1,080 129 central <1 4 7 27 50 206 127 468 128 1,015 141 east <1 3 6 24 51 128 98 334 113 744 124 south-east 0 3 5 43 83 211 132 502 131 912 125 south-west 0 9 13 45 73 308 133 728 128 1,302 127 England 1 6 10 28 50 232 128 522 122 1,058 128 Table 1 Latest rainfall summary information (Source: Met Office © Crown Copyright, 2020) 1 1 Notes: LTA = long term average rainfall for 1961 – 1990. Data for the current month are calculated using MORECS (Met Office Rainfall and Evaporation Calculation System); data for past months are provisional values from the National Climate Information Centre (NCIC). The data is rounded to the nearest millimetre or percent (except when values are less than 1). Recorded amounts of rainfall are likely to be underestimated during snow events.


![In-line Air Filter RoHSca01.smcworld.com/catalog/New-products-en/mpv/es... · Total length [mm] 45.0 60.5 53.9 68.3 79.6 Total width [mm] 8.5 11.2 19.0 23.6 Bracket total length [mm]](https://static.documents.pub/doc/80x56/5f475266e9610f77f5120cac/in-line-air-filter-total-length-mm-450-605-539-683-796-total-width-mm-85.jpg)


