21
Weighted Index Number Item 2000 Index Pasta 100 B read 100 P otatoes 100 Chips 100
| Date post: | 24-Dec-2015 |
| Category: |
Documents |
| Upload: | doreen-hodge |
| View: | 220 times |
| Download: | 3 times |
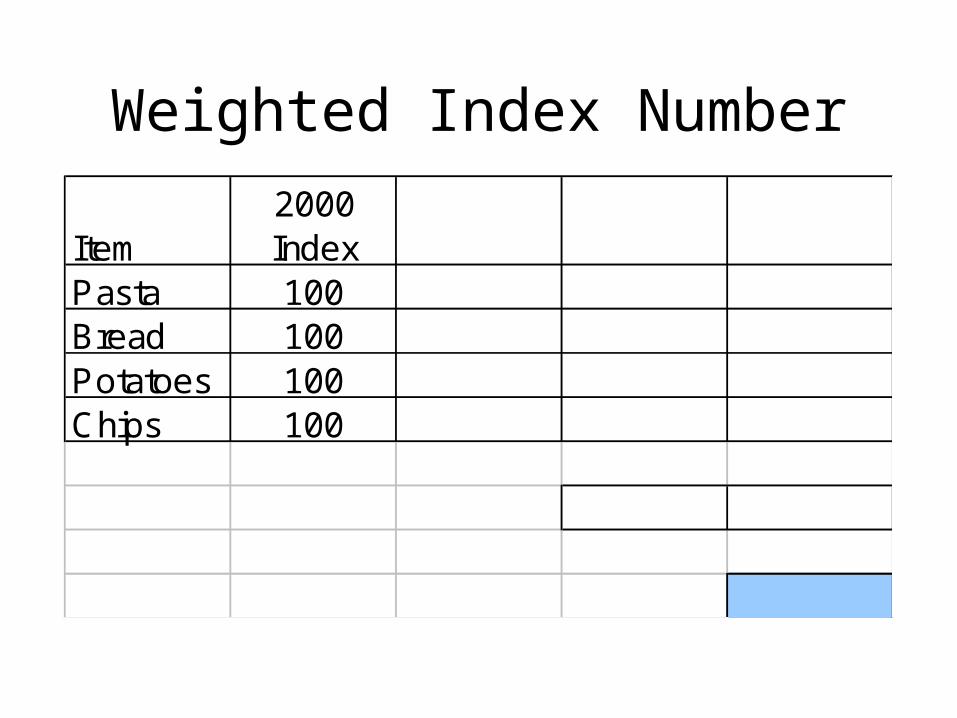
Weighted Index Number
Item2000 Index
Pasta 100Bread 100Potatoes 100Chips 100

Weighted Index Number
Item2000 Index
2003 Index
Pasta 100 105Bread 100 98Potatoes 100 103Chips 100 101

Weighted Index Number
Item2000 Index
2003 Index Weighting
Pasta 100 105 23Bread 100 98 10Potatoes 100 103 6Chips 100 101 15
54
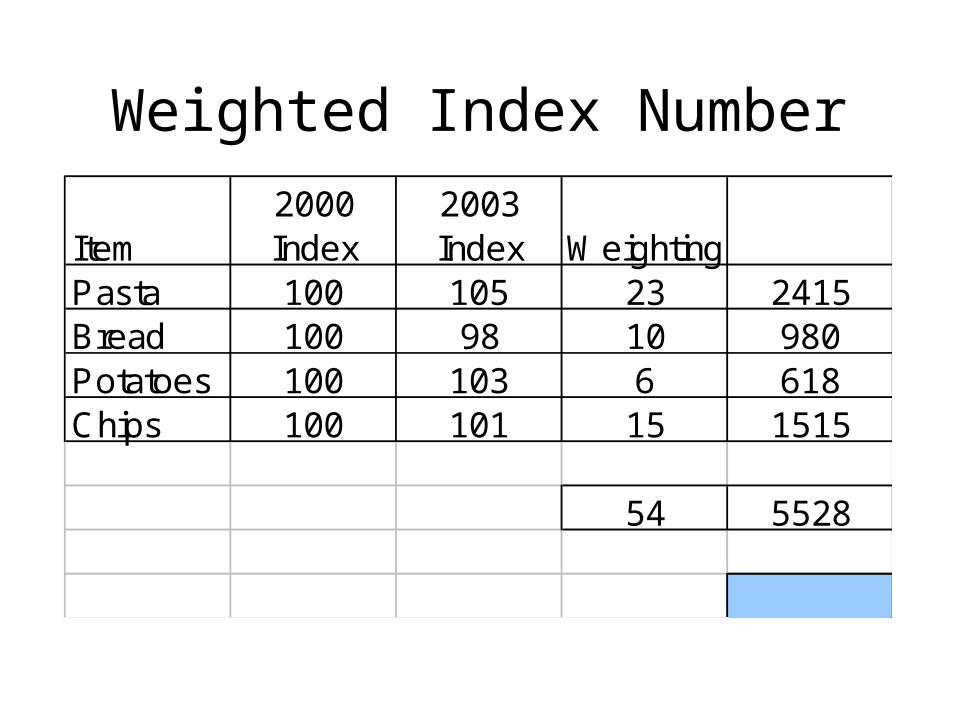
Weighted Index Number
Item2000 Index
2003 Index Weighting
Pasta 100 105 23 2415Bread 100 98 10 980Potatoes 100 103 6 618Chips 100 101 15 1515
54 5528

Weighted Index Number
Item2000 Index
2003 Index Weighting
Pasta 100 105 23 2415Bread 100 98 10 980Potatoes 100 103 6 618Chips 100 101 15 1515
54 5528
102.4
Retail Price IndexWhat is it used for?Measures of inflation are vital tools for economists, business and government. Wage agreements, pensions and changes in benefit levels are often linked directly to the RPI.
How is the RPI calculated?The RPI is often described in terms of a shopping basket containing some 650 goods and services, chosen as indicators of price movements for a range of similar items.
Who gathers the prices?Prices are collected in two ways. The local price collection is carried out by a market research firm who collect over 130,000 prices per month. Staff collect a further 10,000 prices centrally each month.

Retail Price IndexWhere are prices collected?Random sampling of locations was introduced in 1995. 150 shopping areas or out of town retail parks areas are selected for the price collection each year.
Are all items represented equally?No. The RPI is a weighted index - for example, since most people spend far more on electricity than on processed fruit, a price rise for electricity would have more effect than a similar-sized one for processed fruit.
Are all households' spending patterns represented in the RPI?No pensioner households and high-income households are excluded.
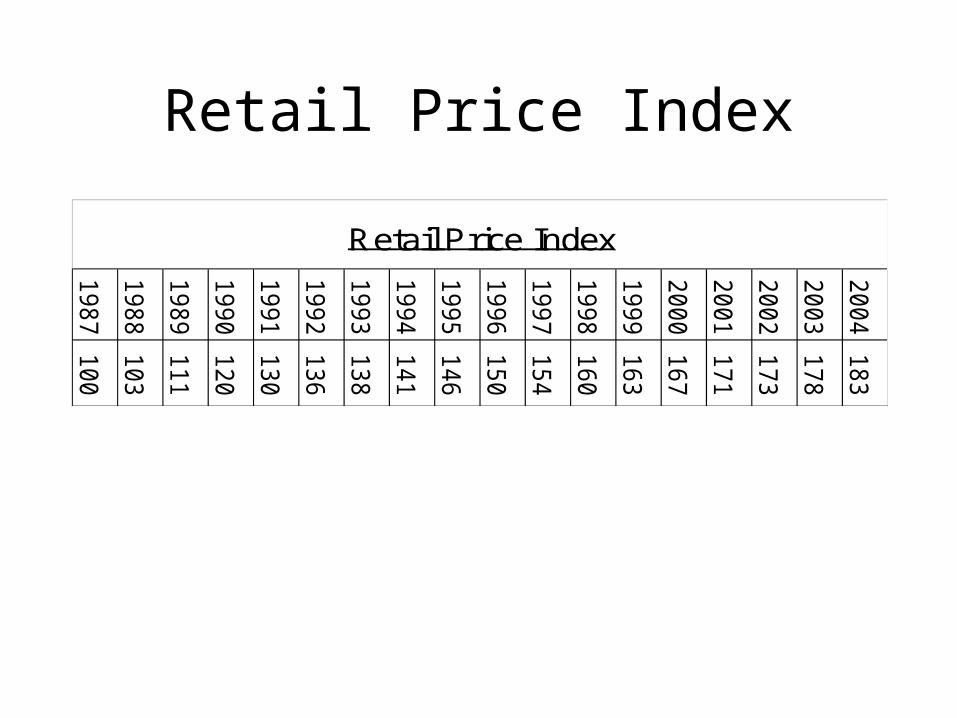
Retail Price Index
1987
1988
1989
1990
1991
1992
1993
1994
1995
1996
1997
1998
1999
2000
2001
2002
2003
2004
100
103
111
120
130
136
138
141
146
150
154
160
163
167
171
173
178
183
Retail Price Index

Standard Population
Age Group Number Fraction Standard Population0-18 2500
19-40 500041-60 4000
61-100 8500
20000
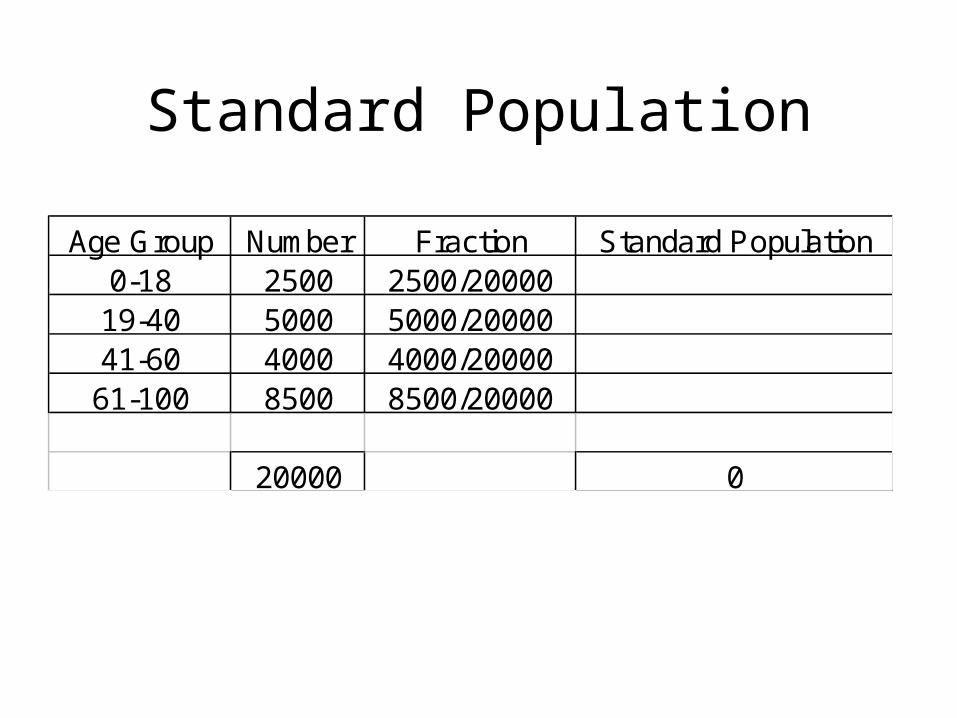
Standard Population
Age Group Number Fraction Standard Population0-18 2500 2500/20000
19-40 5000 5000/2000041-60 4000 4000/20000
61-100 8500 8500/20000
20000 0
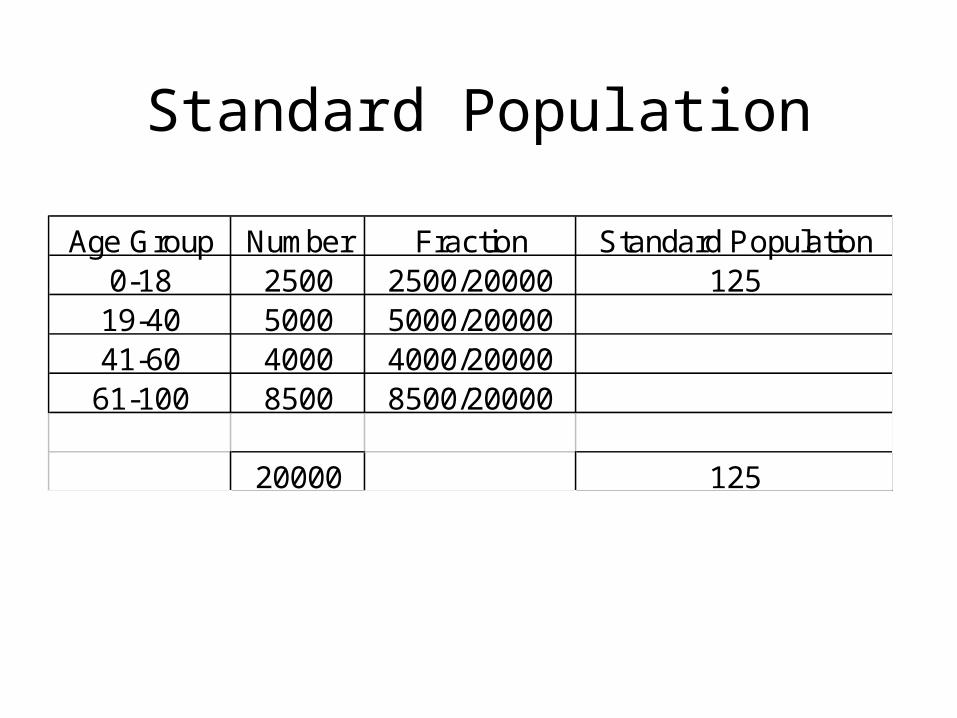
Standard Population
Age Group Number Fraction Standard Population0-18 2500 2500/20000 125
19-40 5000 5000/2000041-60 4000 4000/20000
61-100 8500 8500/20000
20000 125

Standard Population
Age Group Number Fraction Standard Population0-18 2500 2500/20000 125
19-40 5000 5000/20000 25041-60 4000 4000'20000 200
61-100 8500 8500/20000 425
20000 1000
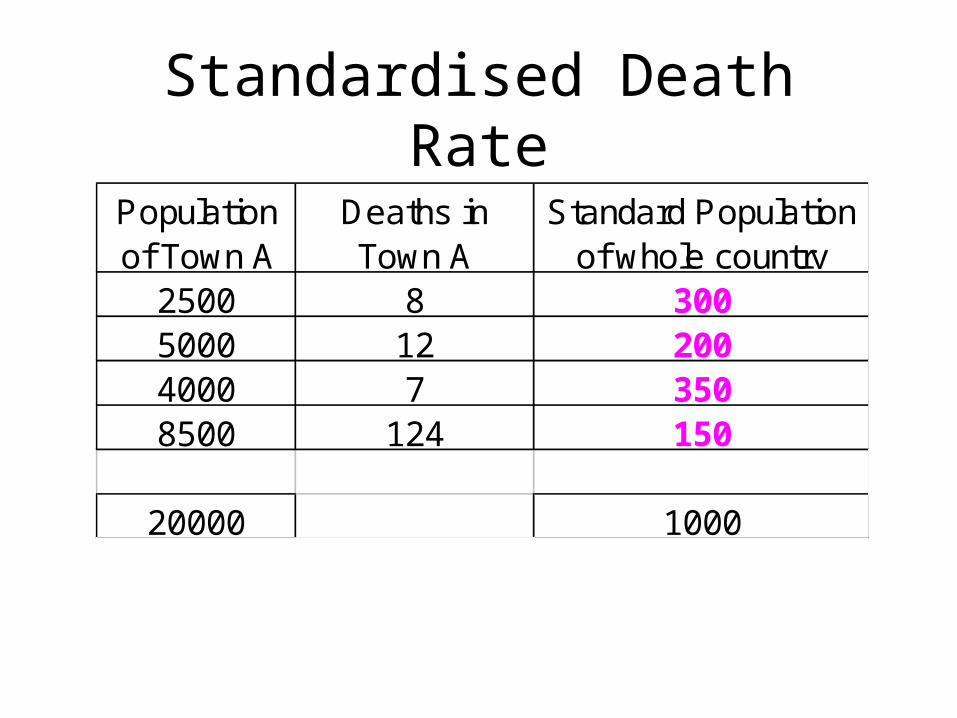
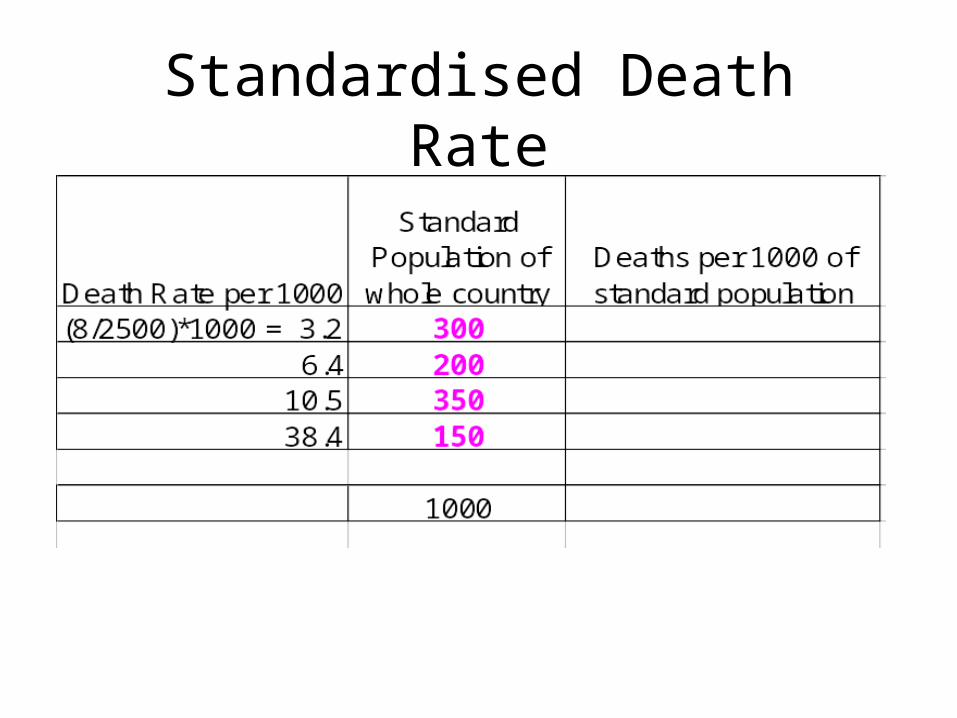
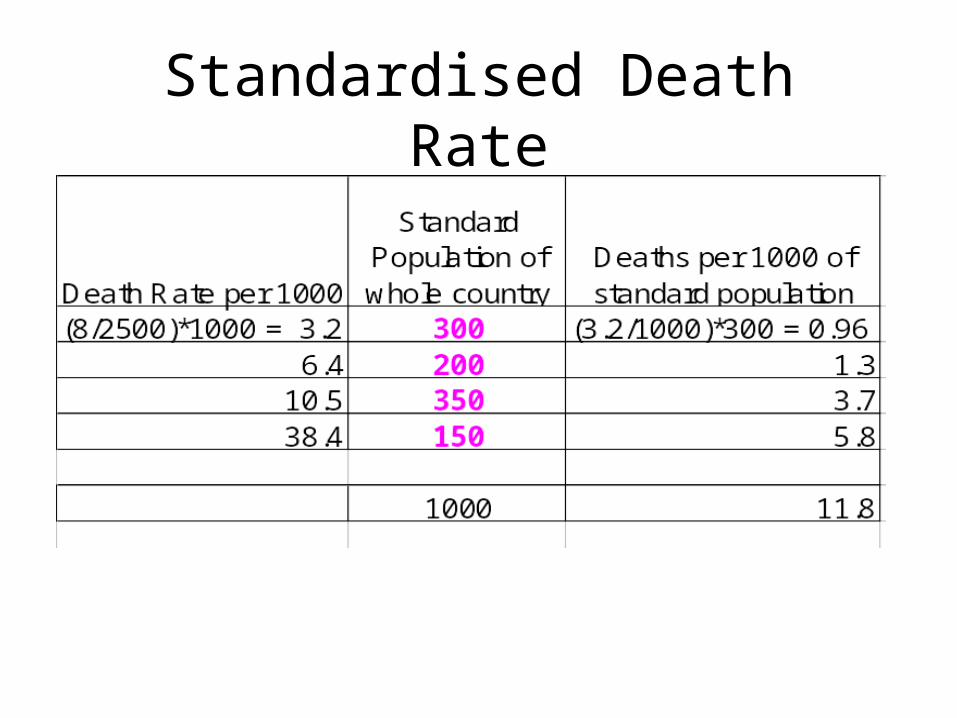
Standardised Death Rate
Population of Town A
Deaths in Town A
Standard Population of whole country
2500 8 3005000 12 2004000 7 3508500 124 150
20000 1000

Standardised Death Rate
Standardised Death Rate
Standardised Death Rate
Standardised Death Rate
Standardised Death Rate
Population of Town A
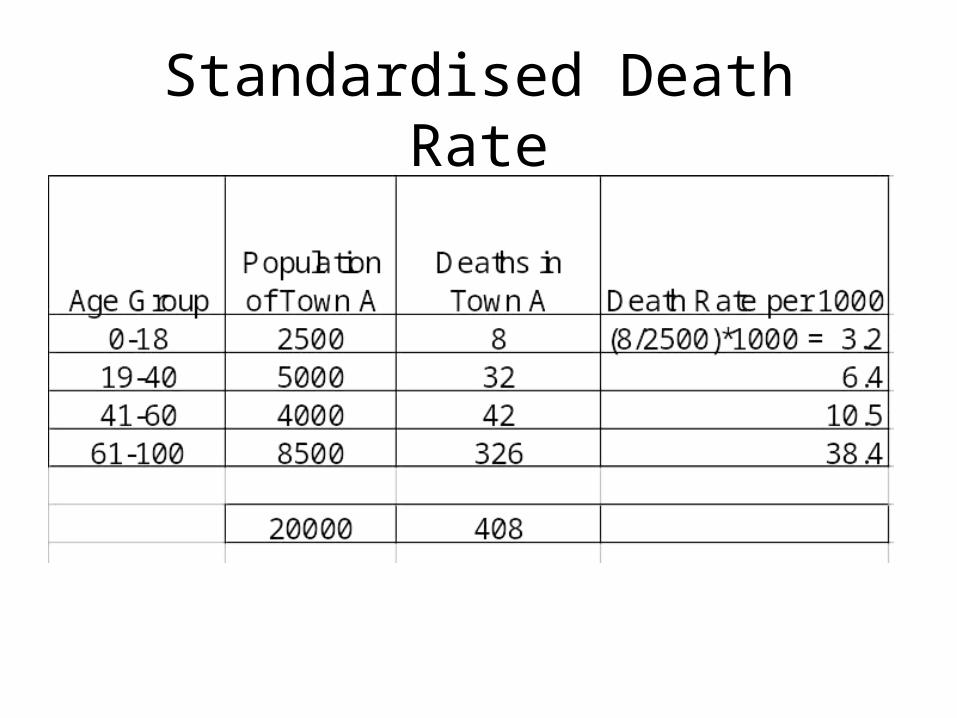
Deaths in Town A Death Rate per 1000
Standard Population of whole country
Deaths per 1000 of standard population
2500 8 (8/2500)*1000 = 3.2 300 (3.2/1000)*300 = 0.965000 32 6.4 200 1.34000 42 10.5 350 3.78500 326 38.4 150 5.8
20000 408 1000 11.8
Standardised Death Rate for Town A is 11.8 deaths per 1000 people
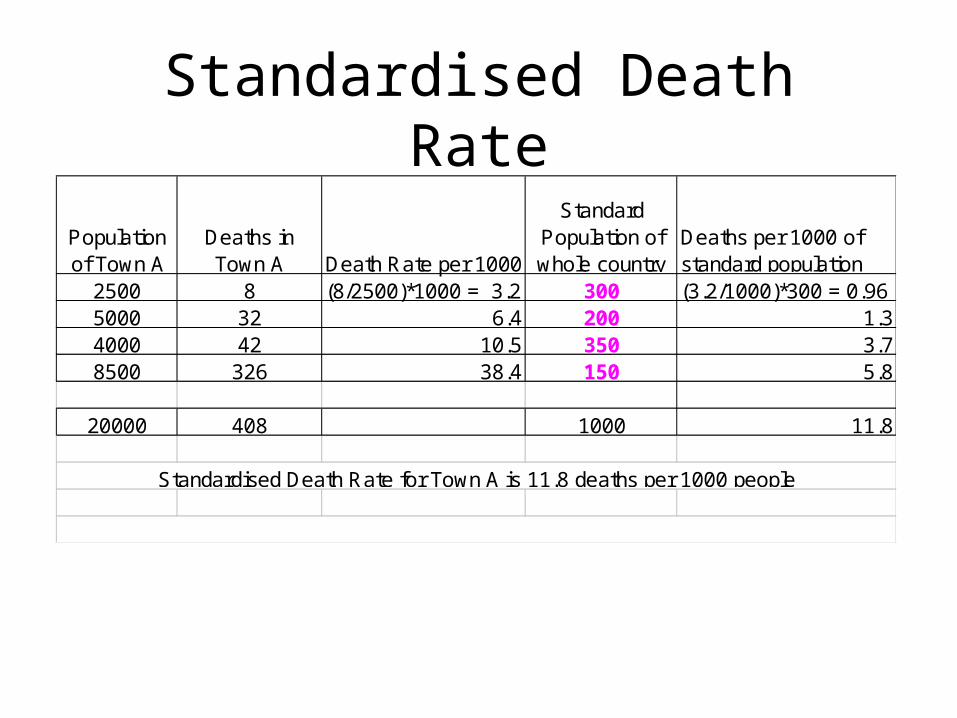
Standardised Death Rate
Population of Town A
Deaths in Town A Death Rate per 1000
Standard Population of whole country
Deaths per 1000 of standard population
2500 8 (8/2500)*1000 = 3.2 300 (3.2/1000)*300 = 0.965000 32 6.4 200 1.34000 42 10.5 350 3.78500 326 38.4 150 5.8
20000 408 1000 11.8
Standardised Death Rate for Town A is 11.8 deaths per 1000 people
The crude death rate is 408/20000*1000 = 20.4
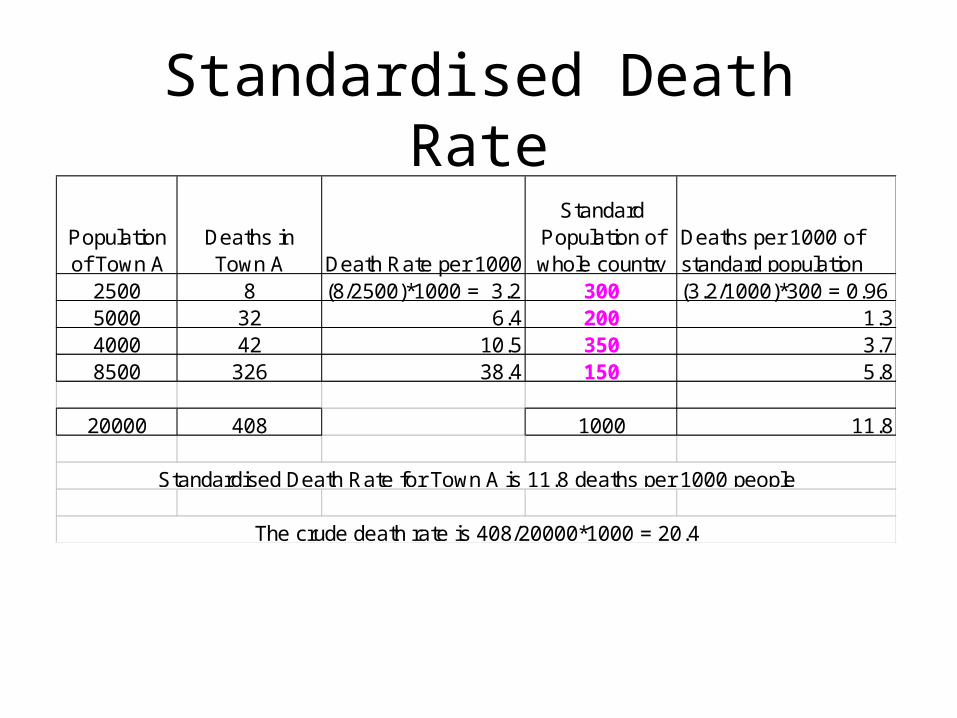


