Page 1
© 2016 University of Southern California Presentation only. Not for distribution.
Welcome CEO Sponsor Community and guests
Alec Levenson, Senior Research Scientist Center for Effective OrganizationsMarshall School of BusinessUniversity of Southern California
Webinar: Analytics for Driving High Performance
March 22, 2016
Page 2
© 2016 University of Southern California Presentation only. Not for distribution.
Page 3
© 2016 University of Southern California Presentation only. Not for distribution.
Optimizing work design for high performance
(3)
Page 4
© 2016 University of Southern California Presentation only. Not for distribution.
Compensation and capability analytics
Strategy is based on very strong assumptions about how much it costs to get productivity
• What is the right amount to pay for a job?
• When is it not enough?
• When is it too much?
• What is the best way to support the strategy?
(4)
Page 5
© 2016 University of Southern California Presentation only. Not for distribution.
1. What is the current state? What if we had more/higher performing org/work
design, capability, or culture/attitudes? What if we had less? Nordstrom vs. 7-11
2. What does strategy say we can afford? What is practical, reasonable? Where should we invest?
Construct Scenarios to Guide Decision Making
(5)
Page 6
© 2016 University of Southern California Presentation only. Not for distribution.
Work Design Drives Compensation Design
Two main choices for strategy and work design
1. High / higher Performance Margins Quality Competencies & capabilities
2. Lower Performance Margins Quality Competencies & capabilities
(6)
Page 7
© 2016 University of Southern California Presentation only. Not for distribution.
Organization/Work Choices:
High performance vs. execution
(7)
Page 8
© 2016 University of Southern California Presentation only. Not for distribution.
• Higher margins• Fewer direct competitors• Greater agility
• Current margins• Same direct competitors• Same agility
• Lower margins• More direct competitors• Less agility
Higher
Current
Lower
Organization Design
(8)
Page 9
© 2016 University of Southern California Presentation only. Not for distribution.
• More responsibility and autonomy
• Fewer routine tasks
• Current responsibility and autonomy
• Same work design
• Less responsibility and autonomy
• More routine tasks
Higher
Current
Lower
Work / Job Design
(9)
Page 10
© 2016 University of Southern California Presentation only. Not for distribution.
Align Work and Compensation Designs
Work design and compensation design have to
be aligned for maximum effectiveness
Work Design
Lower Higher
CompensationDesign
Higher Not aligned Aligned
Lower Aligned Not aligned
Implications for change:• How to increase org capabilities effectively?• How do you know where to invest vs. cut back?
(10)
Page 11
© 2016 University of Southern California Presentation only. Not for distribution.
Branded Pharmaceuticals Example• Strategy : develop and sell high margin drugs
– Sources of competitive advantage / org design focus:• R&D function• Sales function• M&A: strategy, finance
• Capabilities– Org: innovation (R&D); market share (sales; M&A)– Role: scientific competencies; sales competencies
• Compensation design– If we pay less for capabilities in the less strategically important
areas, will that hurt performance?– If we pay more for capabilities in the more strategically important
areas, will that improve performance?
(11)
Page 12
© 2016 University of Southern California Presentation only. Not for distribution.
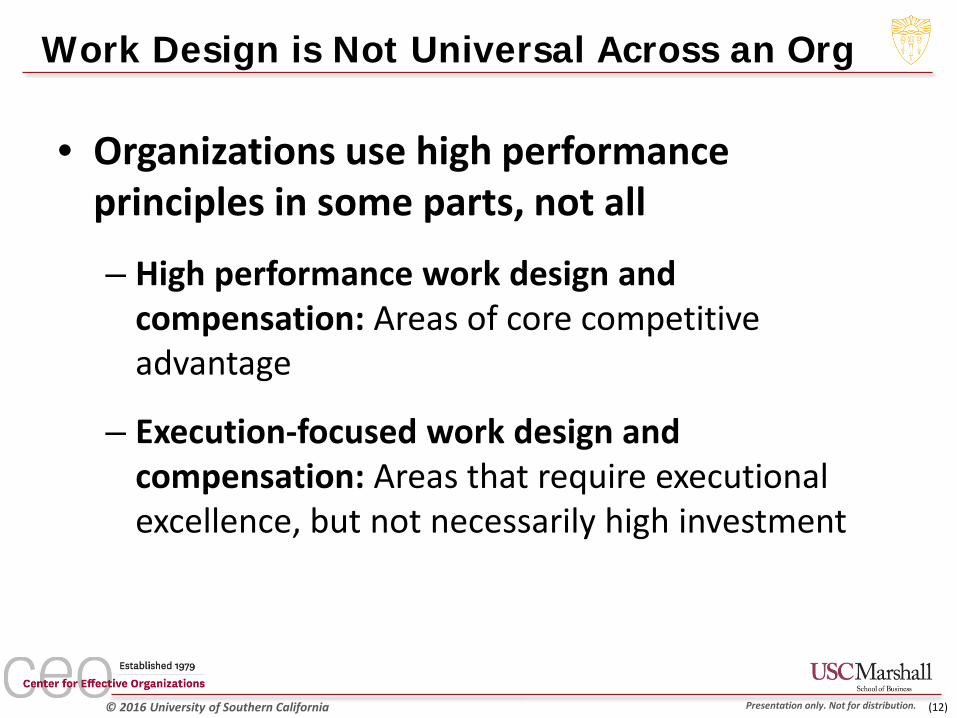
Work Design is Not Universal Across an Org
• Organizations use high performance principles in some parts, not all
– High performance work design and compensation: Areas of core competitive advantage
– Execution-focused work design and compensation: Areas that require executional excellence, but not necessarily high investment
(12)
Page 13
© 2016 University of Southern California Presentation only. Not for distribution.
High Performance vs. Execution Work Design
Organization process
Industry
Pharma Tech Food Aerospace Temp Agency
R&D High performance
High performance Execution High
performanceNot applicable
Quality / operations
Highperformance Execution Execution Product
dependent
Market segment dependent
Branding / marketing
Highperformance
Productdependent
High performance Execution Execution
Distribution Execution Product dependent
Highperformance
Not applicable
High performance
GovernmentRelations
High performance
Execution (except for new market access)
Execution (except for new market access)
High performance
Execution (except for new market access)
Customer service Execution Product
dependent Execution Execution High performance
(13)
Page 14
© 2016 University of Southern California Presentation only. Not for distribution.
Strategic Value of Work Design
• Within-industry differences– Tech: Apple vs. Google vs. Microsoft vs. Oracle– Aerospace: Boeing / Airbus vs. Embraer
• Across business units– Disney
• Theme parks vs. ESPN vs. Pixar
– GE• Financial services vs. aircraft engines vs. refrigerators
Within industry & across business unit differences
(14)
Page 15
© 2016 University of Southern California Presentation only. Not for distribution.
Example: Pharmaceuticals
(15)
Page 16
© 2016 University of Southern California Presentation only. Not for distribution.
High Performance vs. Execution Work Design
Organization processIndustry: Pharmaceuticals
Branded pharmaceutical company Generic pharmaceutical company
R&D High performance Execution
Quality High performance High performance
Operations Execution High performance
Branding / Marketing High performance Execution
Go To Market
Distribution Execution High performance
Sales High performance Execution
Government Relations High performance High performance
Customer service Execution Execution(16)
Page 17
© 2016 University of Southern California Presentation only. Not for distribution.
• How are our products and services created and delivered?
• What is our strategy? Where are we investing more?
• What org design / work design options support the strategy?– Current state vs. more vs. less
• How does the current design align with the options?– Where are things well aligned and where not?– Choose the right level of analysis: enterprise, (cross)business unit,
(cross)function, site, work group/team/process, role/occupation– What is the cause of the non-alignment?
• Are roles and responsibilities properly defined?– If no, focus on work design– If not allowed to change work design, look for sub-optimization points,
workarounds, incompatible systems & processes, inconsistent logic
Diagnose the System
(17)
Page 18
© 2016 University of Southern California Presentation only. Not for distribution.
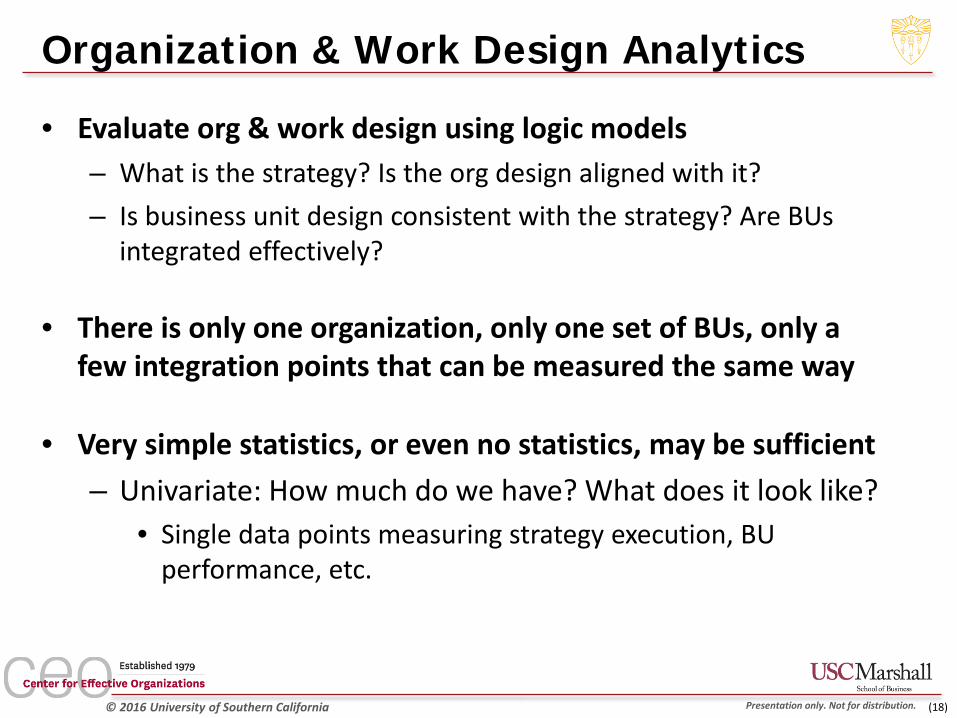
Organization & Work Design Analytics
• Evaluate org & work design using logic models– What is the strategy? Is the org design aligned with it?– Is business unit design consistent with the strategy? Are BUs
integrated effectively?
• There is only one organization, only one set of BUs, only a few integration points that can be measured the same way
• Very simple statistics, or even no statistics, may be sufficient– Univariate: How much do we have? What does it look like?
• Single data points measuring strategy execution, BU performance, etc.
(18)
Page 19
© 2016 University of Southern California Presentation only. Not for distribution.
Questions to help guide the analytics
• Intended and unintended consequences of past decisions– What are the implications for org effectiveness?
• Organization level– Why are our business units and functions set up the way they are?– What kinds of compromise decisions were made in the past?
• Is decision making responsibility distributed appropriately?
• Team/unit level– Why are our teams/units staffed and resourced the way they are?
• Role level/individual capability– Why are roles staffed and compensated the way they are?– What are the labor cost business model assumptions being used?
• Are they applied as the strategy, Finance and HR assume they should be?
– Leadership: what compromises have been made to keep someone in the organization or give them special opportunities?
(19)
Page 20
© 2016 University of Southern California Presentation only. Not for distribution.
Interdependencies and Competitive Advantage
• Certain roles and functions can be critical for helping to deliver competitive advantage
• If taken for granted, the organization may neglect or underinvest in critical support processes and functions
(20)
Page 21
© 2016 University of Southern California Presentation only. Not for distribution.
Optimize Design Based on Role in High Performance
• Interdependencies: Role-based view– Janitors at Intel / AMD in manufacturing vs. office support
– Call center reps at Citibank / UBS in credit card marketing vs. wealth management
• Interdependencies: Process-based view– Quality processes in manufacturing vs. office operations
• Six Sigma’s ability to contribute to execution vs. strategy
– Go to market systems at companies like PepsiCo and Nestlé: direct store vs. warehouse delivery
(21)
Page 22
© 2016 University of Southern California Presentation only. Not for distribution.
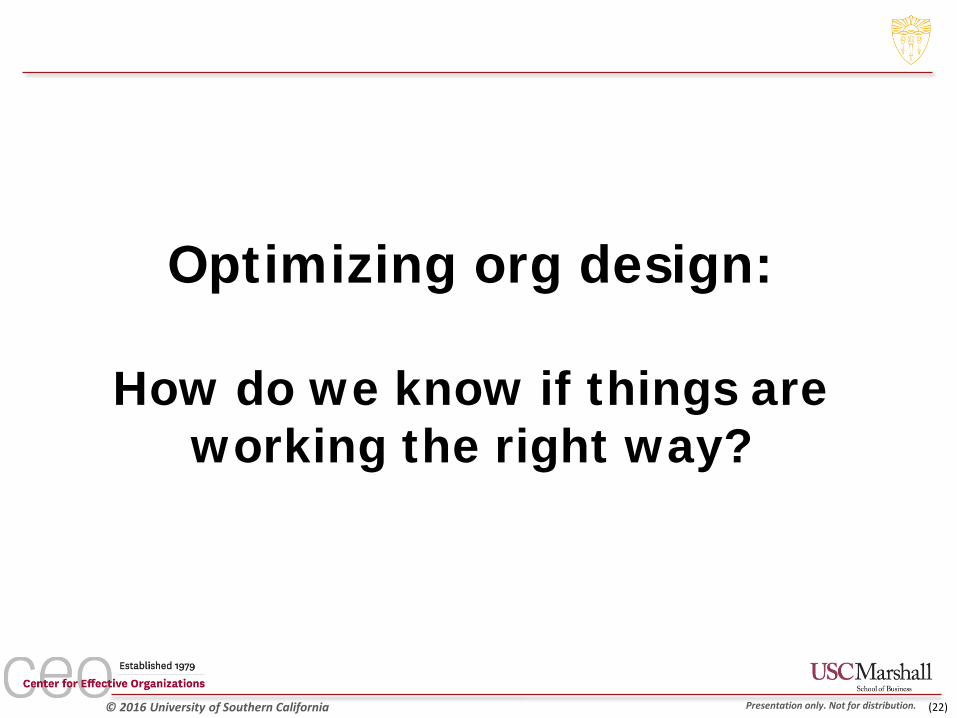
Optimizing org design:
How do we know if things are working the right way?
(22)
Page 23
© 2016 University of Southern California Presentation only. Not for distribution.
• Sunrise and traffic jams
• Engagement and performance
• Causation• Temporal dimension• The causal variables have to be immune to
influence from what they are supposed to cause
• Causal?• Leadership/360 behaviors?• Performance ratings?
Correlation vs. Causation
(23)
Page 24
© 2016 University of Southern California Presentation only. Not for distribution.
Story telling about business results
(24)
• People construct narratives about the way things happen by starting with individual jobs– Sales issues are viewed as originating from sales roles– Innovation issues come from R&D roles– Supply chain issues come from logistics roles– Etc.
• But that simple picture is not the way that business results actually are achieved– Roles are interdependent: success depends on multiple people
doing aligned actions– Not everything matters: you have to focus on the specific tasks
and behaviors needed to execute the strategy• The tasks and behaviors that do not directly contribute to improved
strategy execution overwhelming outnumber the ones that do
Page 25
© 2016 University of Southern California Presentation only. Not for distribution.
Causal model of business results
(25)
Individual capability
Attitudes / motivation
Job design Role / job task execution
Human Capital Performance
Businessresults
Culture
Group / orgtask execution
Org capability
Org design
Enterprise Performance
Strategy Execution / Competitive Advantage
Page 26
© 2016 University of Southern California Presentation only. Not for distribution.
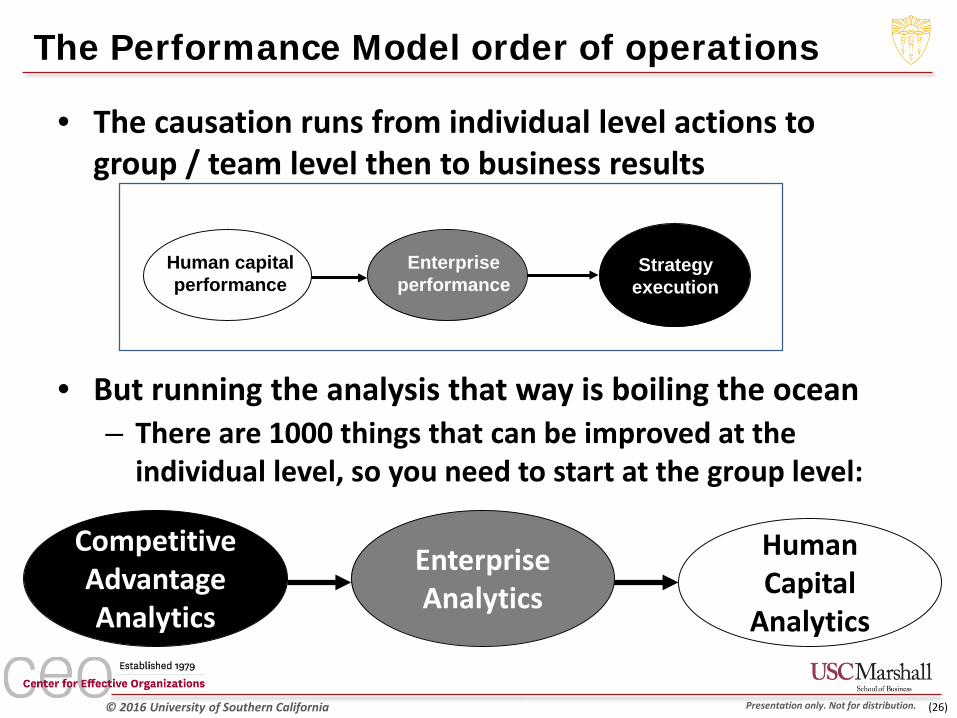
• The causation runs from individual level actions to group / team level then to business results
• But running the analysis that way is boiling the ocean– There are 1000 things that can be improved at the
individual level, so you need to start at the group level:
The Performance Model order of operations
(26)
Competitive Advantage Analytics
Human Capital
Analytics
Enterprise Analytics
Strategy execution
Human capital performance
Enterprise performance
Page 27
© 2016 University of Southern California Presentation only. Not for distribution.
Human capital analyticsStep #3: Diagnostics at the role, individual and/or HR
process levels
Enterprise analyticsStep #2: Diagnostics at the enterprise, business unit
and/or business process level
Competitive advantage analyticsStep #1: Identify organization capability strengths &
weaknesses, and gaps in strategy execution
Page 28
© 2016 University of Southern California Presentation only. Not for distribution.
Strategic Analytics: Leverage Analytics to Improve
Business Results and Organization Effectiveness
Los Angeles (Capital Group)May 17-19, 2016
withAlec Levenson (Senior Research Scientist, CEO)
and guest speakerBernard Bedon (Vice President, HR, Amgen)
http://ceo.usc.edu
Page 29
© 2016 University of Southern California Presentation only. Not for distribution.
For more information
(29)
Dr. Alec LevensonSenior Research Scientist
Center for Effective OrganizationsMarshall School of Business
University of Southern California
(213) 740-9814 - Main [email protected]
https://www.linkedin.com/pub/alec-levenson/5/547/891
http://ceo.usc.edu


![PLATINUM SPONSOR - Closte · LEVEL OF SPONSORSHIP [CHECK ONE]: q PLATINUM SPONSOR [$10000] q GOLD SPONSOR [$5000] q Breakfast Sponsor q Lunch Sponsor q Gift Sponsor q Auction Sponsor](https://static.documents.pub/doc/80x56/60014c66d50c102c412072c5/platinum-sponsor-closte-level-of-sponsorship-check-one-q-platinum-sponsor-10000.jpg)

