28
Welcome Shenyang National People’s Congress Delegates! 1
| Date post: | 26-Dec-2015 |
| Category: |
Documents |
| Upload: | peregrine-paul |
| View: | 245 times |
| Download: | 4 times |

Welcome Shenyang National People’s Congress Delegates!
1

Providing for the Future of China’s Economic Growth
A presentation to the Shenyang National People’s Congress
By Comrade Craig Pike
2
Overview
• Review of China’s growth since 1980
• Limitations to future growth
• Policy recommendations
3
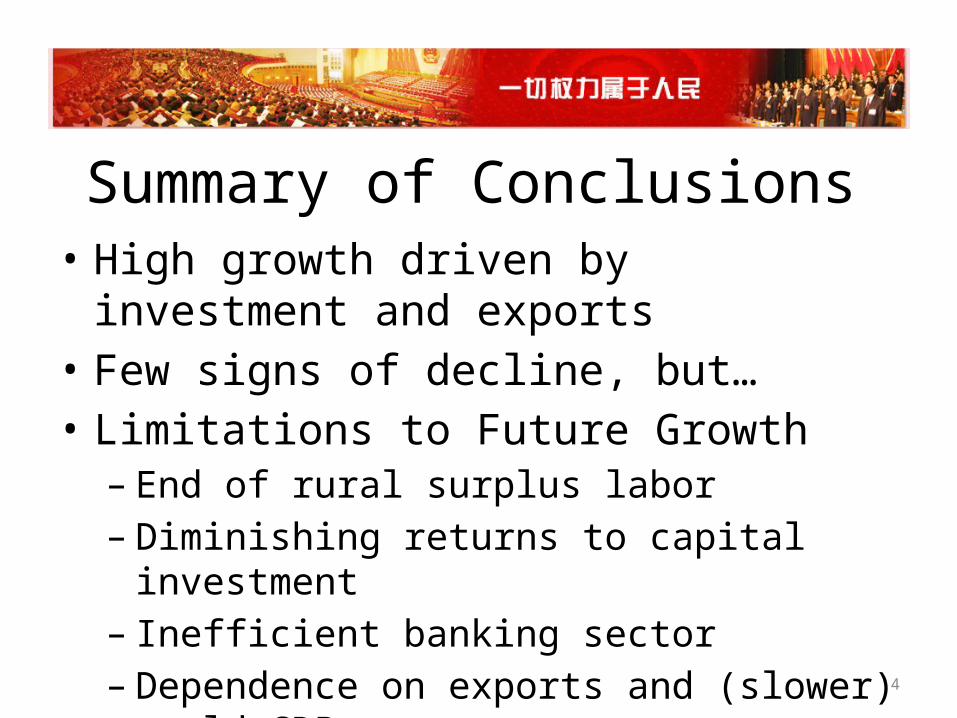
Summary of Conclusions• High growth driven by investment and exports• Few signs of decline, but…• Limitations to Future Growth– End of rural surplus labor– Diminishing returns to capital investment– Inefficient banking sector– Dependence on exports and (slower) world GDP
4

Summary of Conclusions (cont)• Policy Recommendations– Anticipate slow-down in economic growth
(Future growth increasingly dependent on technology gains)
– Increase focus on domestic economy
– Encourage more market-oriented banking system
5
Part I
• Review of China’s growth– High growth rates– Growth driven by investment and
exports
6

7

1980
1981
1982
1983
1984
1985
1986
1987
1988
1989
1990
1991
1992
1993
1994
1995
1996
1997
1998
1999
2000
2001
2002
2003
2004
2005
2006
2007
2008
2009
2010
0
2
4
6
8
10
12
14
16
China: Exceptional Growth since 1980
Real GDP Ave Annual Growth
Perc
ent
Ave. Annual Growth = 10.1%
8
19811983
19851987
19891991
19931995
19971999
20012003
20052007
2009
-10%
-5%
0%
5%
10%
15%
20%
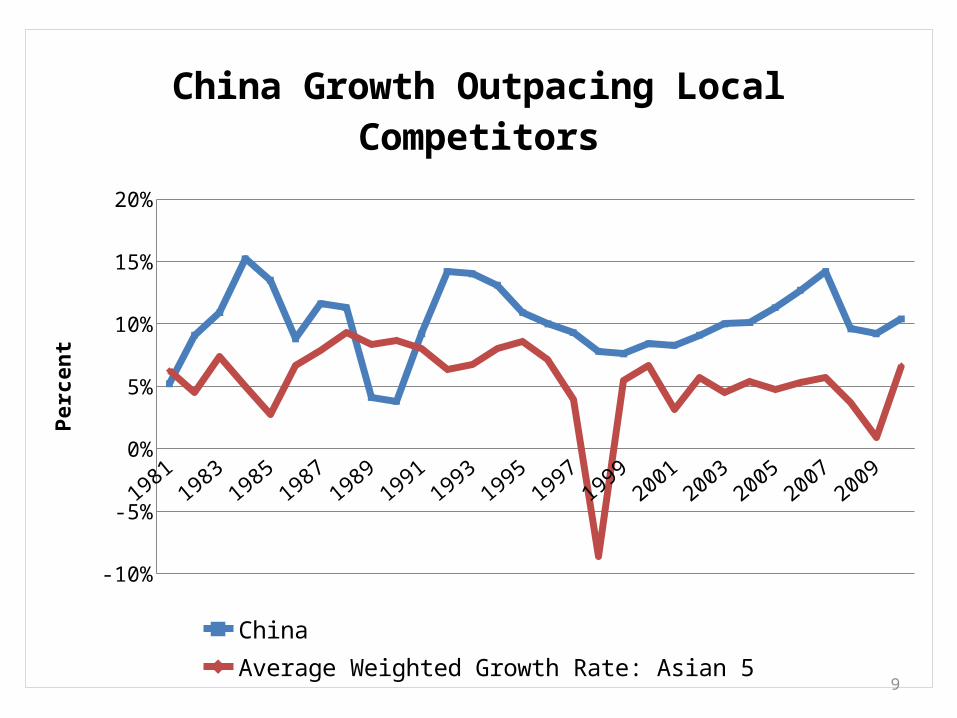
China Growth Outpacing Local Competitors
China Average Weighted Growth Rate: Asian 5
Perc
ent
9
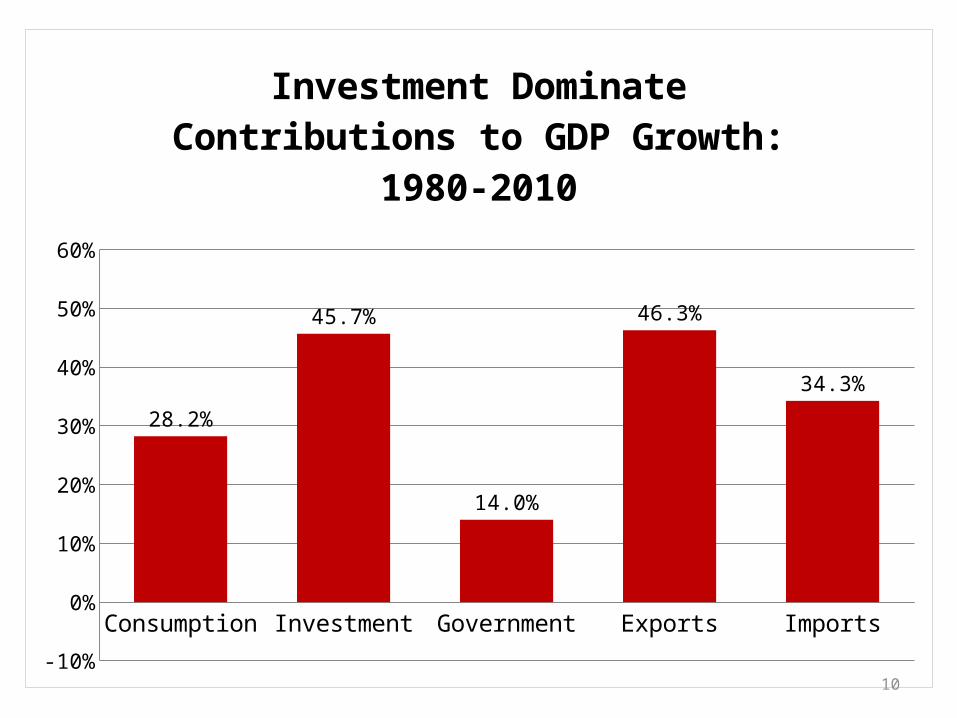
Consumption Investment Government Exports Imports
-10%
0%
10%
20%
30%
40%
50%
60%
28.2%
45.7%
14.0%
46.3%
34.3%
Investment Dominate Contributions to GDP Growth: 1980-2010
10
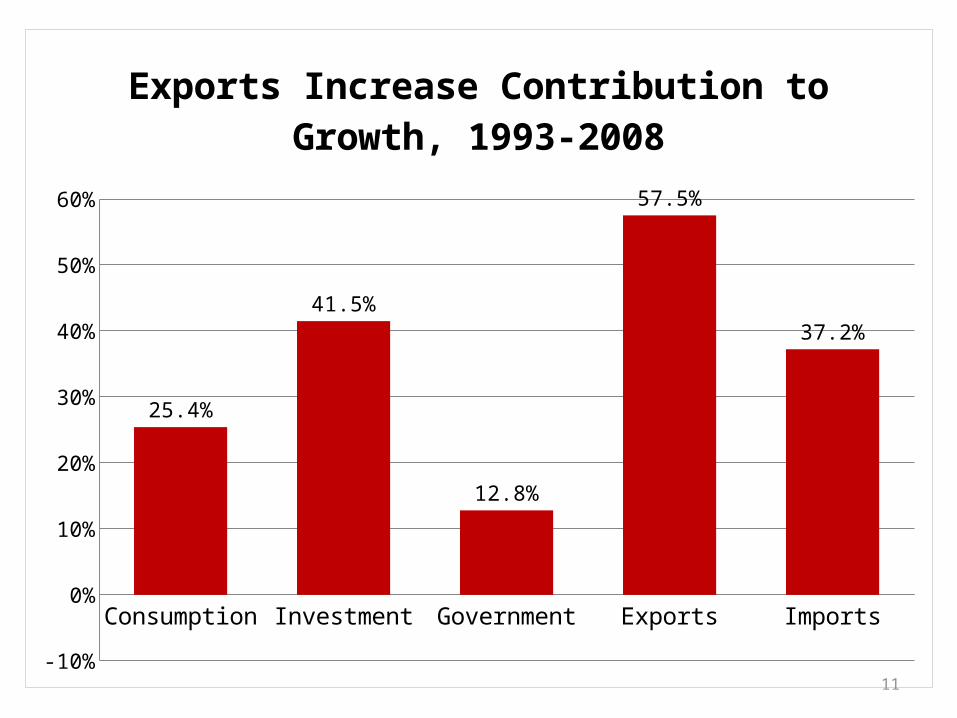
Consumption Investment Government Exports Imports
-10%
0%
10%
20%
30%
40%
50%
60%
25.4%
41.5%
12.8%
57.5%
37.2%
Exports Increase Contribution to Growth, 1993-2008
11
19811983
19851987
19891991
19931995
19971999
20012003
20052007
2009-15%
-10%
-5%
0%
5%
10%
15%
20%
25%
30%
35%
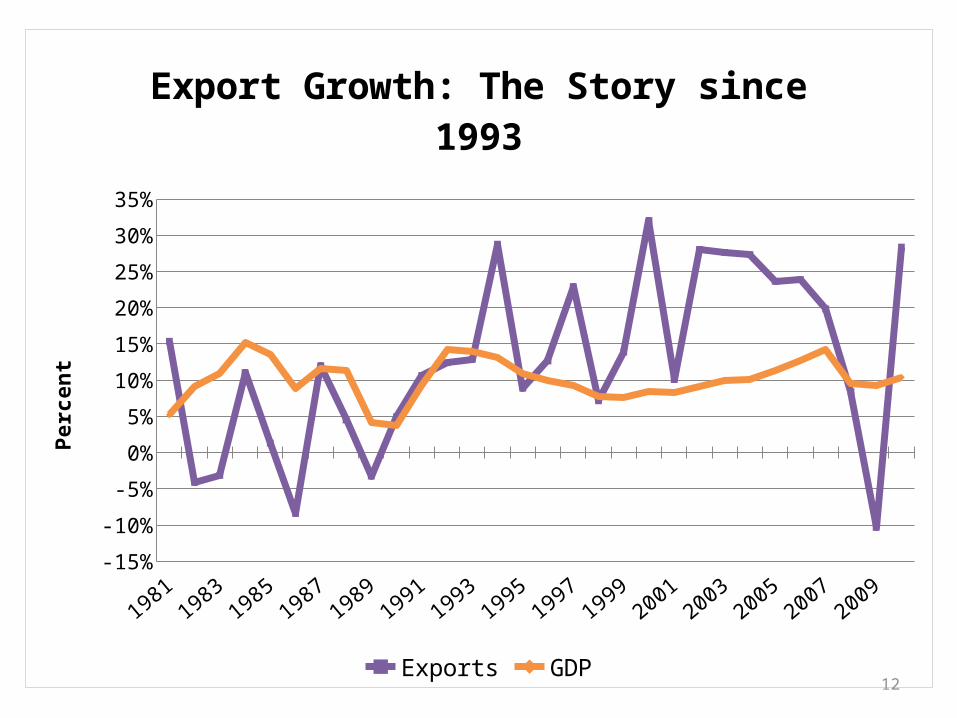
Export Growth: The Story since 1993
Exports GDP
Perc
ent
12
United St
ates
Canad
aBraz
il
German
y
Greece
India
Korea, R
ep.
Japan
Indonesia
Thail
and
Hong Kong
Mexico
China0%
5%
10%
15%
20%
25%
30%
35%
40%
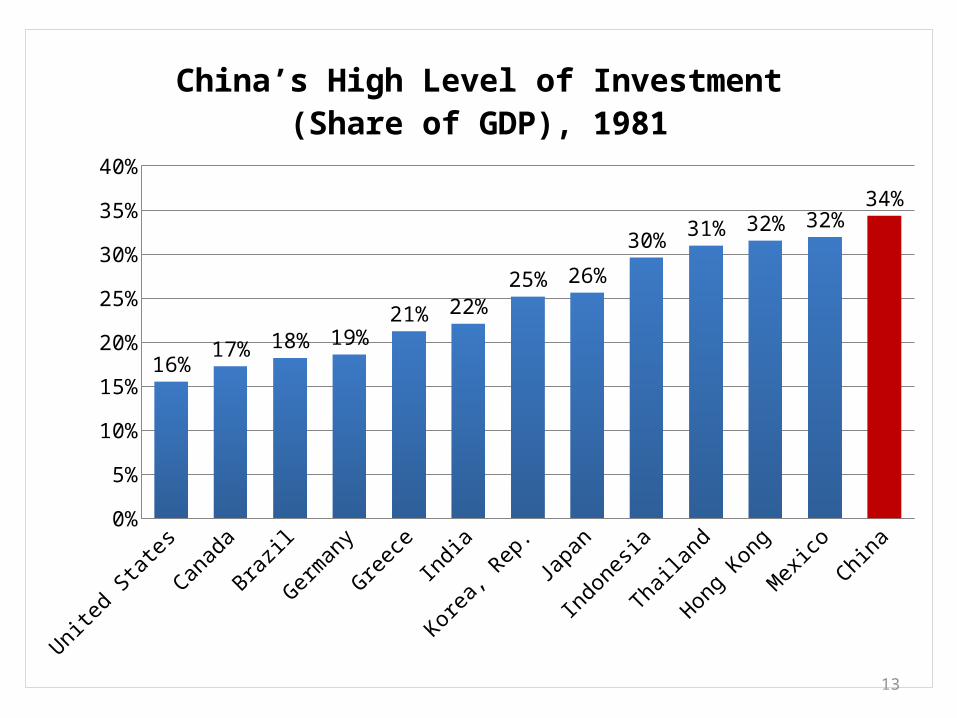
16%17% 18% 19%
21% 22%
25% 26%
30%31% 32% 32%
34%
China’s High Level of Investment (Share of GDP), 1981
13
United St
ates
Greece
German
yBraz
ilJap
an
Mexico
Thail
and
Canad
a
Hong Kong
Russia
Indonesia
Korea, R
ep.
IndiaChina
0%
5%
10%
15%
20%
25%
30%
35%
40%
45%
50%
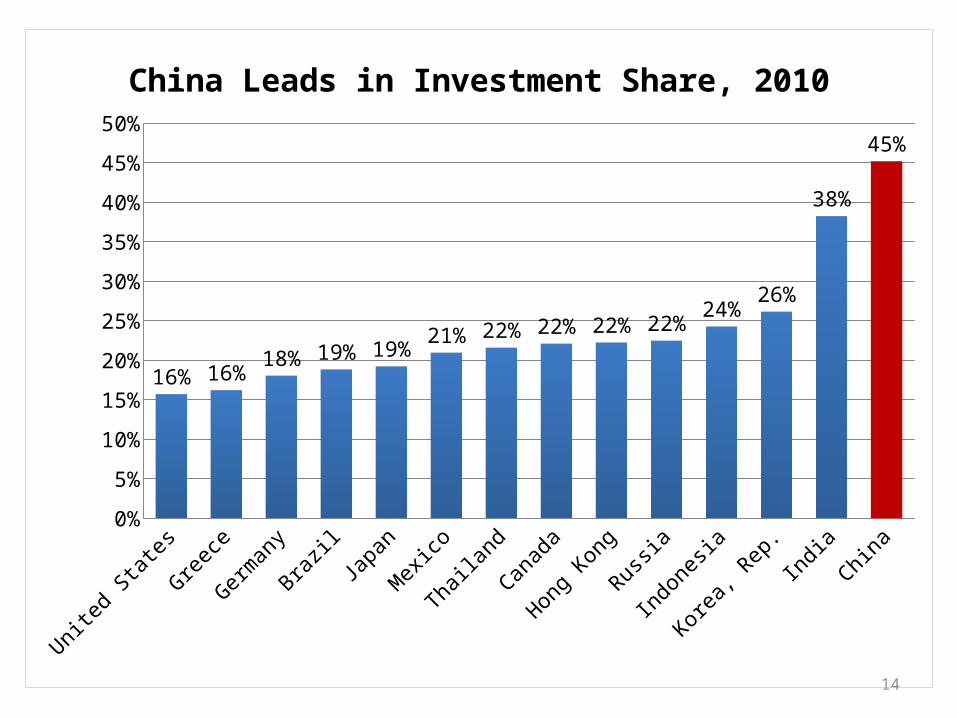
16% 16%18% 19% 19%
21% 22% 22% 22% 22%24%
26%
38%
45%
China Leads in Investment Share, 2010
14

China
Hong Kong
Canad
a
German
y
Indonesia
Japan
Greece
Brazil
Thail
and
Korea, R
ep.
Mexico
United St
ates
India0%
10%
20%
30%
40%
50%
60%
70%
80%
40%
55%57% 59% 59% 59% 60%
62% 62% 64% 64% 64%69%
Low Level of Consumption as Share of GDP, 1981
15
China
Thail
and
Korea, R
ep.
India
German
y
Indonesia
Japan
Canad
a
Hong Kong
Brazil
Mexico
Russia
United St
ates
Greece
0%
10%
20%
30%
40%
50%
60%
70%
80%
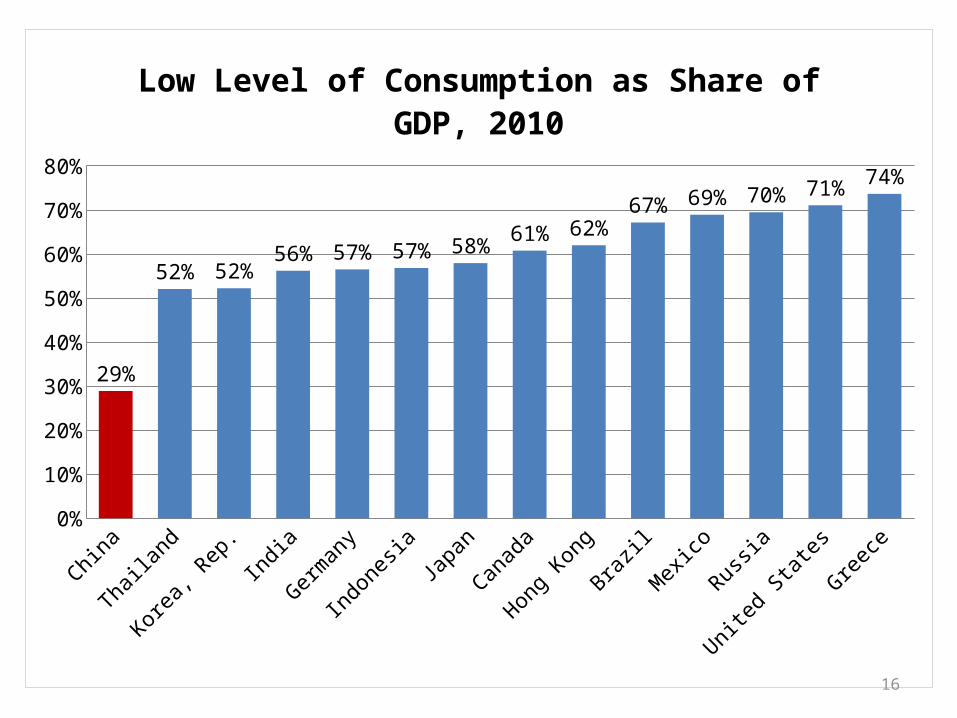
29%
52% 52%56% 57% 57% 58%
61% 62%67% 69% 70% 71%
74%
Low Level of Consumption as Share of GDP, 2010
16
Part II
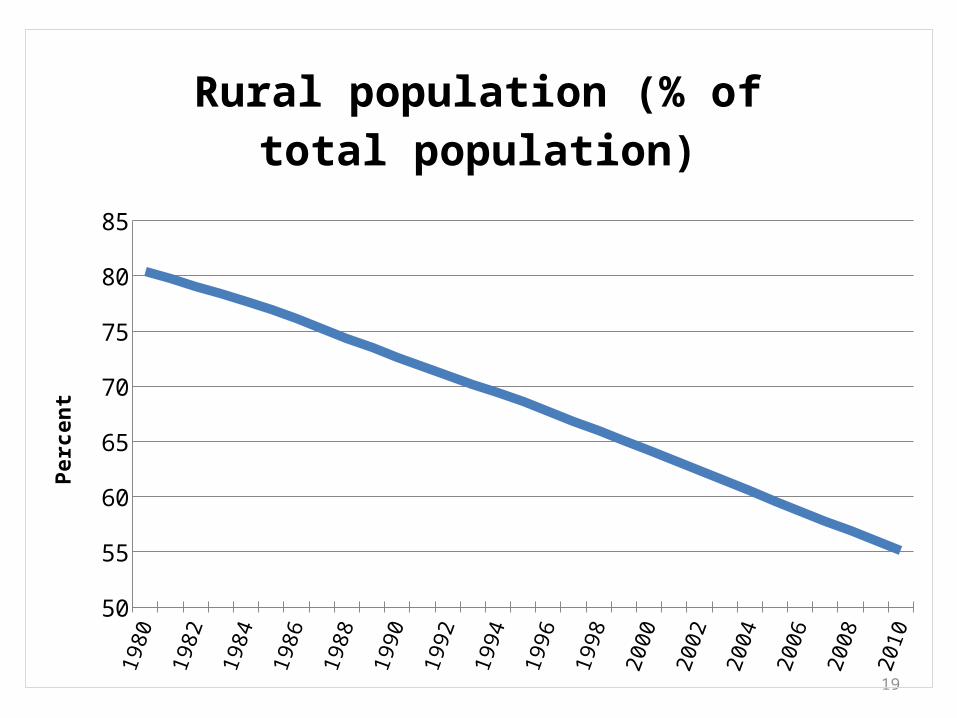
• Limitations to previous growth model– Decline in “surplus” rural labor leading
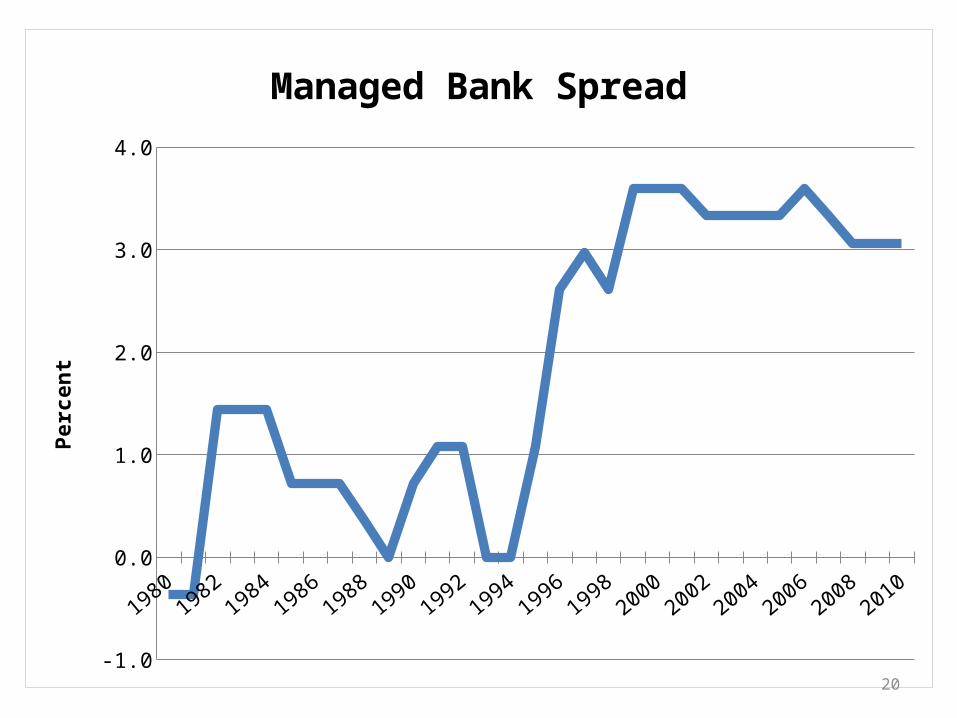
to diminishing returns to capital investments– Inefficient banking sector– Unsustainable growth in exports
17
18
19801982
19841986
19881990
19921994
19961998
20002002
20042006
20082010
-2
-1
0
1
2
3
4
5
6
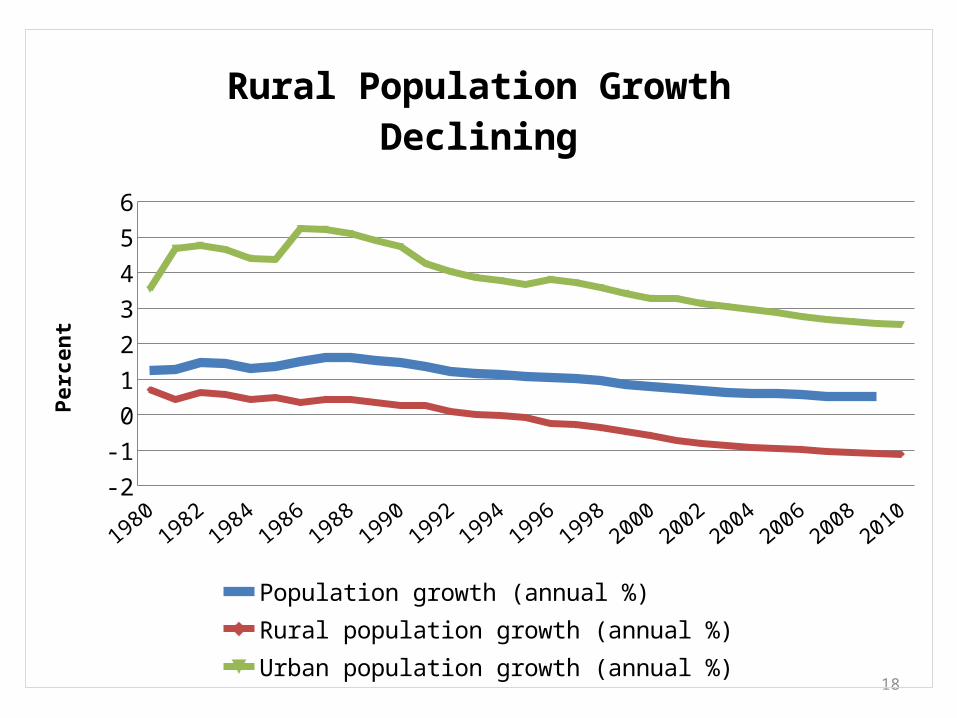
Rural Population Growth Declining
Population growth (annual %) Rural population growth (annual %)Urban population growth (annual %)
Perc
ent
19
1980
1981
1982
1983
1984
1985
1986
1987
1988
1989
1990
1991
1992
1993
1994
1995
1996
1997
1998
1999
2000
2001
2002
2003
2004
2005
2006
2007
2008
2009
2010
50
55
60
65
70
75
80
85
Rural population (% of total popula-tion)
Perc
ent
19801982
19841986
19881990
19921994
19961998
20002002
20042006
20082010
-1.0
0.0
1.0
2.0
3.0
4.0
Managed Bank SpreadPe
rcen
t
20
1980
1981
1982
1983
1984
1985
1986
1987
1988
1989
1990
1991
1992
1993
1994
1995
1996
1997
1998
1999
2000
2001
2002
2003
2004
2005
2006
2007
2008
2009
2010
-10
-8
-6
-4
-2
0
2
4
6
8
10
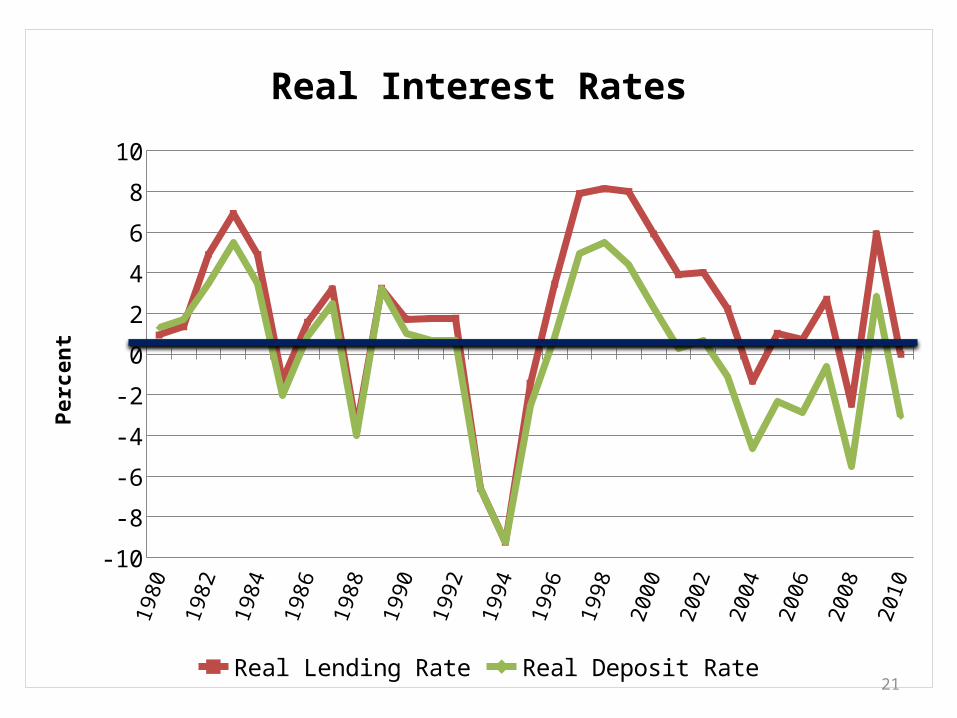
Real Interest Rates
Real Lending Rate Real Deposit Rate
Perc
ent
21

Cover In-fla-tion73%
Lose Money27%
Real Lending Rate 1980-2010
(ave. 1.94%)
Cover Inflation60%
Lose Money40%
Real Deposit Rate 1980-2010
(ave. 0.05%)
22
23
19931994
19951996
19971998
19992000
20012002
20032004
20052006
20072008
20092010
-20
-10
0
10
20
30
40
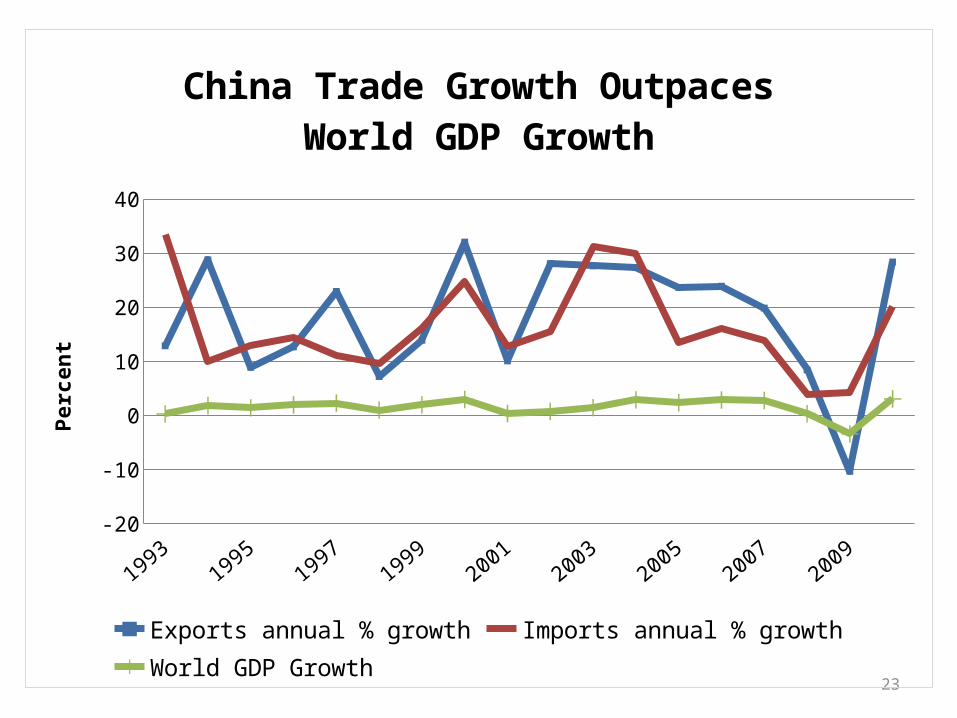
China Trade Growth Outpaces World GDP Growth
Exports annual % growth Imports annual % growth World GDP Growth
Perc
ent
24
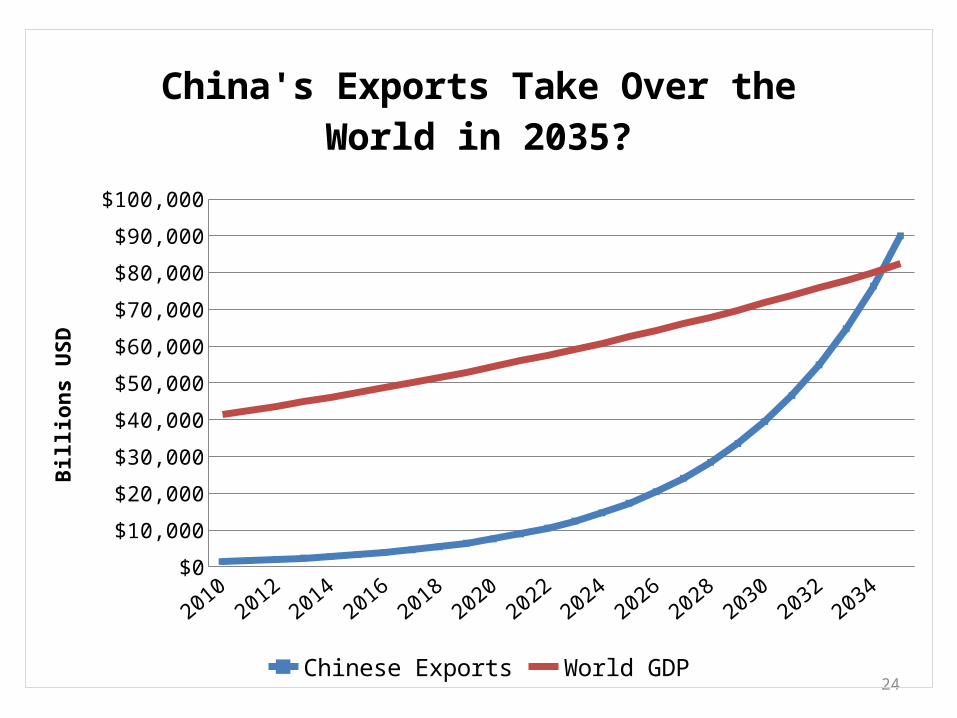
20102012
20142016
20182020
20222024
20262028
20302032
2034$0
$10,000
$20,000
$30,000
$40,000
$50,000
$60,000
$70,000
$80,000
$90,000
$100,000
China's Exports Take Over the World in 2035?
Chinese Exports World GDP
Billi
ons U
SD
Part III• Policy Recommendations– Anticipate slower future growth–Continue seeking ways to develop technology
improvements– Shift focus to developing domestic
consumption–Carefully open banking sector up to market
forces 25
Conclusions• Unparalleled period of high GDP growth driven by
investment and exports• Limitations:
– Rural population tapped out– Diminishing returns on capital investment– Inefficient banking sector– Export growth constrained by world GDP growth
• Policy Recommendations for Future Growth– Need for technological innovation– Shift focus to domestic economy– More market-oriented banking sector 26
Trade
Economic Rebalancing: Chinese Consumption
Exchange Rate
Investment
Intellectual property/ Trade Secrets
State Owned Enterprises
27
U.S.-China Economic Relations
Export Controls
Investment and “CFIUS”◦ Committee on Foreign Investment in the United
States
Infrastructure Development and Financing
Antidumping/ Countervailing Duties
28
U.S.-China Economic Relations


