56


www.ATIcourses.com
Boost Your Skills with On-Site Courses Tailored to Your Needs The Applied Technology Institute specializes in training programs for technical professionals. Our courses keep you current in the state-of-the-art technology that is essential to keep your company on the cutting edge in today’s highly competitive marketplace. Since 1984, ATI has earned the trust of training departments nationwide, and has presented on-site training at the major Navy, Air Force and NASA centers, and for a large number of contractors. Our training increases effectiveness and productivity. Learn from the proven best. For a Free On-Site Quote Visit Us At: http://www.ATIcourses.com/free_onsite_quote.asp For Our Current Public Course Schedule Go To: http://www.ATIcourses.com/schedule.htm

page 1

page 2
Remote Sensing Satellitesand Information Extraction
Instruction provided by;Applied Technology Institutewww. [email protected]

page 3
Instructor
Barry Haack George Mason University Department of Geography and Geoinformation
Science MSN 6C3 Fairfax, VA 22030 Phone 703 993 1215 E-mail [email protected]

page 4
Objectives and Outline
Definitions\vocabulary\concepts of RS Current status of satellite RS Information extraction methods RS Remote sensing links with GIS Case studies

page 5
Case Studies
Omo River Delta Growth – Kenya Agriculture and Change – Afghanistan Mapping and Monitoring Urban Growth – Nepal Land Use Mapping and Change – Mt. Everest Ratio Estimation for Rice – Bangladesh Radar and Optical Data Fusion – Sudan, Nepal

page 6
Remote Sensing
Collection of information without direct contact Remote sensing primary source of spatial data Maintains a historical record of the Earth’s surface Provides current information Allows for change detection and predictive models
page 7
RS Information Extraction Methods
Visual/manual/photographic/optical from hard or soft copy products
Digital/numerical/computer/quantitativeImage enhancement Automated classification
Some hybrid or combination techniques “Art and science of remote sensing
information extraction”

page 8
Remote Sensing Roles
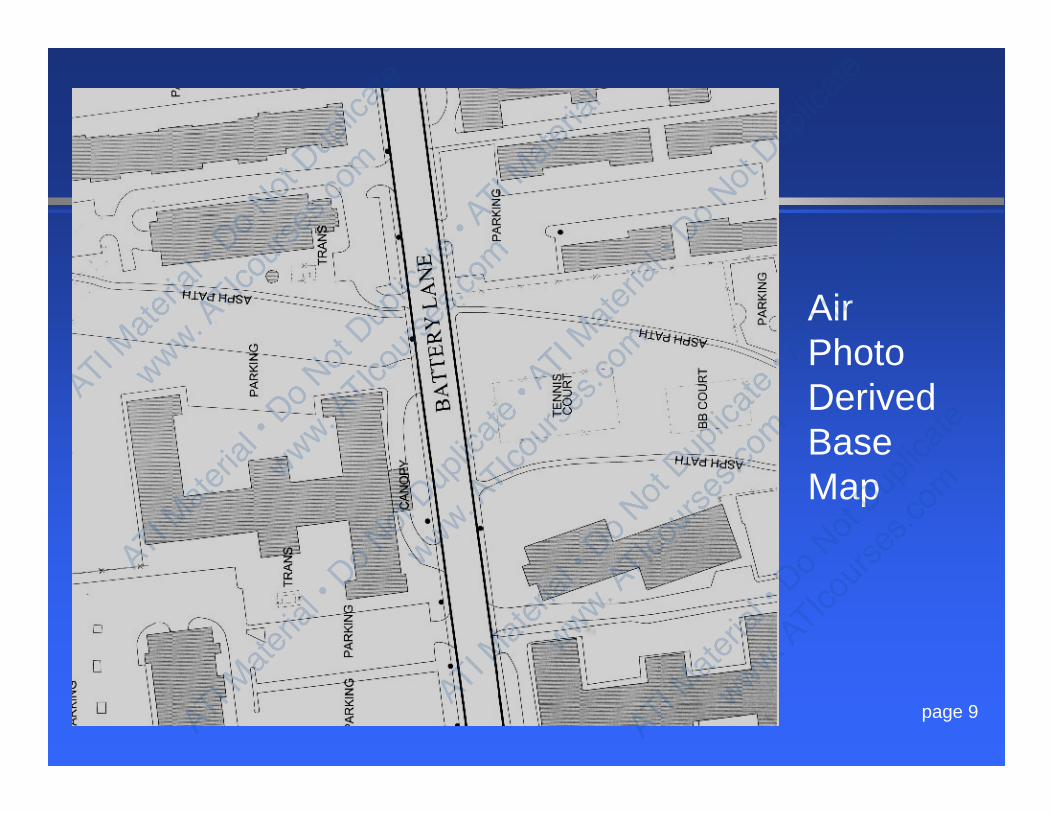
Base mapsphotogrammetric considerationsgenerally air photo based (hyperspatial -
spaceborne)great spatial detailcontours, transportation, buildings, utilities
Thematic informationsingle or multiple classesoften spatially generalizedfocus of this workshop
page 9
Air PhotoDerivedBase Map

page 10
Major Issues RS Integration to GIS
Geometric rectification to coordinate system Cartographic generalization - scale
compatibility Data structure (raster - vector) Error - accuracy

page 11
Resolution in Remote Sensing
Spatial, degree of spatial detail, meters, pixel size Spectral, number and types of energy -
wavelengths Temporal, frequency of acquisition, days or hours Radiometric, discrimination in energy recorded
(bits) Concept of resolutions useful for
remote sensing data evaluationdata specifications for informational needs

page 12
Spatial Resolution

page 13
Remote Sensing Platform
Height above surface Airborne or spaceborne Historically tradeoff - footprint and spatial resolution
low altitude, small footprint -large spatial detailhigh altitude, synoptic view - low spatial detail
Exceptions in national assets\intelligence data and recent spaceborne systems

page 14
Remote SensingPlatform Tradeoff;Spatial ResolutionvsFootprint/SynopticCoverage

page 15
Electromagnetic Spectrum
Classified by wavelength and frequency Inverse relationship - wavelength and frequency Wavelengths in micrometers (one one-millionth
meter) Reflected or emitted energy
.04 .4 .5 .6 .7 1.5 4.5 300 1multraviolet visible infrared microwave
B G R near mid thermal radar

page 16
Electromagnetic Spectrum
page 17
Energy Flow Profile Energy source Source to surface Interaction at surface Surface to sensor Sensor to user

page 18
Solar irradiance
Reflectance from study area,
Various Paths of Satellite Received Radiance
Diffuse sky irradiance
Total radiance at the sensor
L L
L
Reflectance from neighboring area,
1
2
3
Remote sensor
detector
Atmosphere
5
4 1,3,5
E
L
90Þ
0T
v T
0
0
v
p T
S
I
nr r
E d
ComponentsOf EFP;Wavelength,Time and Location Dependent

page 19
Selected Spectral Signatures-Reflectance Curves

page 20
Signature Extension Problem
Signatures are highly variable Signatures may not be unique Signatures may be too unique Mixed pixel problem (mixel) Signatures can not be extended over time or
space

page 21
Operational Spaceborne Remote Sensing - Classes
Medium spatial resolution multispectral (10 to 100m) Radar High spatial resolution (<10 m) Low spatial resolution multispectral (>100 m)
includes meteorological Hyperspectral

page 22
Landsat Orbit Parameters
570 mile or 920 km height 16 to 18 day repeat coverage Near polar NE to SW orbit 81 north to 81 south Sun synchronous 9:30 am Archived by global path/row location All data free from USGS – EROS since
January 2009 (~1,000,000 frames distributed)
page 23
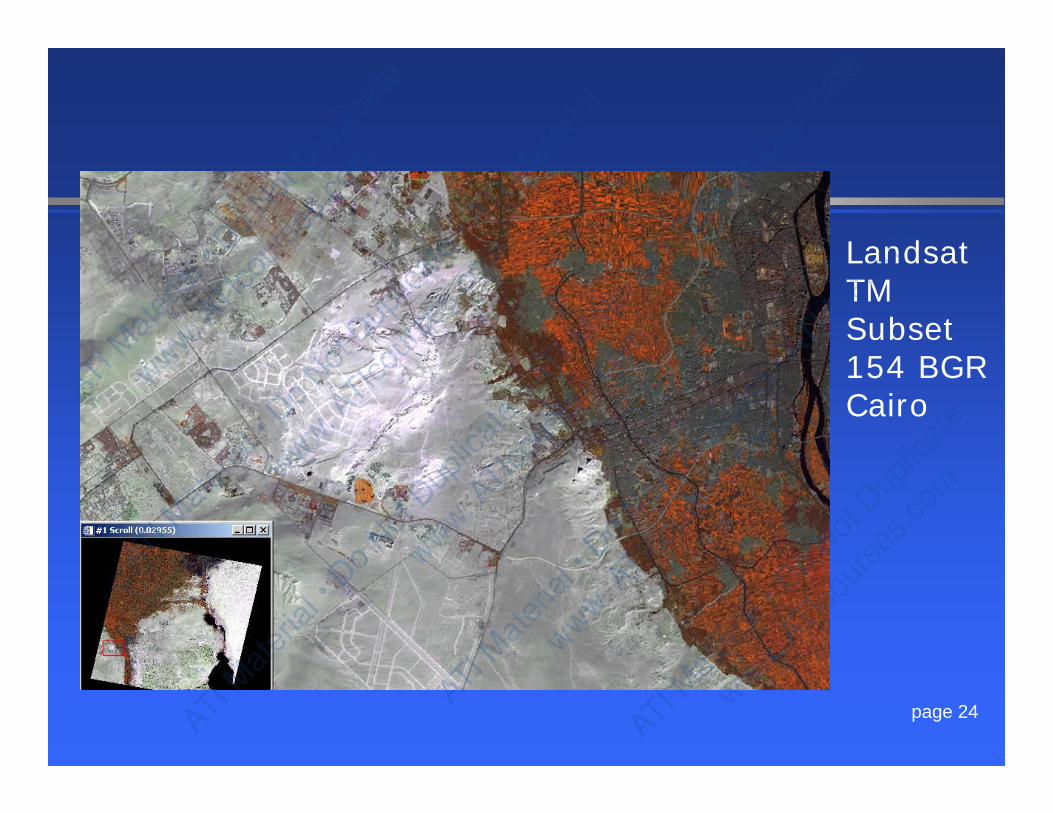
Landsat Thematic Mapper TM Since 1982, Landsats 4 and 5 Seven spectral bands, VB,VG,VR,NIR, MIR, TIR,MIR 30 meter pixel, 120 m TIR 256, 8 bit radiometric resolutionEnhanced Thematic Mapper ETM+
Landsat 7 1999Seven bandsPanchromatic band at 15m
System difficulties, May 2003, Landsat Data Continuity Mission LDCM (2011)/Data Gap?
page 24
LandsatTMSubset154 BGRCairo

page 25
SPOT French, Five since 1986, Linear array or push broom SPOTs 1 to 3 10 m panchromatic, 20 m three band multispectral 60 by 60 km format Pointable sensor, stereo - greater temporal resolution SPOT 4 1998
Added fourth MSS band (Mid IR 1.5 to 1.75) SPOT 5, 2002
2.5 and 5 m panchromatic at 60 km swath Vegetation mapper on 4 and 5 at 1km. Daily

page 26
ASTER US and Japan, 1999, research, Terra platform Advanced Spaceborne Thermal Emission and
Reflection Radiometer 14 Bands, three visible/NIR, 15 m six SWIR/MIR, 30 m five TIR, 90 m 60 km swath 5 day temporal resolution in vis/NIR stereo possible, DEM Archive exists, on-demand instrument
page 27
Advantages of Radar
Day and night Weather independent /cloud penetration Vegetation and surface penetration Determine distance IFSAR DEM
SLAR Side Looking Airborne Radar SAR Synthetic Aperture Radar

page 28
RADARSAT
Canadian 4 November 1995 launch RADARSAT 1 C-band, 5.6 cm, HH polarization Programmable incident angle, spatial
resolution, and swath/footprint Spatial resolution from 8 to 100 m Footprint from 50 x 50 km to 500 x 500 km RADARSAT 2, 2008, Quad Polarization

page 29
Fine Spatial Resolution (< 10 m) Hyperspatial
GeoEye IKONOS, 1999
.8 m panchromatic, 3.2 m three band MSS11 x 11 km footprint, 3-5 day temporal
GeoEye 1, September 2008.41 m pan, 1.6 m MSS (3 bands), 15.2 km
Digital Globe - QuickBird, 20010.6 m pan and 2.6 m MSS,1-3.5 days, 16.5 km
WorldView=1, 20070.5 m pan, 11 bit, 1.7 day revisit, 17.6 km
SPOT 5, 2002 2.5 and 5 m panchromatic, 60 km Variable costs, archive vs new acquisition,~$25 sq km

page 30
Baudhanath Stupa, NepalCorona 1967 IKONOS 2001

page 31
Statistical Nature of Digital Remote Sensing Data
One value per band per pixelMSS scene – 30 MBTM scene – 290 MBFile value vs look up table valueBand histograms and statisticsSpectral signature matching

page 32
Major Issues RS Information Extraction - Integration to GIS
Geometric rectification to coordinate system Cartographic generalization - scale
compatibility Data structure (raster - vector) Error - accuracy

page 33
Visual Image Interpretation Geometric correction
before or after interpretationcreation of mosaic/image maps
Classification system (single or multiple classes) Class definitions Minimum mapping unit (MMU) Hardcopy or softcopy data sources Conversion to GIS - direct digital, digitizing, scanning Accuracy assessment

page 34
Land Use/Land Cover;Kathmandu, Nepal

page 35
Issues of Automated Classification
Normally based only on pixel by pixel values No context/site/situation which is strength of visual Only use digital if visual inadequate Not necessarily more accurate or objective

page 36
Atmospheric Compensation
Variations in Energy Flow Profile Within scene or between scenes Signature extension problem; spatial and temporal Match sensor data to known reflectance curves Match imagery over time and space Very difficult to do effectively Often not necessary and simply ignored
(extract signature from scene)

page 37
Initial Statistical Evaluation Full study area for display, often sampling Digital Numbers (DN) Display is normally of stretched data (file vs look-up table) Assume normal distribution of data, often is not normal Histograms (often bi and multimodal) Count zeros or not in statistics? File (upper left origin) or Map (lower left origin) coordinates Basic statistics; mean, standard deviation, minimum, maximum Multivariate measures; Variance and co-variance, correlations

page 38
Sample Scene Statistics
Landsat TM , Charleston South Carolina
Band 1 2 3 4 5 7 6Mean 65 26 24 27 32 15 111Std.Dev 10 6 8 16 24 12 4Min 51 17 14 4 0 0 90`Max 242 115 131 105 193 128 130

page 39
Geometric Rectification (1) Often can be vendor supplied Registration to other data (scene to scene, no coordinate base) Rectification to coordinate system Two or three dimensional (often two dimensional, ortho X, Y and Z) Select coordinate system (UTM, Lat/Long, State Plane) Select geoid datum; NAD27,NAD83, WGS84 etc. Use of Ground Control Points (GCPs)
Sources; base map, other image, GPS Select order of transformation (First, Second, Third, etc.)
First order adequate for Landsat Second order for off-nadir such as SPOTThird and higher, rubber sheeting for greater distortions
page 40
Geometric 2 Evaluate transformation based on Root Mean Square
(RMS) errorOverall and per point, measured in pixel resolutionRMS under 1 desirable and possible
Options to reduce high RMSDelete GGPsAdd GCPsIncrease order of transformation
Balance order, GCPs and RMSFewer GCPs always better RMS
Apply transformation, change pixel size, spatial resolutionRadiometric resampling

page 41
Automated Classification -1 Signature matching process Pixel or object oriented Difficulties
signature not unique for given sensorsignature too unique (10 corn fields, 10 signatures) mixed pixels (unmixing with simple covers)atmospheric changes, signature extension issue
page 42
Automated Classification -2
Signature extractiontraining sites or supervisedclustering or unsupervised
Application of a decision rule Accuracy assessment Spatial filtering for GIS compatibility

page 43
Signature Extraction
Most important aspect, poor signatures always poor results (Garbage in – Garbage out)
From analysis data set Possibly stratify study area Supervised or unsupervised

page 44
Supervised Signatures
Training (Calibration) sites (Areas of Interest AOI) Prior knowledge of data Multiple sites per class Minimum size (10 x number of bands) normally much
larger Use of seed pixel with spatial and spectral constraints

page 45
Unsupervised Signatuure Extraction or Clustering
Locates pixels of similar spectral characteristics Analyst defined number of clusters Minimum three times number of expected cover types Sometimes hundreds (splitters or lumpers) Many clusters insignificant or mixed pixels Analyst must identify class for each cluster
Hybrid (combination of supervised and unsupervised)
page 46
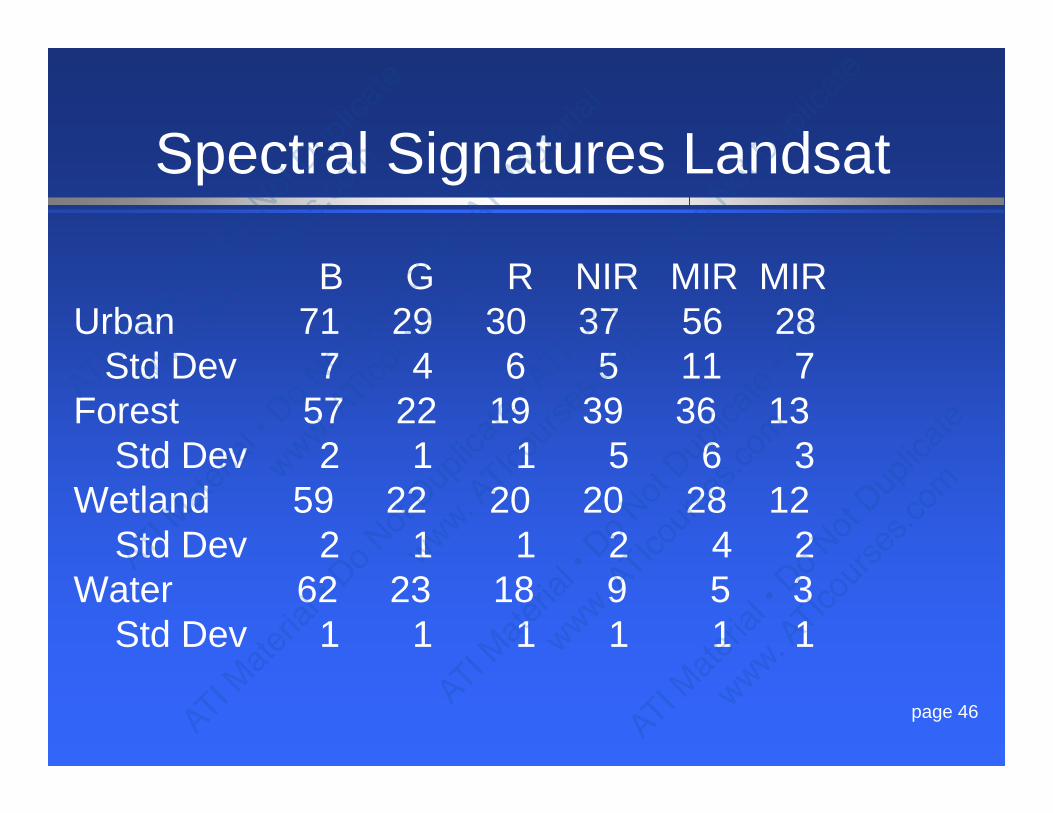
Spectral Signatures Landsat
B G R NIR MIR MIRUrban 71 29 30 37 56 28
Std Dev 7 4 6 5 11 7Forest 57 22 19 39 36 13
Std Dev 2 1 1 5 6 3Wetland 59 22 20 20 28 12
Std Dev 2 1 1 2 4 2Water 62 23 18 9 5 3
Std Dev 1 1 1 1 1 1

page 47
Accuracy Assessment (1)
Locational and thematic Extremely important - visual and digital extraction Spatial data without accuracy of questionable value Accuracy should be a component of metadata Very difficult and often avoided, embarrassing Expensive

page 48
Accuracy Assessment (2)
Temporal differences often a constraint Classification the most difficult to evaluate,
definitional in part Major difficulty is identification of ‘truth’
(Validation) Best if validation at time of data acquisition Truth must be different from training sites
page 49
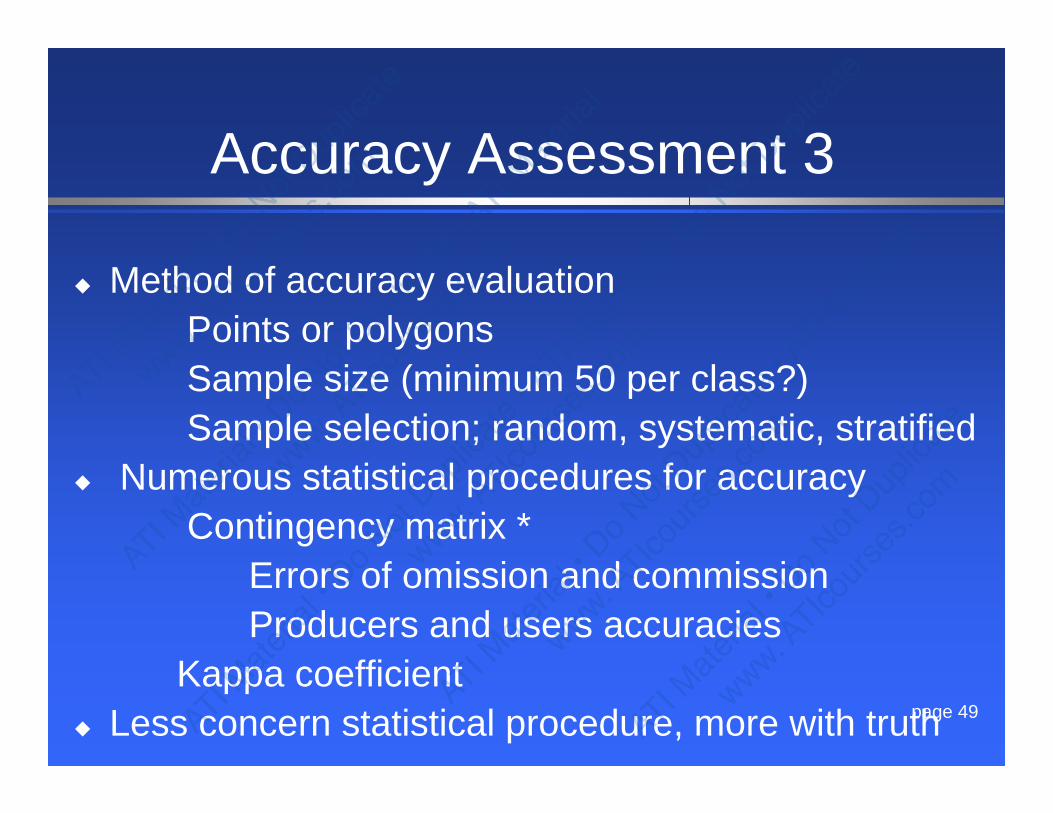
Accuracy Assessment 3
Method of accuracy evaluationPoints or polygonsSample size (minimum 50 per class?)Sample selection; random, systematic, stratified
Numerous statistical procedures for accuracyContingency matrix *
Errors of omission and commissionProducers and users accuracies
Kappa coefficient Less concern statistical procedure, more with truth

page 50
Contingency Table Sudan
Urban Veg Other Totals Users %Urban 15,248 335 1,502 17,085 89.2Agriculture 2,012 3,015 1,159 6,186 48.7Other 934 200 21,961 23,095 95.0Totals 18,194 3,551 24,622 46,367Producers % 83.8% 84.9% 89.2%
Correctly Identified Pixels 40,225/46,367 = 86.8%

page 51
Methods to Improve Information Extraction 1
Change data inputDifferent sensorDifferent dateMultitemporalMultisensorContext, textureAncillary data, GIS

page 52
Methods to Improve Information Extraction 2
Change processing strategiesBetter signaturesChange decision rule, hierarchicalNeural networks, AI, expert systems,
fuzzy logic, regression treesCART
page 53
Conclusions
Multiple RS platforms and sensors in future Importance of date of RS data and field work Visual information extraction before digital Accuracy assessments required RS and GIS integration is two directional Art and science of RS, visual and digital
Thank you!


