41
Welcome to OBIEE Hands-On Workshop 5 Steps to facilitate the Consumer Author Transition OBIEE Platform Training Bucharest, 05 april 2017 Trainer: Elena Unciuleanu Company: Reporting Center

Welcome to OBIEE
Hands-On Workshop
5 Steps to facilitate the Consumer Author Transition
OBIEE Platform Training
Bucharest, 05 april 2017
Trainer: Elena Unciuleanu
Company: Reporting Center

1
Contents
Login to OBIEE ................................................................................................................................................................... 2
Step 1: How to Create a Folder Catalog .................................................................................................................. 2
Step 2: How to Create a Dashboard .......................................................................................................................... 4
Step 3: How to Create an Analysis .......................................................................................................................... 12
Feature: Multiple Sort ........................................................................................................................................... 14
Feature: Create Sections ...................................................................................................................................... 20
Feature: Drill-Down based on Hierarchy ....................................................................................................... 21
Feature: Create Graph Object ............................................................................................................................ 26
Feature: Create Pie Object .................................................................................................................................. 28
Step 4: How to Create a Dashboard Prompt ....................................................................................................... 31
Step 5: How to add items to a Dashboard ........................................................................................................... 34
Review the results .................................................................................................................................................. 37
Ready to get started? ................................................................................................................................................... 40
Learn More .................................................................................................................................................................. 40

2
Link: http://153.92.37.173:9502/analytics
User, Pass: there will be used the trainer indications
1. Go to Catalog Shared Folders Training
2. Click on Training folder.
3. Click on New Folder to create a subfolder in Training. Name the subfolder Bank prefix_
your initials (ex.: ALPH_AG, BPST_OC, OTPB_OS).
3
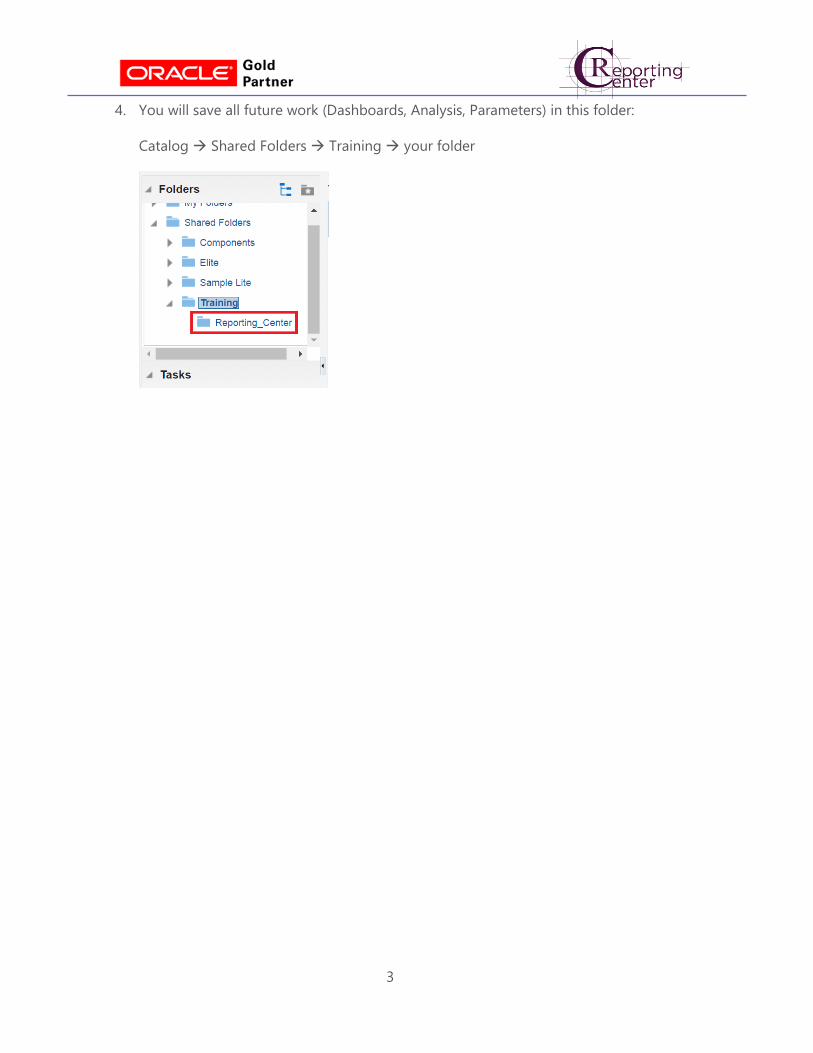
4. You will save all future work (Dashboards, Analysis, Parameters) in this folder:
Catalog Shared Folders Training your folder

4
5. Click Home
6. Go to New Dashboard
7. Name the Dashboard BANK prefix _ Your Initials _ Dashboard
8. Click the drop-down for Location
9. Click Browse Catalog

5
10. Choose your folder. Click OK
11. Click OK
12. You have an empty Dashboard

6
13. Let’s add 4 pages / tabs to the Dashboard (General Parameters, Trail Balance, Drill Down,
Graphs)
14. Click “+” button
15. Add Trial Balance tab
16. Click Ok.
17. Notice the tab was positioned after the Default tab.

7
18. Repeat steps 14-16 to add other tabs named: Drill-Down and Graphs
19. Let’s rename the first default tab to General Parameters
20. Go to Tools Dashboard Properties
21. Select page 1 record and then click Rename button.

8
22. Rename to General Parameters
23. Click Ok twice
24. Notice all tabs have names
25. Let’s change the tabs order
26. Go to Tools Dashboard Properties
27. Click on Trial Balance record
28. Press up arrow
9
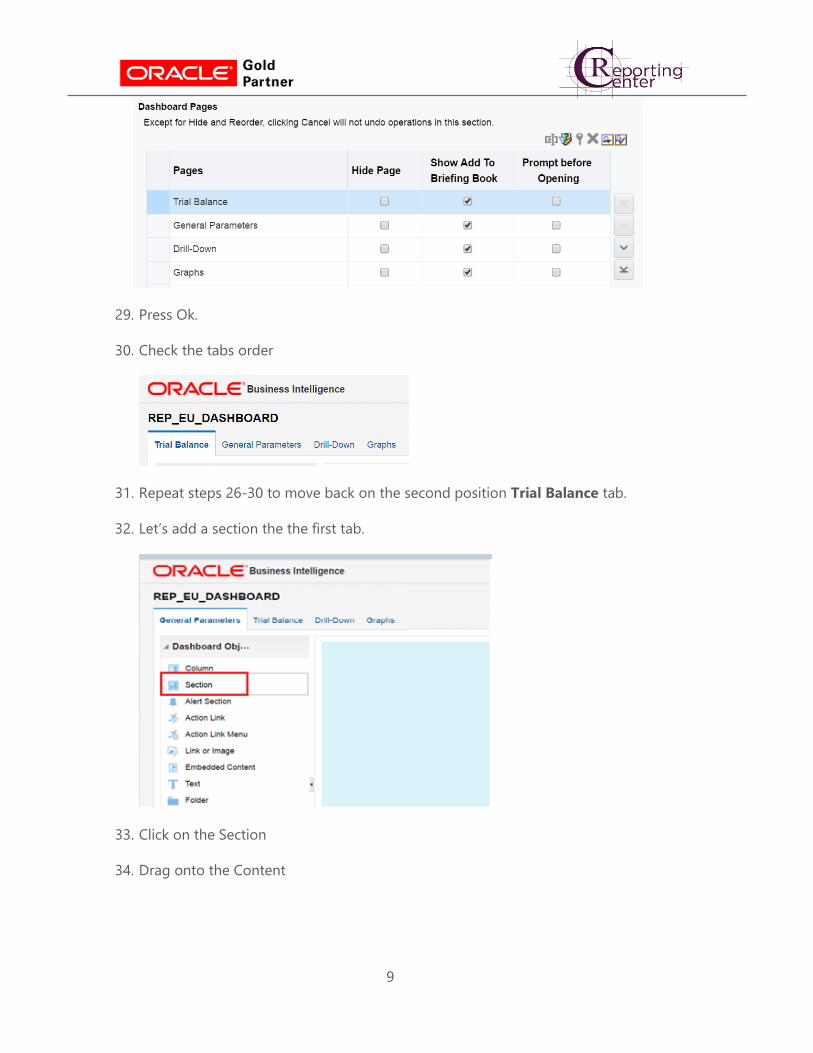
29. Press Ok.
30. Check the tabs order
31. Repeat steps 26-30 to move back on the second position Trial Balance tab.
32. Let’s add a section the the first tab.
33. Click on the Section
34. Drag onto the Content

10
35. Click Save
36. Repeat steps 33-35 to add two sections in Trial Balance and one section in Drill-Down
37. Click Save after each tab.
11
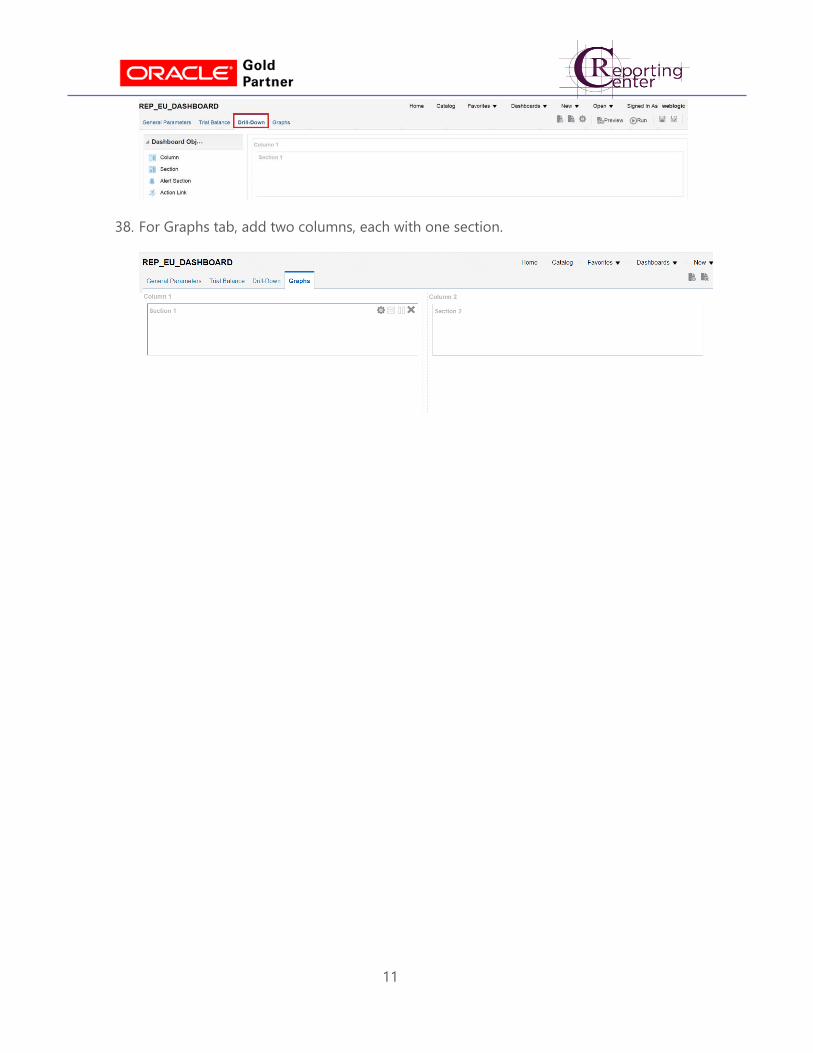
38. For Graphs tab, add two columns, each with one section.

12
3: How to Create an Analysis
39. Go to New Analysis
40. Choose ELITE Subject Area
41. Double-click on the following columns from “Balances” table:
42. Add filter on “Ref_Date”

13
43. Select Add More Options Presentation Variable
44. Set p_ref_date as the Presentation Variable with implicit value “2/28/2017”.
45. Click OK
46. Follow steps 42-44 to add filter on “Version No”.

14
Feature: Multiple Sort
47. Sort values by GL, GL Contract, GL Init, GL Contract Init.

15
48. Repeat step 47 to sort columns GL Init, GL Contract Init
49. Let’s rename the column “BALANCE_EQ” to “Balance (RON equivalent)”
50. Click on Properties Column Properties
51. Go to “Column Format” tab and check “Custom Headings”.
52. Type “Balance (RON equivalent)” in “Column Heading” field.
16
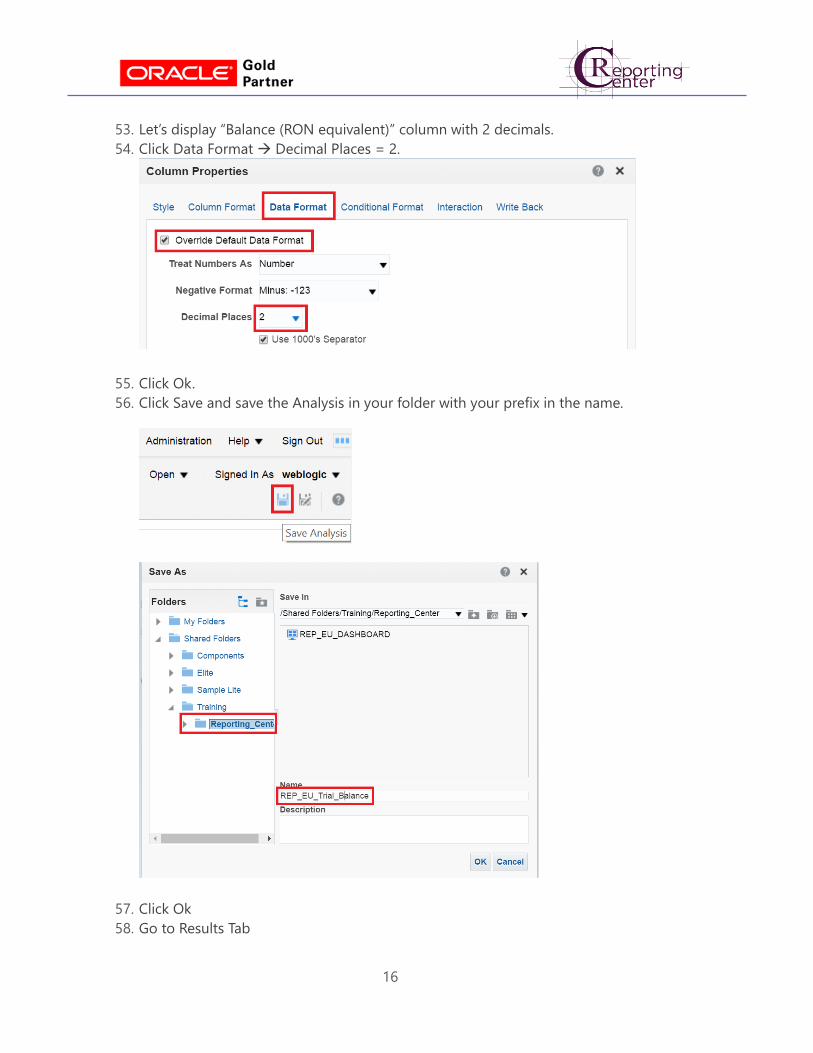
53. Let’s display “Balance (RON equivalent)” column with 2 decimals.
54. Click Data Format Decimal Places = 2.
55. Click Ok.
56. Click Save and save the Analysis in your folder with your prefix in the name.
57. Click Ok
58. Go to Results Tab

17
59. Edit the Title (select the Title and click on the Pencil)
60. Uncheck Display Saved Name
61. Fill the title with: “Trial Balance” and subtitle with: “Ref date = @{p_ref_date}; Version =
@{p_version_no}”
62. Click Done
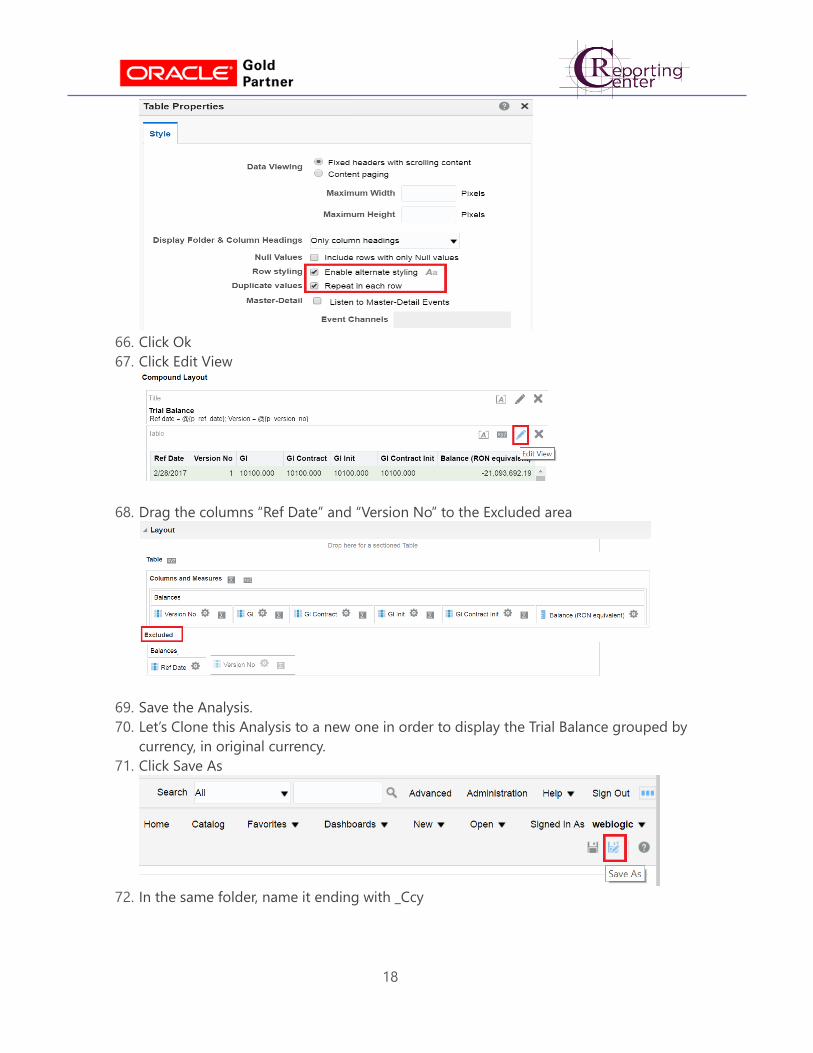
63. Let’s alternate the color of the rows
64. Click View Properties (Results tab)
65. Check Enable alternate styling and Repeat in each row
18
66. Click Ok
67. Click Edit View
68. Drag the columns “Ref Date” and “Version No” to the Excluded area
69. Save the Analysis.
70. Let’s Clone this Analysis to a new one in order to display the Trial Balance grouped by
currency, in original currency.
71. Click Save As
72. In the same folder, name it ending with _Ccy

19
73. Click Ok
74. Go to Criteria
75. Double click on “Balance” and “Currency” columns from “Balances” in order to select them
in the report
76. Delete columns GL Contract, Gl Init, Gl Contract Init, Balance(RON equivalent) from the
view
77. Sort by GL and Currency

20
78. Click Save
79. Go to Results tab
80. Edit View
Feature: Create Sections
81. Drag the “Currency” column in the Sections area
82. Add Totals after each Currency

21
83. Click Done
84. Click Save
Feature: Drill-Down based on Hierarchy
85. Click New Analysis ELITE
86. In “Criteria” tab, double click on the following columns from “Balances” (Ref date, Version
No, Balance) and “GL” (GL Hierarchy) tables:
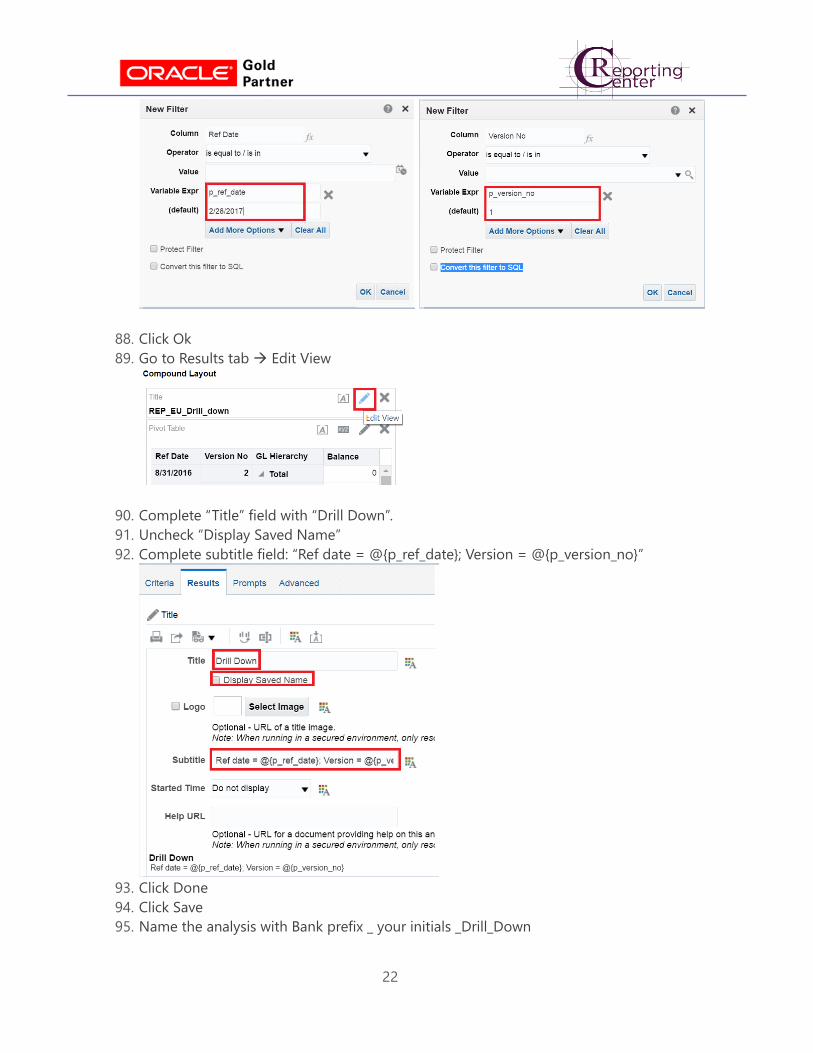
87. Add filter on “Ref Date” and “Version no”
22
88. Click Ok
89. Go to Results tab Edit View
90. Complete “Title” field with “Drill Down”.
91. Uncheck “Display Saved Name”
92. Complete subtitle field: “Ref date = @{p_ref_date}; Version = @{p_version_no}”
93. Click Done
94. Click Save
95. Name the analysis with Bank prefix _ your initials _Drill_Down

23
96. Click New Analysis ELITE
97. In “Criteria” tab, double click on the following columns from “Balances” and “GL” tables:
98. Add filter on “Ref Date” and “Version No”:
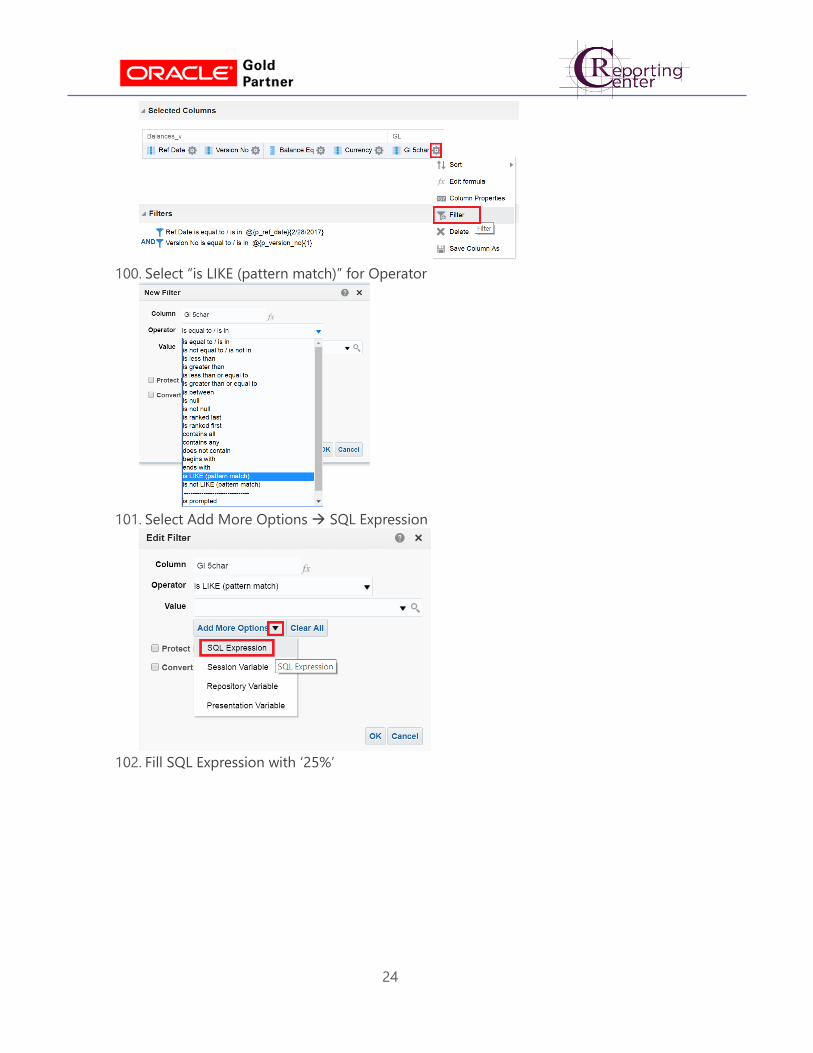
99. Add filter on “Gl 5char” column:
24
100. Select “is LIKE (pattern match)” for Operator
101. Select Add More Options SQL Expression
102. Fill SQL Expression with ‘25%’

25
103. Click OK
104. Repeat steps 99-101 to add another filter on “Gl 5char” as “GL 5char not Like ‘25_7%’
105. Go to Results tab and remove Table from Views Panel

26
Feature: Create Graph Object
106. Click the “New View” Graph Bar Recommended Subtype
107. Click on Edit button for Title field
108. Fill Title and Subtitle fields as below.
109. Click OK

27
110. Click “Edit View” button
111. Move columns “Ref Date” and “Version No’ to “Excluded” area
112. Move column “Currency” to Bars section Vary Color By section. Check “Show in
legend”
113. Move column “Gl 5 char” to Sections
114. Click Done
115. Click Save
116. Name analysis with “Prefix_Balance_Bar”.

28
Feature: Create Pie Object
117. Clone last Analysis
118. Name it with “_Pie” instead of “_Bar”

29
119. Go to Results tab Views select Graph Show More buttons Remove View from
Analysis
120. Add new Pie: New View Graph Pie
121. Rename Title to “Balance Pie”
122. Edit View

30
123. Move “Ref Date” and “Version No” to Excluded area.
124. Move column “Gl 5char” to “Sections”, Balance eq to Slice Size and Currency to Slices:
125. Click Done
126. Click Save Analysis

31
4: How to Create a Dashboard Prompt
127. Go to New Dashboard Prompt ELITE
128. Click “+” button Column Prompt Data Versions Ref Date
129. Click Ok

32
130. Expand Options section and check “Require user input”.
131. From “Set a variable” menu, select “Presentation Variable”
132. Set the Presentation Variable to p_ref_date
133. Click Ok
134. Repeat steps 128-131 for Data Versions Version No column.
135. In addition, select “Ref Date” from “Limit values by” menu
33
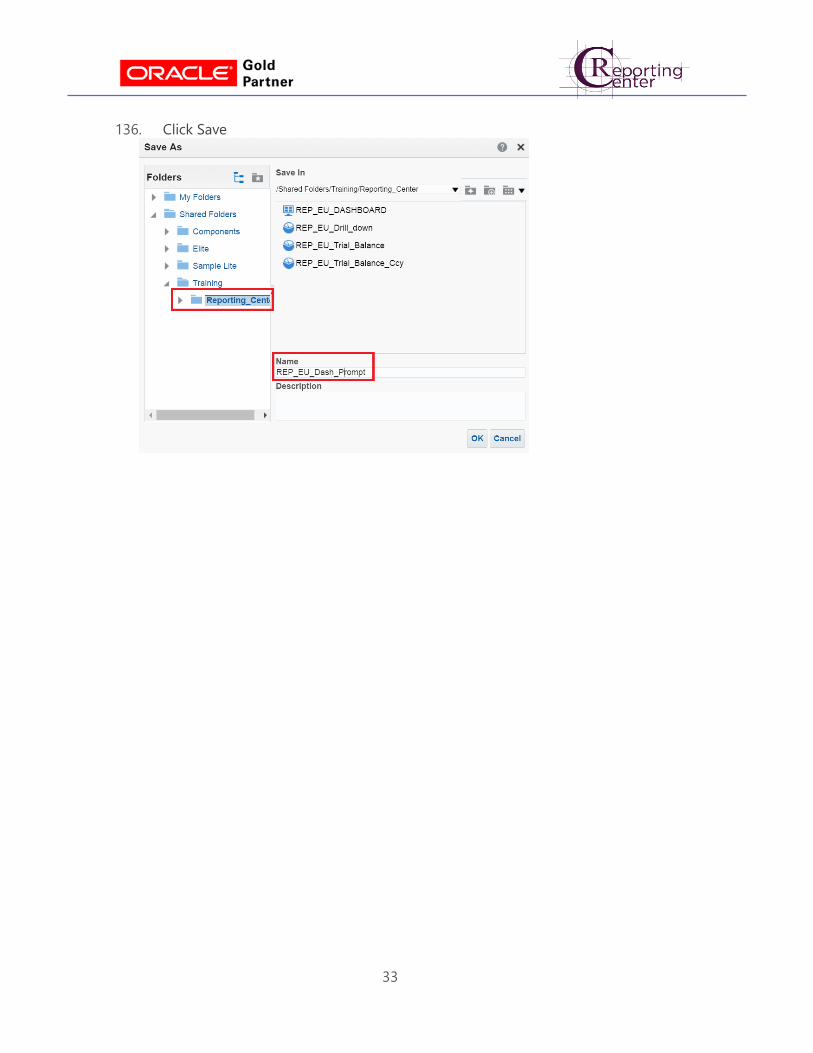
136. Click Save

34
5: How to add items to a Dashboard
137. Go to Catalog Shared Folders Training your folder
138. Click Edit on the Dashboard
139. Click Tools Dashboard Properties
140. Click on Edit button near field “Dashboard Report Links”
141. Check Export, Copy, Refresh, Print

35
142. Click Ok
143. Click Save
144. Drag the Dashboard Parameter (_Dash_Prompt) in Section 1 from General Parameters
tab
145. Click Section Properties Drill in Place

36
146. Click Save
147. Go to Trial Balance tab
148. Drag the Trial Balance Analyses, each in a Section
149. Check Drill in place for each section
150. Click Save
151. Go to Drill-Down tab
152. Drag the Drill-Down Analysis
153. Check Drill in Place
154. Click Save
155. Go to Graphs tab and drag the _Balance_Bar and _Balance_Pie Analyses, each in a
Section

37
156. Click Save
157. Go to First tab
158. Click Favorites Add to Favorites
Review the results
159. Click on the Link to see the Results!
160. Go to “General Parameters” tab and select value “02/28/2017” for Ref Date and “1” for
Version No
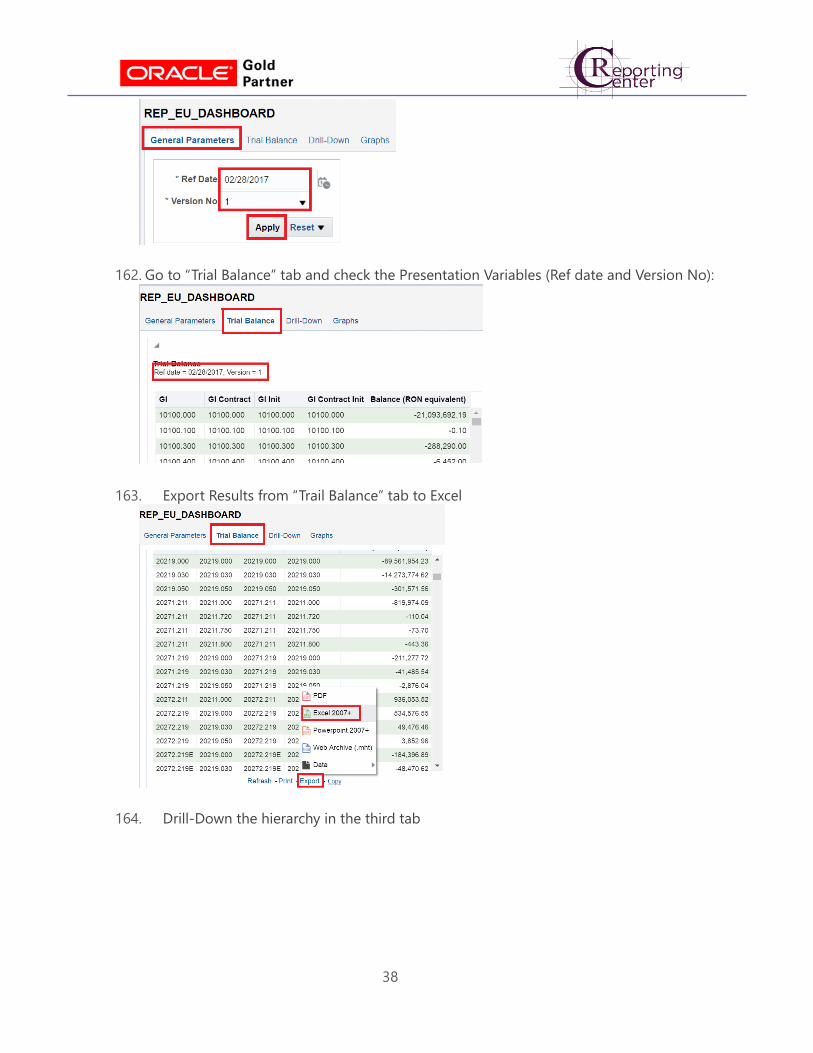
161. Click Apply button
38
162. Go to “Trial Balance” tab and check the Presentation Variables (Ref date and Version No):
163. Export Results from “Trail Balance” tab to Excel
164. Drill-Down the hierarchy in the third tab

39
165. Analise graphs from last tab

40
Ready to get started? We hope you enjoy working with OBIEE Platform!
Sincerely,
Elena Unciuleanu & Reporting Center Team
Contact me at: [email protected]
Learn More Keep going. There are lots more new features and ways to work in OBIEEs. Check out our
training materials & manuals to dive right in.
http://reportingcenter.ro/docs/OBIEE_Training_Material_5thApril2017.pdf


