48
Welcome to PHRM 231 Study Design and Interpretation - Part 2 Handouts are on CONNECT All sessions will be recorded

Welcome to PHRM 231
Study Design and Interpretation - Part 2
Handouts are on CONNECT All sessions will be recorded

AY2T1 STUDYDESIGNANDINTERPRETATIONIIPHARM231(2CREDITS)
ALLCLASSES1:00-3:00pre>ymucheveryotherFriday
22-Sep A Stats Bias Re-cap, Hill's criteria and how to use it in practice JM
29-Sep Non-inferiority RCTs PL
03-Nov Cohort/case-control studies JM
17-Nov Screening and diagnostic tests - Bayesian thinking ML,JM
24-Nov Analytical methods to reduce confounding - regression/stratification MS
01-Dec Lab Values/Clinical Practice Guidelines JM
AY2T2
12-Jan Clinical Prediction Rules JM
26-Jan Principles of health economics and economic evaluation in health care MS
02-Feb Methods of cost-effectiveness analysis - part 1 MS
02-Mar Methods of cost-effectiveness analysis - part 2 MS
16-Mar Conflict of interest - principles and approaches PL,JM
23-Mar How to speak to patients about evidence JM
JM - James McCormack, PL - Peter Loewen, ML - Marc Levine, MS - Mohsen Sadatsafavi

Course Assessment
Create a Tools For Practice (TFP) - 30%
Take-home, in-class assignments - 10-20%
Final - 50-60%
IA - Evidence appraisal practice - no marks but you have to attend
Tools for Practice is proudly sponsored by the Alberta College of Family Physicians (ACFP). ACFP is a provincial, professional voluntary organization, representing more than 4,400 family physicians, family medicine residents and medical students in Alberta. Established over sixty years ago, the ACFP strives for excellence in family practice through advocacy, continuing medical education and primary care research. www.acfp.ca
August 15, 2016
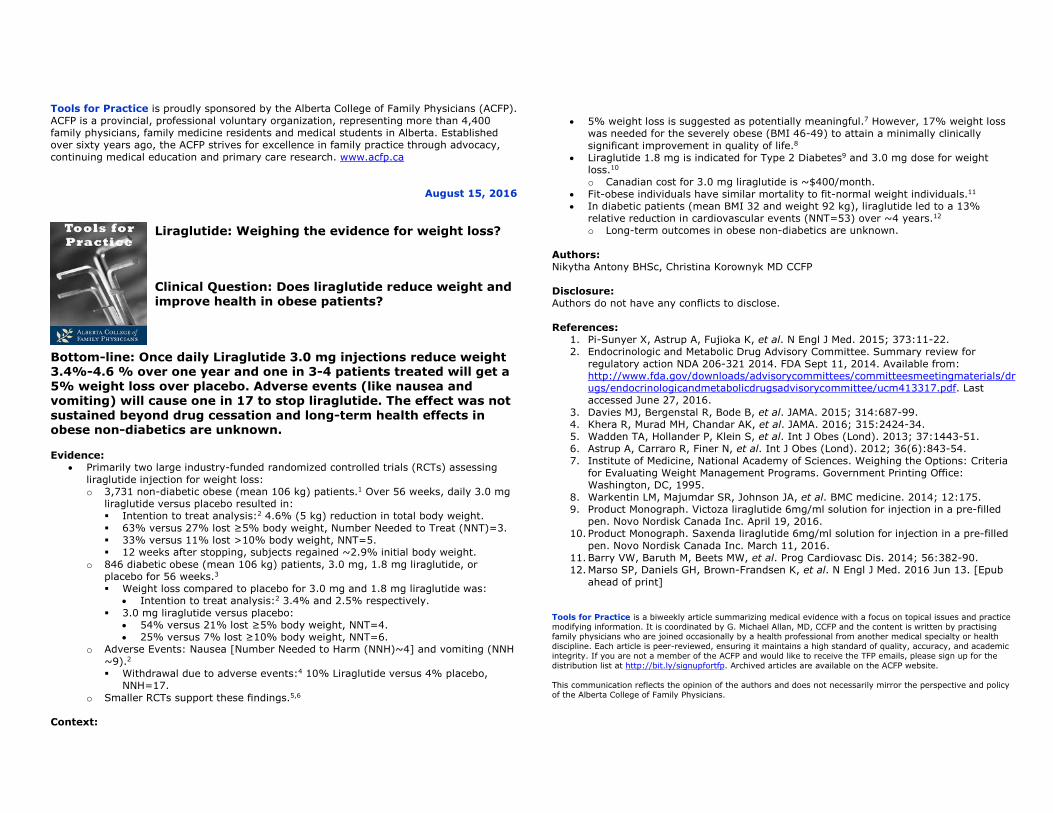
Liraglutide: Weighing the evidence for weight loss? Clinical Question: Does liraglutide reduce weight and improve health in obese patients?
Bottom-line: Once daily Liraglutide 3.0 mg injections reduce weight 3.4%-4.6 % over one year and one in 3-4 patients treated will get a 5% weight loss over placebo. Adverse events (like nausea and vomiting) will cause one in 17 to stop liraglutide. The effect was not sustained beyond drug cessation and long-term health effects in obese non-diabetics are unknown. Evidence:
• Primarily two large industry-funded randomized controlled trials (RCTs) assessing liraglutide injection for weight loss: o 3,731 non-diabetic obese (mean 106 kg) patients.1 Over 56 weeks, daily 3.0 mg
liraglutide versus placebo resulted in: � Intention to treat analysis:2 4.6% (5 kg) reduction in total body weight. � 63% versus 27% lost ≥5% body weight, Number Needed to Treat (NNT)=3. � 33% versus 11% lost >10% body weight, NNT=5. � 12 weeks after stopping, subjects regained ~2.9% initial body weight.
o 846 diabetic obese (mean 106 kg) patients, 3.0 mg, 1.8 mg liraglutide, or placebo for 56 weeks.3 � Weight loss compared to placebo for 3.0 mg and 1.8 mg liraglutide was:
• Intention to treat analysis:2 3.4% and 2.5% respectively. � 3.0 mg liraglutide versus placebo:
• 54% versus 21% lost ≥5% body weight, NNT=4. • 25% versus 7% lost ≥10% body weight, NNT=6.
o Adverse Events: Nausea [Number Needed to Harm (NNH)~4] and vomiting (NNH ~9).2 � Withdrawal due to adverse events:4 10% Liraglutide versus 4% placebo,
NNH=17. o Smaller RCTs support these findings.5,6
Context:
• 5% weight loss is suggested as potentially meaningful.7 However, 17% weight loss was needed for the severely obese (BMI 46-49) to attain a minimally clinically significant improvement in quality of life.8
• Liraglutide 1.8 mg is indicated for Type 2 Diabetes9 and 3.0 mg dose for weight loss.10 o Canadian cost for 3.0 mg liraglutide is ~$400/month.
• Fit-obese individuals have similar mortality to fit-normal weight individuals.11 • In diabetic patients (mean BMI 32 and weight 92 kg), liraglutide led to a 13%
relative reduction in cardiovascular events (NNT=53) over ~4 years.12 o Long-term outcomes in obese non-diabetics are unknown.
Authors: Nikytha Antony BHSc, Christina Korownyk MD CCFP Disclosure: Authors do not have any conflicts to disclose. References:
1. Pi-Sunyer X, Astrup A, Fujioka K, et al. N Engl J Med. 2015; 373:11-22. 2. Endocrinologic and Metabolic Drug Advisory Committee. Summary review for
regulatory action NDA 206-321 2014. FDA Sept 11, 2014. Available from: http://www.fda.gov/downloads/advisorycommittees/committeesmeetingmaterials/drugs/endocrinologicandmetabolicdrugsadvisorycommittee/ucm413317.pdf. Last accessed June 27, 2016.
3. Davies MJ, Bergenstal R, Bode B, et al. JAMA. 2015; 314:687-99. 4. Khera R, Murad MH, Chandar AK, et al. JAMA. 2016; 315:2424-34. 5. Wadden TA, Hollander P, Klein S, et al. Int J Obes (Lond). 2013; 37:1443-51. 6. Astrup A, Carraro R, Finer N, et al. Int J Obes (Lond). 2012; 36(6):843-54. 7. Institute of Medicine, National Academy of Sciences. Weighing the Options: Criteria
for Evaluating Weight Management Programs. Government Printing Office: Washington, DC, 1995.
8. Warkentin LM, Majumdar SR, Johnson JA, et al. BMC medicine. 2014; 12:175. 9. Product Monograph. Victoza liraglutide 6mg/ml solution for injection in a pre-filled
pen. Novo Nordisk Canada Inc. April 19, 2016. 10. Product Monograph. Saxenda liraglutide 6mg/ml solution for injection in a pre-filled
pen. Novo Nordisk Canada Inc. March 11, 2016. 11. Barry VW, Baruth M, Beets MW, et al. Prog Cardiovasc Dis. 2014; 56:382-90. 12. Marso SP, Daniels GH, Brown-Frandsen K, et al. N Engl J Med. 2016 Jun 13. [Epub
ahead of print] Tools for Practice is a biweekly article summarizing medical evidence with a focus on topical issues and practice modifying information. It is coordinated by G. Michael Allan, MD, CCFP and the content is written by practising family physicians who are joined occasionally by a health professional from another medical specialty or health discipline. Each article is peer-reviewed, ensuring it maintains a high standard of quality, accuracy, and academic integrity. If you are not a member of the ACFP and would like to receive the TFP emails, please sign up for the distribution list at http://bit.ly/signupfortfp. Archived articles are available on the ACFP website. This communication reflects the opinion of the authors and does not necessarily mirror the perspective and policy of the Alberta College of Family Physicians.

TFPs are divided into four sections https://www.acfp.ca/tools-for-practice/
AuthorsQuestion
Evidence
Context
Bottom-line
References - no more than 10
Authors perform a search of Medline-PubMed and frequently Google scholar. They also review guidelines and track references or cited articles. Relevant studies are then critically appraised and summarized as much as possible into the Evidence section.
The Evidence section starts, whenever possible, with the highest levels of evidence (Systematic Review & Meta-analysis and/or Randomized Controlled Trials).
The Context section includes limitations of the evidence, weaker evidence (e.g. cohort or case-control studies) related to the question, guidelines, and important aspects of application.
The Bottom-line is a plain language summary to address the question and provide clinicians a focused answer for the clinical issue.
Tools for practice are targeted to be 300 words (without title or references) and have a maximum limit of 350 words. Citations are done in abbreviated style - journal, year, volume, and pages.

Tools For PracticeQuestion/Topic Selection
All questions must be focused and clear and the topics must have a broad or large application to clinical practice. Topics are selected by a variety of mechanisms including recent issues in the news (e.g. CCSVI surgery for MS), emerging evidence (e.g. cardiovascular risks of calcium), new products with primary care impact (e.g. Dabigatran), topics written in by readers (e.g. association of autism and MMR vaccine), external topic selected by potential author (e.g. high-dose statin), questions from CME meetings (e.g. VT risk with hormonal contraception), where guideline recommendation deviates from the evidence (e.g. frequency of bone mineral density testing), or where standards of care have lagged behind current evidence (e.g. ibuprofen vs acetaminophen for pediatric fever).
Must comment on internal and external validity

The TFP Process• Work in your IA Groups - each group develops a TFP
• Must have a clinical question approved by me by the end of September - one line clinical question and then 2-3 sentences about why the question is important
• All the writing needs to be done in Google Docs
• Must have a first draft completed by the end of November
• Written peer-review (6 students) must be returned to the group no later than mid-January
• Final TFP handed in by the end of February
• For each deadline missed you lose 5/30 of your mark. Miss three deadlines - 0/30

We are
knowledge
brokers28

PLOS Medicine 2016 | DOI:10.1371/journal.pmed.1002049
VARIES A LOT 20-50%
VARIES (1-20%) 1-20%
50-80% <1%<1% <1%
<1%, 1-20% <1%
Unknown, <1% Unknown, <1%>99% 50-80%
<1%, 1-20% Data sharing, 99% Trial registration, <20% Other registration <1%, 1-20%
Studies in major medical journals All clinical research

PLOS Medicine 2016 | DOI:10.1371/journal.pmed.1002049
“The problem of non-useful research should not be seen as a blame game against a specific group (e.g., clinical researchers) but instead
should be seen as an opportunity to improve.”
“Much current public funding could move from preclinical research to useful clinical research” - pre-clinical funded by industry, blue-sky
research by the public
“Instead of trying to make a prolific researcher of every physician, training physicians in understanding research methods and evidence-
based medicine may also help improve the situation by instilling healthy skepticism and critical thinking skills.”

PLOS Medicine 2016 | DOI:10.1371/journal.pmed.1002049
“Overall, not only are most research findings false, but, furthermore, most of the true
findings are not useful.”

PLoS Med 2014 11(10): e1001747. doi:10.1371/journal.pmed.1001747

If only some of this is true
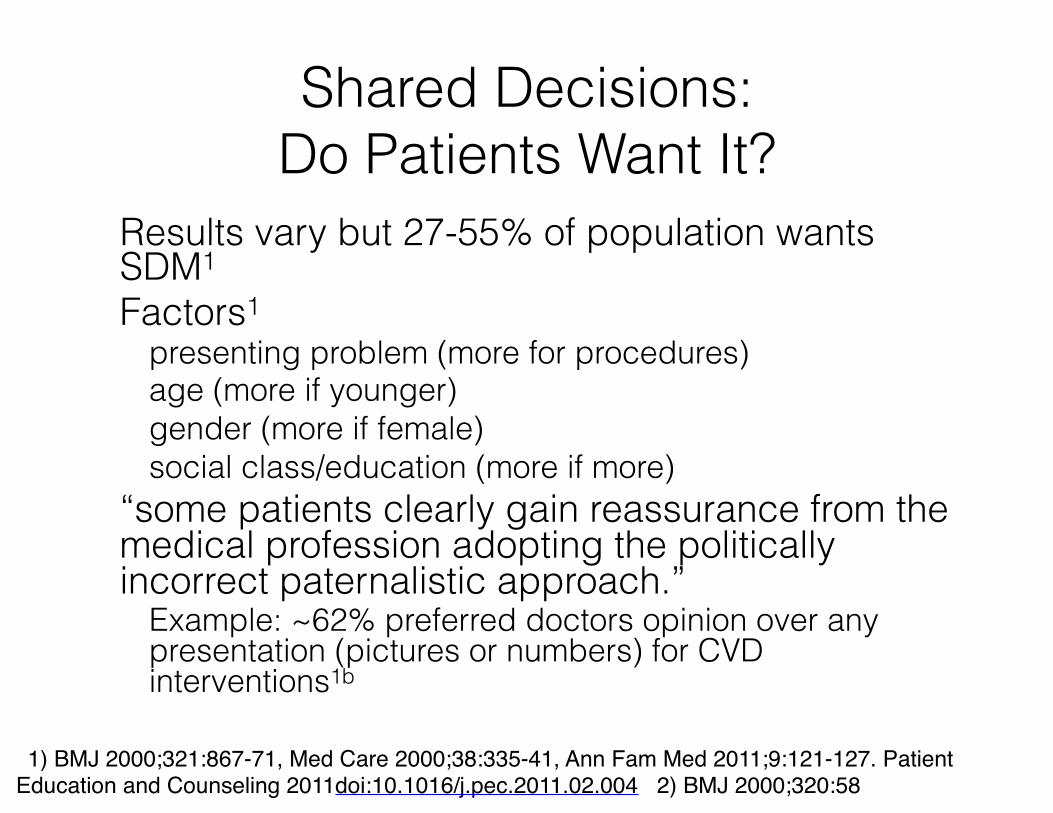
Shared Decisions: Do Patients Want It?
Results vary but 27-55% of population wants SDM1 Factors1
presenting problem (more for procedures) age (more if younger) gender (more if female) social class/education (more if more)
“some patients clearly gain reassurance from the medical profession adopting the politically incorrect paternalistic approach.”
Example: ~62% preferred doctors opinion over any presentation (pictures or numbers) for CVD interventions1b
1) BMJ 2000;321:867-71, Med Care 2000;38:335-41, Ann Fam Med 2011;9:121-127. Patient Education and Counseling 2011doi:10.1016/j.pec.2011.02.004 2) BMJ 2000;320:58

What do Decision-Aids AccomplishUsualcare DecisionAid Studies(patients)
Knowledgescore:from0(none)-100(perfect)
57% 70% 42studies
(10,842patients)
ProportionwhoUnderstandRisk
30% 54% 19studies
(5868patients)
Congruencebetweenchoiceandvalues
32% 50% 13studies
(4670patients)
Decisionalconflict(<25decisionsmade;>38
delayeddecision)
13-49 7lower 22studies
(4343patients)
DecisionmadebyPractitioner
17% 10% 14studies
(3234patients)
CochraneDatabaseSystRev.2014Jan28;1:CD001431.

Balanced Information
Find it Evaluate it

Marc Levine, 2016
“All of the knowledge that we have is subject to evaluation and
change, based on the best available evidence”

Always start with “how do you figure out if ‘X’ does
something”
From Marc Levine
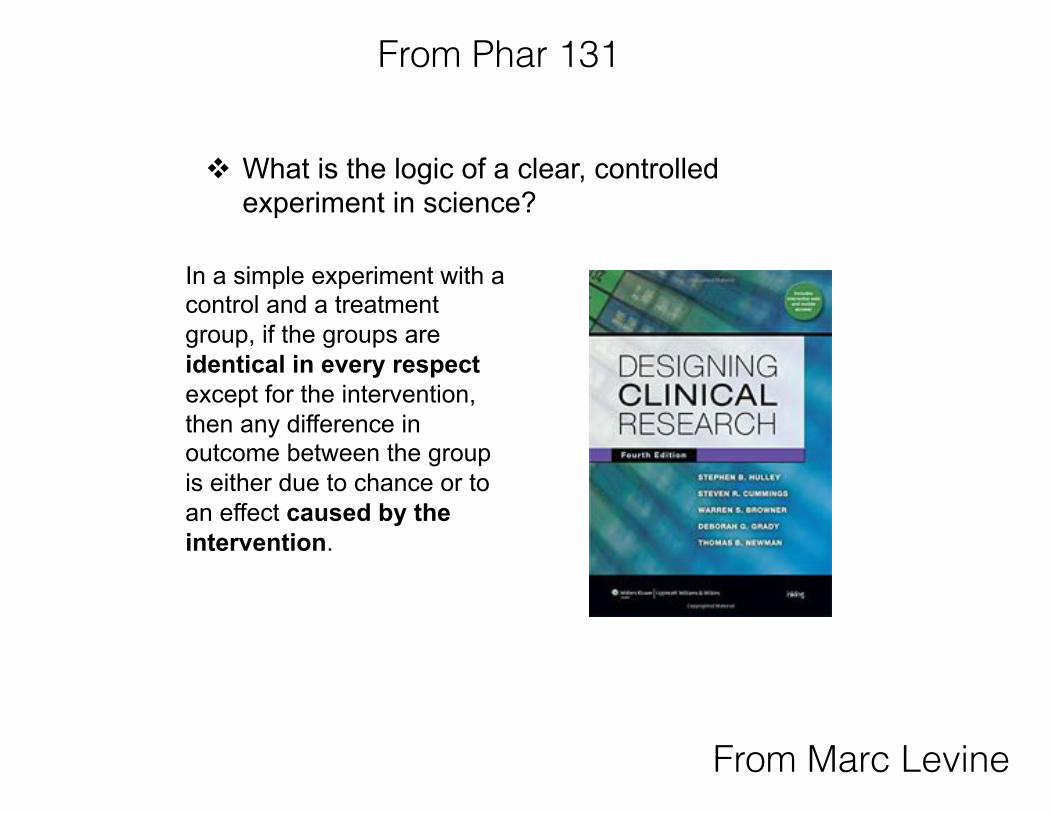
v What is the logic of a clear, controlled experiment in science?
In a simple experiment with a control and a treatment group, if the groups are identical in every respect except for the intervention, then any difference in outcome between the group is either due to chance or to an effect caused by the intervention.
From Phar 131

Main types of clinical/epidemiological studies
Lancet 2002;359:57–61

From Marc Levine
What is Confounding?
It is a source of bias in clinical/epidemiological research that confuses or mixes effects: i.e., a possible effect of a treatment (exposure) will be confused with the possible effects of another, confounding variable, that is associated with both the treatment (exposure) and the outcome.
e.g. Suppose in a cohort study, a researcher is interested in determining whether there is an association between birth order and Down Syndrome. She obtains data from women who have had multiple pregnancies and observes the following:
cf.Epidemiology:anintroduc7on.RothmanK.OxfordUniversityPress,NY,2002

From Marc Levine
Key Aspects in the Critical Appraisal of RCTs
1. When a statistically significant difference is observed between a control group and a treated group after data analysis, the question to be answered is:
What is the cause of the observed difference?
There are always 3 possibilities that must be considered
1. The observed difference was due to chance
2. The observed difference was due to confounding or other source of bias
3. If neither 1 nor 2 is believed to have caused the difference, then by simple elimination, it is inferred that the treatment caused it.

From Marc Levine
Key Aspects in the Critical Appraisal of RCTs What is the cause of the observed difference? There are always 3 possibilities that must be considered 1. The observed difference was due to chance
This is the role of statistical analysis. It does NOT tell us whether the result was due to chance. The critical issue here is whether statistical analysis was reasonably and correctly applied, and how to interpret a statistically significant result (to be discussed) If the result is deemed to be significant, then we decide to rule out chance as the explanation (though this may be wrong!)

From Marc Levine

From Marc Levine

From Marc Levine

From Marc Levine
Key Aspects in the Critical Appraisal of RCTs
What is the cause of the observed difference?
There are always 3 possibilities that must be considered
1. The observed difference was due to chance
2. The observed difference was due to confounding or other source of bias
Confounding: there is an imbalance between groups in a variable that is prognostic for increased or decreased probability of the outcome – e.g. if sicker patients were inadvertently more prevalent in the placebo group
Bias is a systematic tendency for the difference in outcome between the intervention and control to deviate from the true value – e.g. if patients are unblinded they may behave or respond to assessments differently, affecting the outcome

From Marc Levine
Key Aspects in the Critical Appraisal of RCTs What is the cause of the observed difference? There are always 3 possibilities that must be considered 1. The observed difference was due to chance
2. The observed difference was due to confounding or bias
3. If neither 1 nor 2 appears to explain the observed difference, then by elimination, the intervention is believed (inferred) to be the cause of the observed difference
Is the cause proven? Why or why not?
From Marc Levine
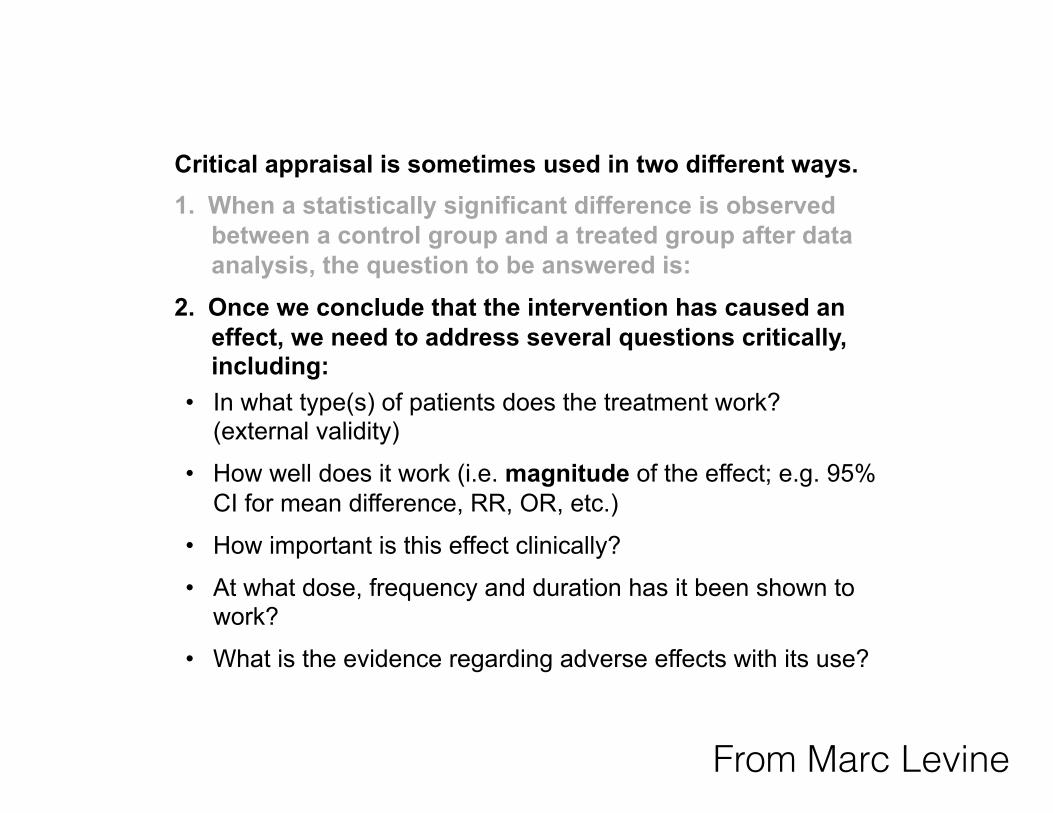
Critical appraisal is sometimes used in two different ways. 1. When a statistically significant difference is observed
between a control group and a treated group after data analysis, the question to be answered is:
2. Once we conclude that the intervention has caused an effect, we need to address several questions critically, including:
• In what type(s) of patients does the treatment work? (external validity)
• How well does it work (i.e. magnitude of the effect; e.g. 95% CI for mean difference, RR, OR, etc.)
• How important is this effect clinically?
• At what dose, frequency and duration has it been shown to work?
• What is the evidence regarding adverse effects with its use?
From Marc Levine
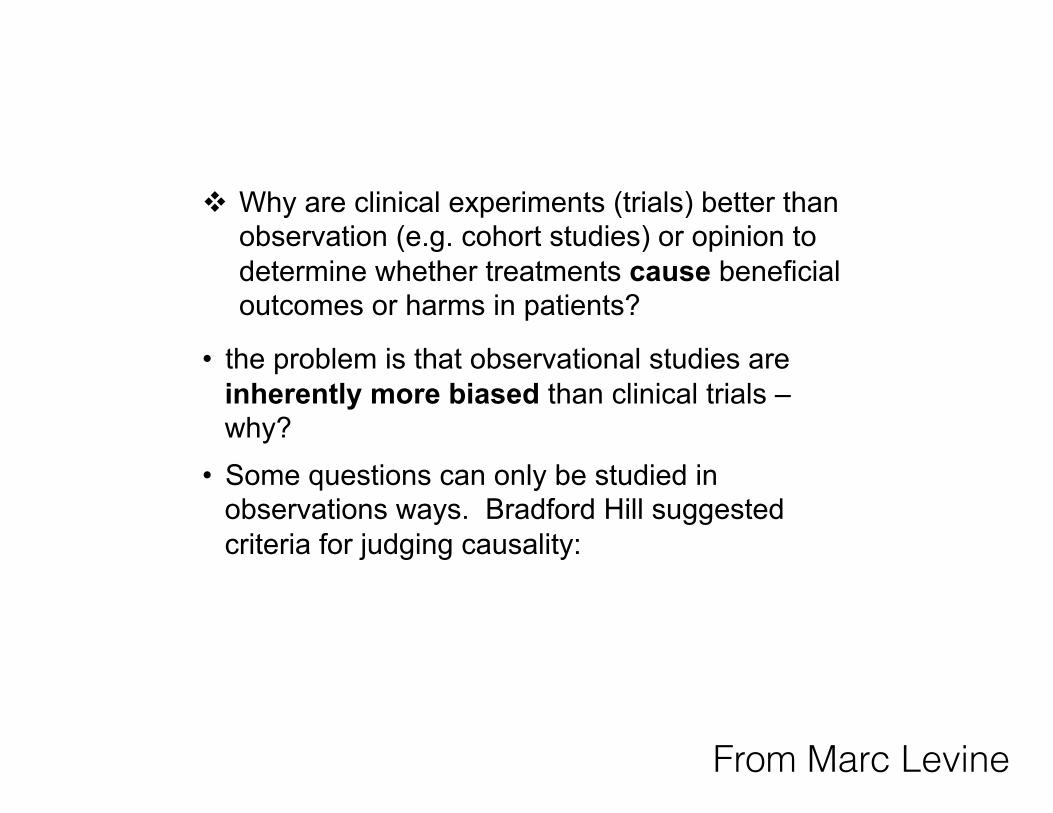
v Why are clinical experiments (trials) better than observation (e.g. cohort studies) or opinion to determine whether treatments cause beneficial outcomes or harms in patients?
• the problem is that observational studies are inherently more biased than clinical trials – why?
• Some questions can only be studied in observations ways. Bradford Hill suggested criteria for judging causality:


50 common ingredients from random recipes in a cookbook
40 had articles reporting on cancer risk
Of 264 assessments - 72% concluded the ingredient was associated with either an increase or decrease in cancer
Am J Clin Nutr doi: 10.3945/ajcn.112.047142

The Environment and Disease
Association or Causation
1897-1991
Austin Bradford Hill

Bradford Hill’s criteria Association vs Causation
Austin Bradford Hill, “The Environment and Disease: Association or Causation?” Proceedings of the Royal Society of Medicine 1965;58:295-300
Primary example used throughout was smoking
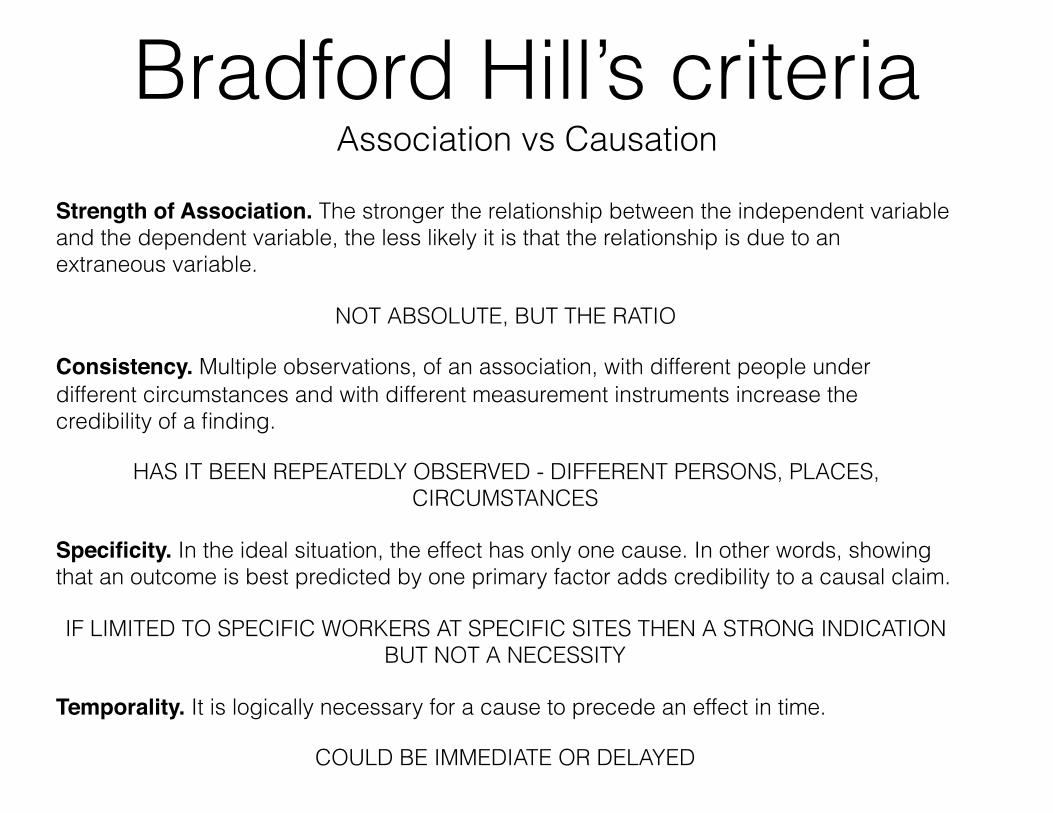
Strength of Association. The stronger the relationship between the independent variable and the dependent variable, the less likely it is that the relationship is due to an extraneous variable.
NOT ABSOLUTE, BUT THE RATIO
Consistency. Multiple observations, of an association, with different people under different circumstances and with different measurement instruments increase the credibility of a finding.
HAS IT BEEN REPEATEDLY OBSERVED - DIFFERENT PERSONS, PLACES, CIRCUMSTANCES
Specificity. In the ideal situation, the effect has only one cause. In other words, showing that an outcome is best predicted by one primary factor adds credibility to a causal claim.
IF LIMITED TO SPECIFIC WORKERS AT SPECIFIC SITES THEN A STRONG INDICATION BUT NOT A NECESSITY
Temporality. It is logically necessary for a cause to precede an effect in time.
COULD BE IMMEDIATE OR DELAYED
Bradford Hill’s criteria Association vs Causation

Biological gradient/Dose Response Relation. There should be a direct relationship between the risk factor (i.e., the independent variable) and people’s status on the disease variable (i.e., the dependent variable).
LOW EXPOSURE VERSUS HIGH EXPOSURE
Plausibility. It is easier to accept an association as causal when there is a rational and theoretical basis for such a conclusion.
DEPENDS ON THE BIOLOGICAL KNOWLEDGE OF THE DAY - MORE CONVINCING IF PREDICTED PROSPECTIVELY
Coherence. A cause-and-effect interpretation for an association is clearest when it does not conflict with what is known about the variables under study and when there are no plausible competing theories or rival hypotheses. In other words, the association must be coherent with other knowledge.
DOES NOT CONFLICT WITH GENERALLY KNOWN FACTS
Experimental. Any related research that is based on experiments will make a causal inference more plausible.
DOES SOMETHING PREVENT THE PROBLEM? - RANDOMIZED EFFECT
Analogy. Sometimes a commonly accepted phenomenon in one area can be applied to another area.
PREVIOUS EFFECTS WITH SIMILAR “TOXINS” LEADS TO SIMILAR EFFECTS
Bradford Hill’s criteria Association vs Causation

“None of my nine viewpoints can bring indisputable evidence for or against the cause-and-effect hypothesis and none can be required
as a sine qua non. What they can do, with greater or less strength, is to help us to make up our minds on the fundamental question - is there
any other way of explaining the set of facts before us, is there any other answer equally, or
more, likely than cause and effect?”
Bradford Hill

“The required amount of evidence for a causal effect should depend on the possible
consequences of interventions derived from causal conclusions. If a causal conclusion
needed an action that brought about more harm if wrongly taken than benefit if rightly taken, a
correspondingly high amount of evidence would be required. If the relationship between benefit and harm were converse, less evidence would
be necessary.”
Emerging Themes in Epidemiology 2005

• Recognising the need for fair comparisons of treatments
• Judging whether a comparison of treatments is a fair comparison
• Understanding the role of chance
• Considering all the relevant fair comparisons
• Understanding the results of fair comparisons of treatments
• Judging whether fair comparisons of treatments are relevant
EBM 2015;8:112–25
32 concepts divided into 6 groups

Recognising the need for fair comparisons of treatments
1.1 Treatments may be harmful
1.2 Personal experiences or anecdotes (stories) are an unreliable basis for assessing the effects of most treatments
1.3 A treatment outcome may be associated with a treatment, but not caused by the treatment
1.4 Widely used treatments or treatments that have been used for a long time are not necessarily beneficial or safe
1.5 New, brand-named, or more expensive treatments may not be better than available alternatives
1.6 Opinions of experts or authorities do not alone provide a reliable basis for deciding on the benefits and harms of treatments
1.7 Conflicting interests may result in misleading claims about the effects of treatments
1.8 Increasing the amount of a treatment does not necessarily increase the benefits of a treatment and may cause harm
1.9 Earlier detection of disease is not necessarily better
1.10 Hope or fear can lead to unrealistic expectations about the effects of treatments
1.11 Beliefs about how treatments work are not reliable predictors of the actual effects of treatments
1.12 Large, dramatic effects of treatments are rare

Judging whether a comparison of treatments is a fair comparison
2.1 Evaluating the effects of treatments requires appropriate comparisons
2.2 Apart from the treatments being compared, the comparison groups need to be similar (i.e. ’like needs to be compared with like’)
2.3 People’s experiences should be counted in the group to which they were allocated
2.4 People in the groups being compared need to be cared for similarly (apart from the treatments being compared)
2.5 If possible, people should not know which of the treatments being compared they are receiving2.6 Outcomes should be measured in the same way (fairly) in the treatment groups being compared
2.7 It is important to measure outcomes in everyone who was included in the treatment comparison groups

Understanding the role of chance
3.1 Small studies in which few outcome events occur are usually not informative and the results may be misleading
3.2 The use of p-values to indicate the probability of something having occurred by chance may be misleading; confidence intervals are more informative
3.3 Saying that a difference is statistically significant or that it is not statistically significant can be misleading

Considering all the relevant fair comparisons
4.1 The results of single comparisons of treatments can be misleading
4.2 Reviews of treatment comparisons that do not use systematic methods can be misleading
4.3 Well done systematic reviews often reveal a lack of relevant evidence, but they provide the best basis for making judgements about the certainty of the evidence
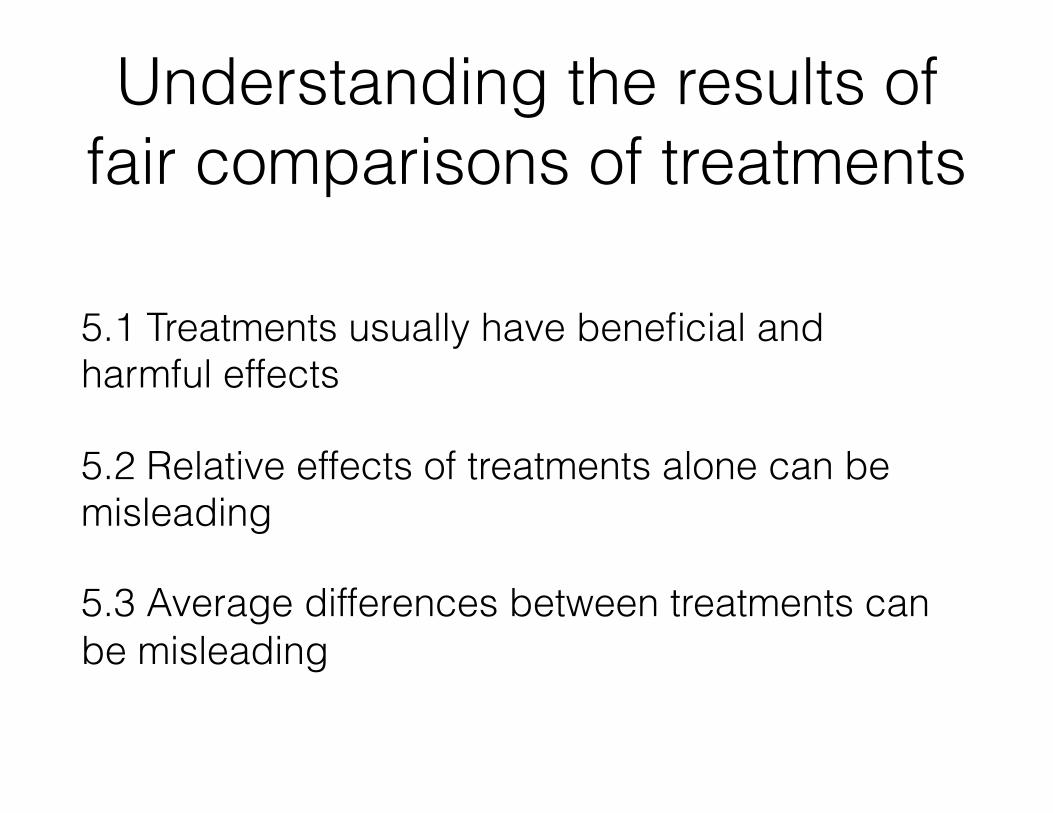
Understanding the results of fair comparisons of treatments
5.1 Treatments usually have beneficial and harmful effects
5.2 Relative effects of treatments alone can be misleading
5.3 Average differences between treatments can be misleading

Judging whether fair comparisons of treatments are relevant
6.1 Fair comparisons of treatments should measure outcomes that are important
6.2 Fair comparisons of treatments in animals or highly selected groups of people may not be relevant
6.3 The treatments evaluated in fair comparisons may not be relevant or applicable
6.4 Results for a selected group of people within fair comparisons can be misleading

“an inclination or outlook to present or hold a partial perspective, often accompanied by a refusal to consider the
possible merits of alternative points of view”

189 biases

Sources of Bias1) Cognitive biases Anchoring/first piece of info
Apophenia/seeing patterns
Attribution bias/explain own or other’s behaviour
Confirmation bias/confirms belief
Framing/cultural bias
Halo effect/what you think of a group
Self-serving bias
2) Conflicts of interest Bribery
Favoritism
Funding bias
Insider trading
Lobbying
Match fixing
Regulatory issues
Shilling/paid reviews
3) Statistical biases 4) Contextual biases
Academic bias
Educational bias
Experimenter bias
Full text on net bias
Inductive bias
Media bias
Publication bias
Reporting bias & social desirability bias
5) Prejudices Classism
Lookism
Racism
Sexism
https://en.wikipedia.org/wiki/Bias


