46
Welcome to the 2018 Workshop/Webinar on Transit Asset Management Rule Implementation
Welcome to the
2018 Workshop/Webinar on
Transit Asset Management
Rule Implementation

Topic Overview
Discussion Lead:
Kevin Olinger
MTAP Spring 2018 Transit Asset Management Webinar
March 14, 2018
TRANSIT ASSET MANAGEMENT
PLANNING IN NEW MEXICO
Kevin E. Olinger
Transit Bureau Chief
New Mexico Department of Transportation
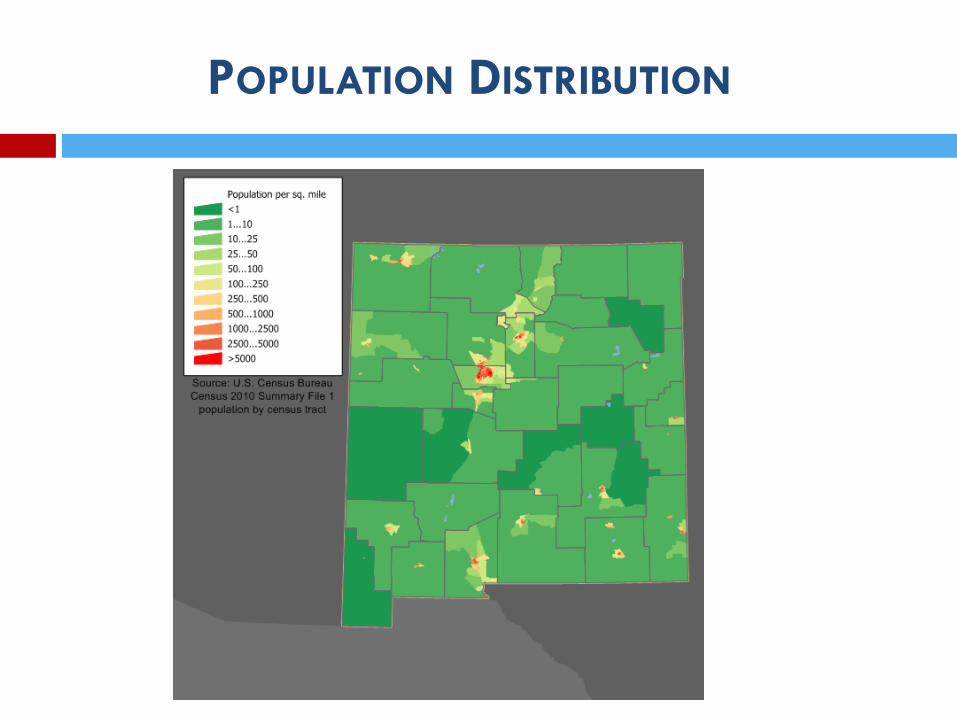
POPULATION DISTRIBUTION

Transit Services in
New Mexico

New Mexico TAM Plan Status

Challenges Ahead

State DOT Perspective
Brian Travis

Transit Asset Management
California’s Progress
Caltrans Division of Rail and Mass
Transportation
Brian Travis
5/14/18

A Big Effort…made small??
By informing stakeholders
By continuously promoting
By developing tools
Lots of handholding, and;
Promoting ownership.

Progress So Far
Identified Accountable Executives
Established Vehicle Inventories
Established ULB’s
Set Targets…..
TAM Plans…..ongoing

Lessons Learned
Develop A Strategic approach to TAM
Stall- sometimes it works
Use of internal, external and private partners
simplified effort
Strive to be the “expert” even if you know your
not.

Toughest Challenge
Engagement - Approximately 100 rural agencies
Group Plans – Who’s plan?
Electronic Grants Management (EGM) New Module – 1st time out the starting gate
What’s TAM? – OMG - Using TAM to Teach ownership
Greatest Successes
EGM – New Module – Keeps everything organized &
standardized.
Coordination with Planning – MPO Agreements are
helping to define Tier 1 roles and responsibilities

Continuous Education
Educate self and others – Share FTA Webinars,
Conferences, Workshops & websites – all very helpful
Rural Counties Task Force Meetings
MPO Agreements
TAM & EGM module training at CalACT
EGM module video
Lots of phone calls and handholding
Why is TAM important? - Answering that one question
promotes local ownership of TAM.
Thank you
Contact Information
Mark Codey
(916) 654-8655
Brian Travis
(916) 654-9842
State DOT Perspective
Sree Mitra

Iowa Approach
to Transit Asset
Management
Sree MitraGrant ManagerOffice of Public TransitIowa DOT
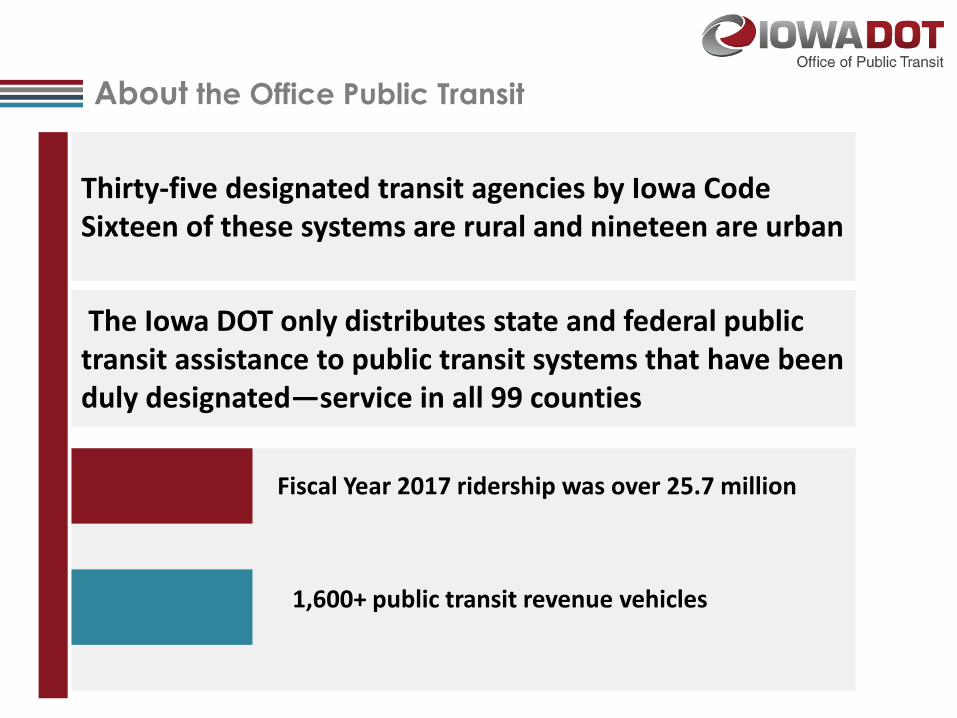
About the Office Public Transit
Thirty-five designated transit agencies by Iowa CodeSixteen of these systems are rural and nineteen are urban
The Iowa DOT only distributes state and federal public transit assistance to public transit systems that have been duly designated—service in all 99 counties
Fiscal Year 2017 ridership was over 25.7 million
1,600+ public transit revenue vehicles

Iowa’s Public Transit System

GROUP TAM PLAN
INDIVIDUAL TAM PLANS
TIERS
Iowa DOT is working on a group plan and is setting targets for our rural and small urban transit systems (population <50,000) that are 5311 subrecipients, includes 23 of our 35 systems
Other urban systems who are direct recipients of 5307 funds are managing their own TAM plans and targets.
All Iowa’s transit systems except Des Moines are Tier II.
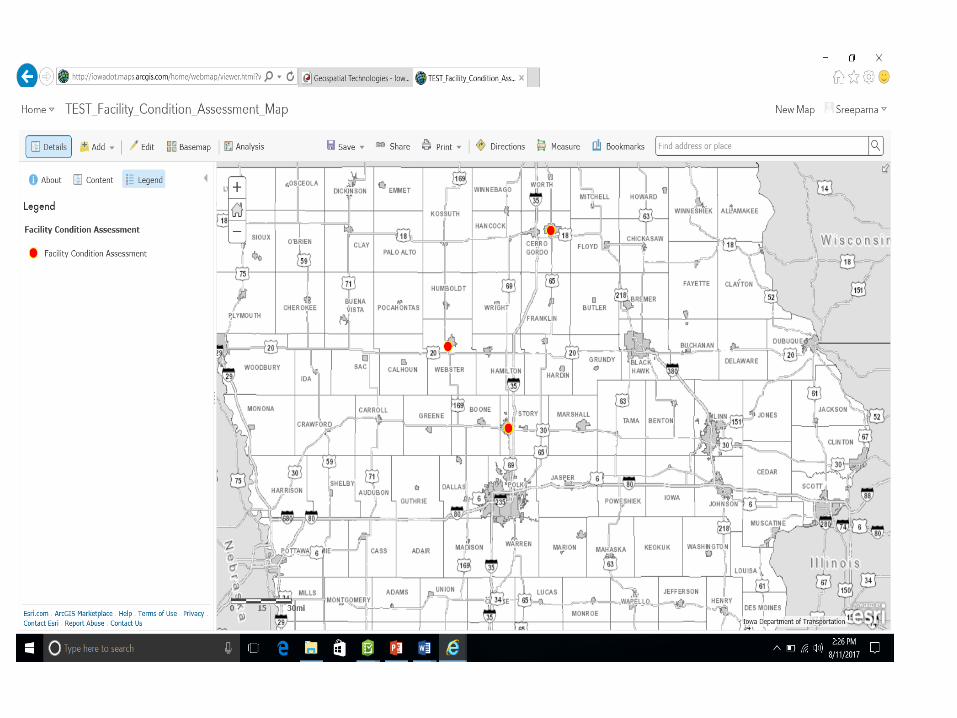
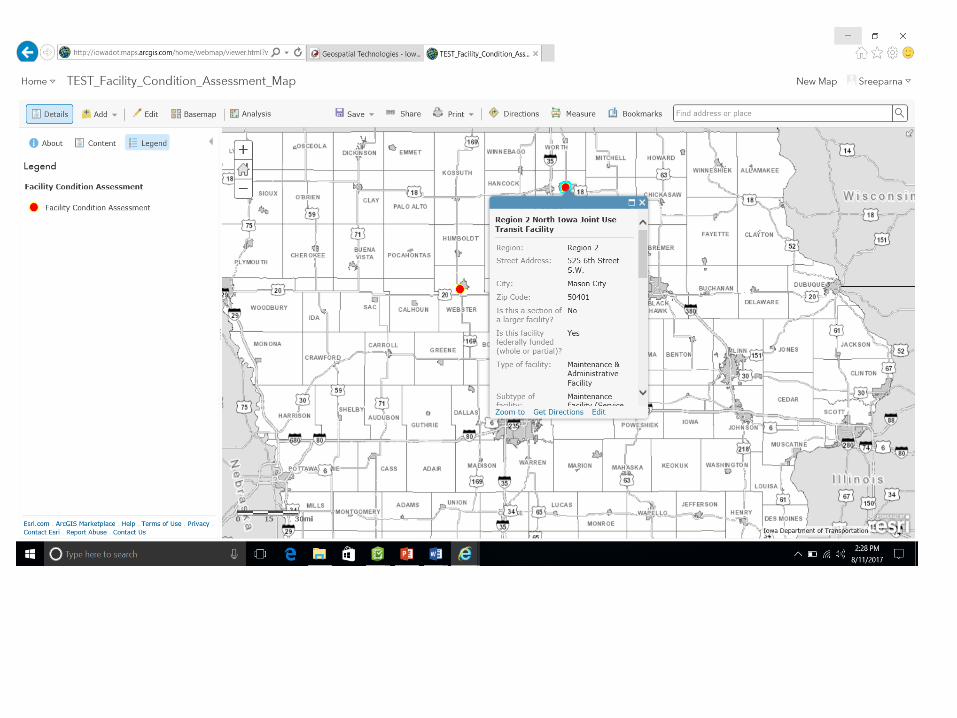
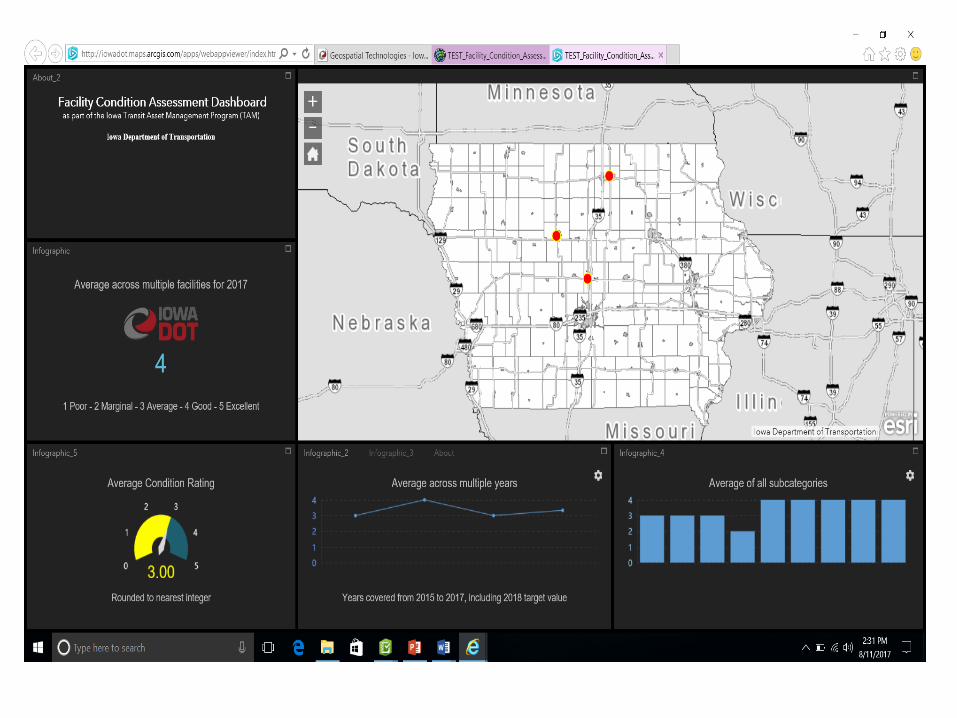
TAM PLANS

Facility inventory data collected based on NTD requirements
TAM COMMITTEE SURVEY
Facility condition assessment will be done in summer 2018 on about 30 buildings using Iowa-DOT-developed app that work on iPads or Android devices. App developed to closely follow guidance from FTA’s TAM Facilities Performance Measure Reporting Guidebook
Sent to 23 agencies to get baseline asset management practices currently in place
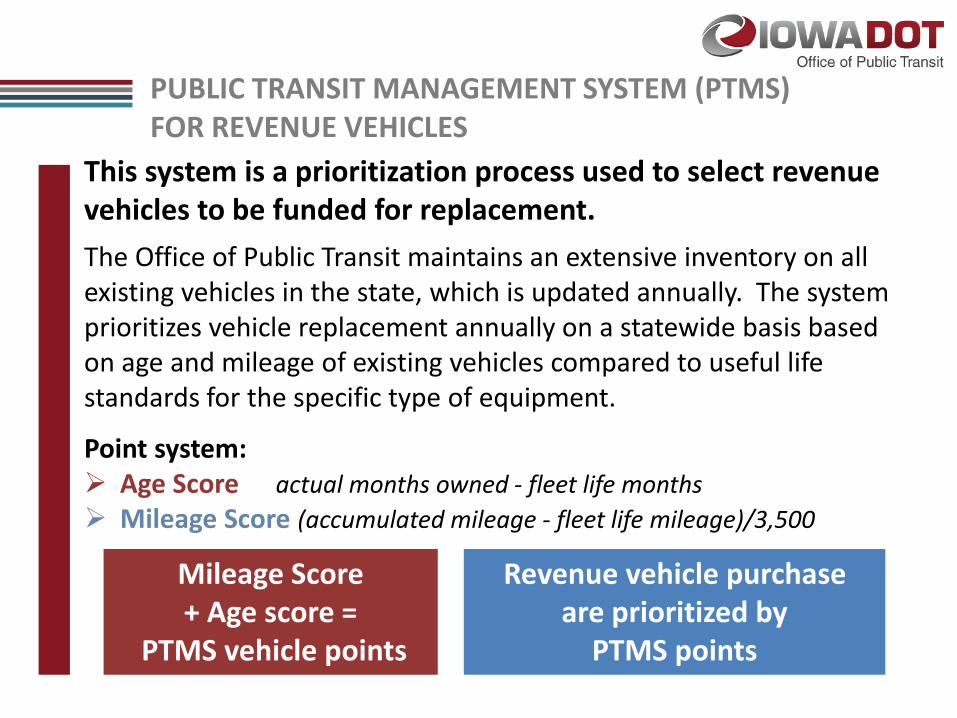
This system is a prioritization process used to select revenue vehicles to be funded for replacement.
The Office of Public Transit maintains an extensive inventory on all existing vehicles in the state, which is updated annually. The system prioritizes vehicle replacement annually on a statewide basis based on age and mileage of existing vehicles compared to useful life standards for the specific type of equipment.
Point system: Age Score actual months owned - fleet life months
Mileage Score (accumulated mileage - fleet life mileage)/3,500
PUBLIC TRANSIT MANAGEMENT SYSTEM (PTMS) FOR REVENUE VEHICLES
Mileage Score + Age score =
PTMS vehicle points
Revenue vehicle purchase are prioritized by
PTMS points

PTMS LIST
Non-Urban Allocation $1,750,000
Sponsor VIN # Mileage YEAR Current Vehicle DescriptionReplacement Vehicle Description
Add OnsFY18 Total
CostFY18 Federal Participation
Local Match PTMS Points
Region 1 1FDXE45P76HB33082 229,796 2004 Light Duty Bus (158" wb) Light Duty Bus (176" wb) VSS $93,700 $79,645 $14,055 118.00
Region 1 1FDXE45P06HB33084 221,917 2004 Light Duty Bus (158" wb) Light Duty Bus (176" wb) VSS $93,700 $79,645 $14,055 115.77
Mason City 1FDXE45P86DB00504 237,311 2006 Light Duty Bus (158" wb) Light Duty Bus (176" wb)Diesel, UFRC, VSS
$108,700 $92,395 $16,305 113.72
Region 1 1FDXE45P96HB33083 208,206 2004 Light Duty Bus (158" wb) Light Duty Bus (176" wb) VSS $93,700 $79,645 $14,055 111.84
Region 1 1FDXE45P56HA33081 202,488 2004 Light Duty Bus (158" wb) Light Duty Bus (176" wb) VSS $93,700 $79,645 $14,055 110.21
Region 13 1FDXE45S26DB26083 237,152 2007 Light Duty Bus (176" wb) Light Duty Bus (176" wb) $90,697 $77,092 $13,605 109.91
Region 12 1FDXE45S87DA13045 230,238 2007 Light Duty Bus (176" wb) Light Duty Bus (176" wb) VSS $93,700 $79,645 $14,055 107.13
Region 12 1FDXE45S17DA13047 220,022 2007 Light Duty Bus (176" wb) Conversion Van VSS $55,500 $47,175 $8,325 103.62
Region 14 1FDXE45S85HB14012 143,805 2005 Light Duty Bus (158" wb) Light Duty Bus (176" wb) VSS $91,700 $73,360 $18,340 102.80
Region 10 1FDXE45F83HB83735 244,173 2004 Light Duty Bus (176" wb) Light Duty Bus (176" wb) Diesel, VSS $101,700 $86,445 $15,255 101.67
Region 14 1FDWE35S34HA96278 130,638 2004 Light Duty Bus (138" wb) Light Duty Bus (176" wb) VSS $91,700 $73,360 $18,340 100.84
Region 14 1FDWE35S14HA96280 124,107 2004 Light Duty Bus (138" wb) Light Duty Bus (176" wb) VSS $91,700 $73,360 $18,340 99.33
Region 9 1FDWE35S76HB34033 163,665 2006 Light Duty Bus (138" wb) Light Duty Bus (158" wb) VSS $88,600 $75,310 $13,290 97.52
Region 10 1FDWE35S76DA78814 173,295 2006 Light Duty Bus (138" wb) Light Duty Bus (138" wb) VSS $84,500 $67,600 $16,900 97.38
Region 10 1FDXE45P46HB33119 160,126 2006 Light Duty Bus (176" wb) Light Duty Bus (176" wb) Diesel, VSS $101,700 $86,445 $15,255 97.10
Region 4 1FDXE45SX6HB24641 148,556 2006 Light Duty Bus (176" wb) Light Duty Bus (176" wb) VSS $91,700 $77,945 $13,755 97.10
Region 9 1FDWE35S16HB34027 162,172 2006 Light Duty Bus (138" wb) Light Duty Bus (158" wb) VSS $88,600 $75,310 $13,290 97.08
Region 12 1FDXE45S95HB19963 124,980 2005 Light Duty Bus (158" wb) Light Duty Bus (176" wb) VSS $93,700 $79,645 $14,055 97.06
Region 9 1FDWE35S56HB34029 161,845 2006 Light Duty Bus (138" wb) Light Duty Bus (158" wb) VSS $88,600 $75,310 $13,290 97.00
Region 5 1HVBEABM12H541900 211,840 2002 Medium Duty Bus (29-32 ft.)Medium Duty Bus (29-32 ft.)
Diesel, VSS $192,549 $163,667 $28,882 96.12
Region 16 1FD4E45P38DB46358 253,123 2008 Light Duty Bus (176" wb) Light Duty Bus (176" wb) VSS $93,700 $79,645 $14,055 95.95
Region 9 1FDWE35S66HB34038 157,583 2006 Light Duty Bus (138" wb) Light Duty Bus (158" wb) VSS $56,131 $47,711 $8,420 95.77
Count $1,750,000

Iowa Transit System Structure


TAM Plans
TAM Plans
TAM Plans
TAM Plans
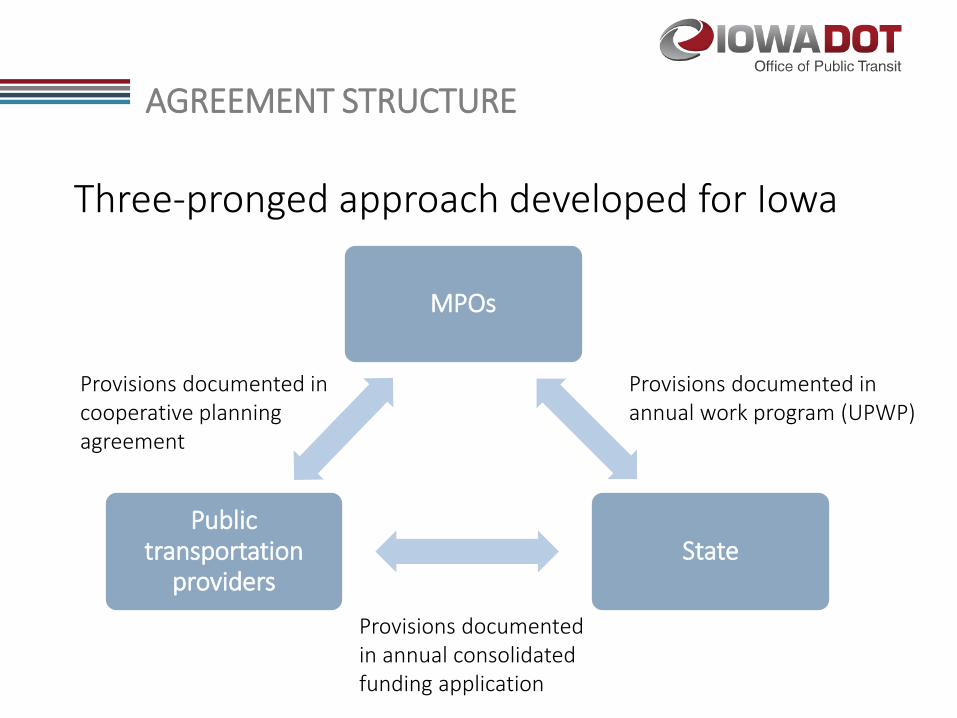
Three-pronged approach developed for Iowa
MPOs
StatePublic
transportation providers
Provisions documented in annual work program (UPWP)
Provisions documented in annual consolidated funding application
Provisions documented in cooperative planning agreement
AGREEMENT STRUCTURE

FINAL THOUGHTS….
Significant Lesson Learned so Far: Start early with data collection efforts. We sent out a survey to transit agencies in February 2017 to establish baselineToughest Challenge: diversity of skills, data availability, different internal procedures of group plan participantsWhat Tasks/Processes Are Going Smoothly: Expect facility condition assessment to go smoothly since Iowa
DOT has taken ownership Vehicle data is already centralized at the DOTEducating and coordinating with subrecipients: State Transit Association meetings E-mail communications “TAM Implementation for Tier II Providers and Sponsors” course
brought to Iowa—encouraged group participants as well as our 5307 recipients to take class
Working with our systems planning office to formalize communications with MPOs

Office of Public Transit
Andrea WhitePhone: 515 [email protected]
Sree MitraPhone: 515 [email protected]
THANK YOU!
CONTACT INFORMATION
Office of Systems Planning
For TAM plan and data-related inquiries
For coordination and planning-related inquiries

State DOT Perspective
Johnny Mmanu-ike
ransit
sset
anagement
South Carolina Group Plan
Presented by: Johnny Mmanu-ikeSouth Carolina Department of Transportation
Office Of Public Transportation
Transit Asset Management (TAM): A business model that uses the condition of
assets to guide transit asset replacement
prioritization for funding to ensure SC
transit assets remain in a State of Good
Repair (SGR).
What is Transit Asset Management?

SC TAMP Development Goal
• Complete compliant TAMP October ,2018
• Improved transparency and accountability
• Optimization of capital investments and
improved maintenance decisions
• Improved data-collection for
repairs/replacement decisions
• Increased safety and reliability
• Sets attainable priorities
• Improved strategic, long term investments

TAM Implementation Timeline
Define state
of good
repair,
including
objective
standards
Require
TAM
Plans for all
recipients and
sub- recipients
Establish
SGR
performance
measures,
recipients set
targets
Report data to
the NTDProvide
Technical
assistance
Activity Initial Due Date Ongoing Submittal Frequency
Final Rule Effective Date October 1, 2016 N/A
SGR Targets January 1, 2018 Update Annually
TAM Plan October 1, 2018 Review Annually
Asset Inventory and Condition Report
October 1, 2018 Update Annually
Share TAM Plan with MPO partners
June 30, 2019 Review Annually
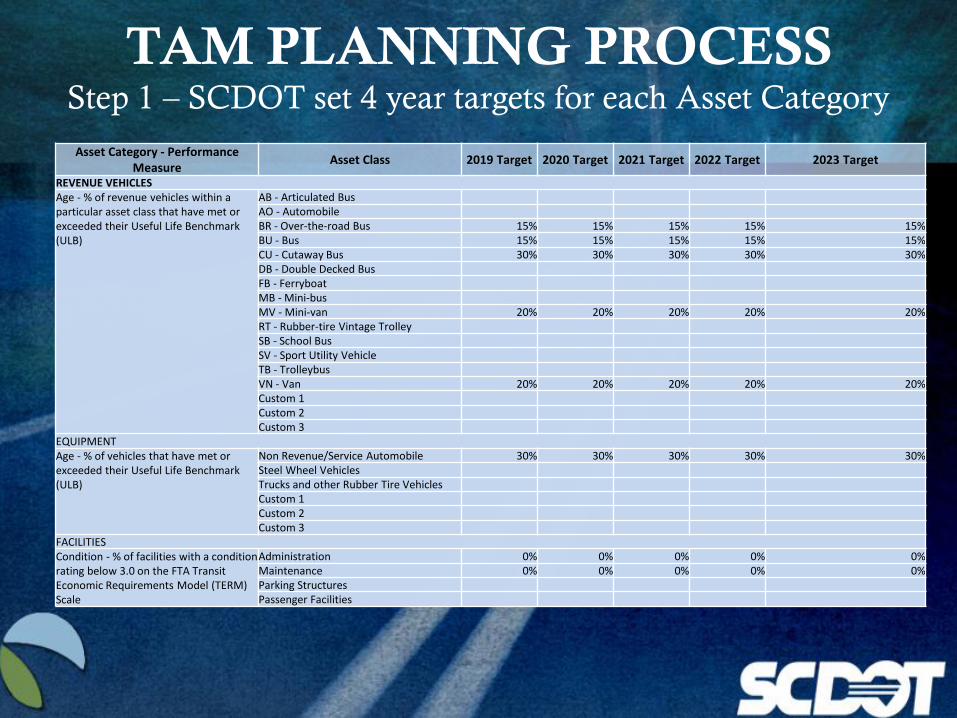
TAM PLANNING PROCESSStep 1 – SCDOT set 4 year targets for each Asset Category
Asset Category - Performance Measure
Asset Class 2019 Target 2020 Target 2021 Target 2022 Target 2023 Target
REVENUE VEHICLESAge - % of revenue vehicles within a particular asset class that have met or exceeded their Useful Life Benchmark (ULB)
AB - Articulated BusAO - AutomobileBR - Over-the-road Bus 15% 15% 15% 15% 15%BU - Bus 15% 15% 15% 15% 15%CU - Cutaway Bus 30% 30% 30% 30% 30%DB - Double Decked BusFB - FerryboatMB - Mini-busMV - Mini-van 20% 20% 20% 20% 20%RT - Rubber-tire Vintage TrolleySB - School BusSV - Sport Utility VehicleTB - TrolleybusVN - Van 20% 20% 20% 20% 20%Custom 1Custom 2Custom 3
EQUIPMENTAge - % of vehicles that have met or exceeded their Useful Life Benchmark (ULB)
Non Revenue/Service Automobile 30% 30% 30% 30% 30%Steel Wheel VehiclesTrucks and other Rubber Tire VehiclesCustom 1Custom 2Custom 3
FACILITIESCondition - % of facilities with a condition rating below 3.0 on the FTA Transit Economic Requirements Model (TERM) Scale
Administration 0% 0% 0% 0% 0%Maintenance 0% 0% 0% 0% 0%Parking StructuresPassenger Facilities
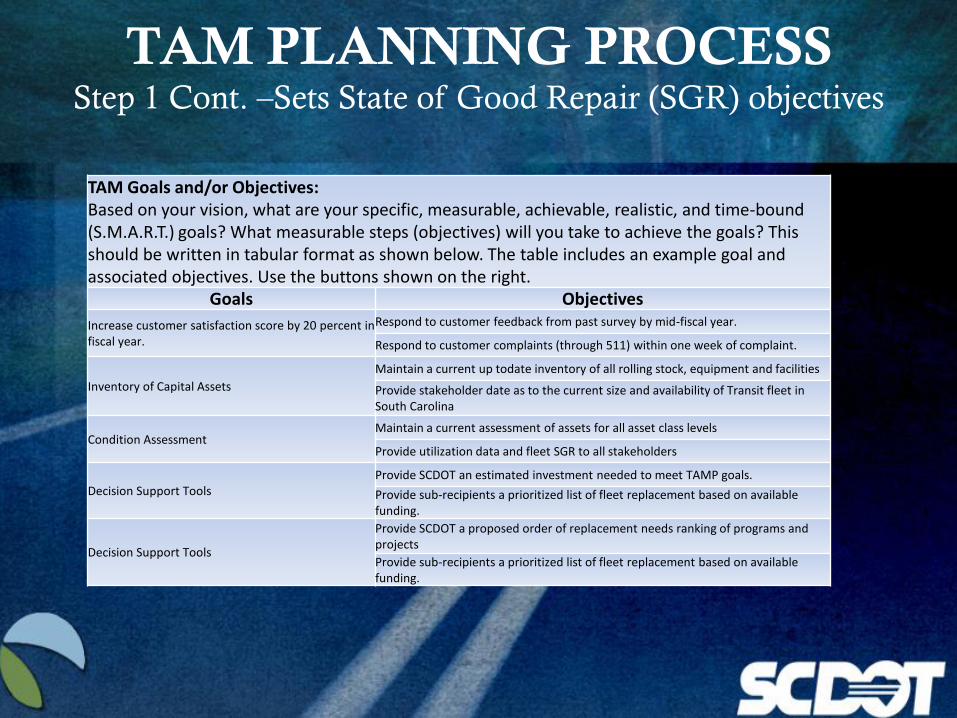
TAM PLANNING PROCESSStep 1 Cont. –Sets State of Good Repair (SGR) objectives
TAM Goals and/or Objectives: Based on your vision, what are your specific, measurable, achievable, realistic, and time-bound (S.M.A.R.T.) goals? What measurable steps (objectives) will you take to achieve the goals? This should be written in tabular format as shown below. The table includes an example goal and associated objectives. Use the buttons shown on the right.
Goals Objectives
Increase customer satisfaction score by 20 percent in fiscal year.
Respond to customer feedback from past survey by mid-fiscal year.
Respond to customer complaints (through 511) within one week of complaint.
Inventory of Capital Assets
Maintain a current up todate inventory of all rolling stock, equipment and facilities
Provide stakeholder date as to the current size and availability of Transit fleet in South Carolina
Condition AssessmentMaintain a current assessment of assets for all asset class levels
Provide utilization data and fleet SGR to all stakeholders
Decision Support ToolsProvide SCDOT an estimated investment needed to meet TAMP goals.
Provide sub-recipients a prioritized list of fleet replacement based on available funding.
Decision Support Tools
Provide SCDOT a proposed order of replacement needs ranking of programs and projects
Provide sub-recipients a prioritized list of fleet replacement based on available funding.
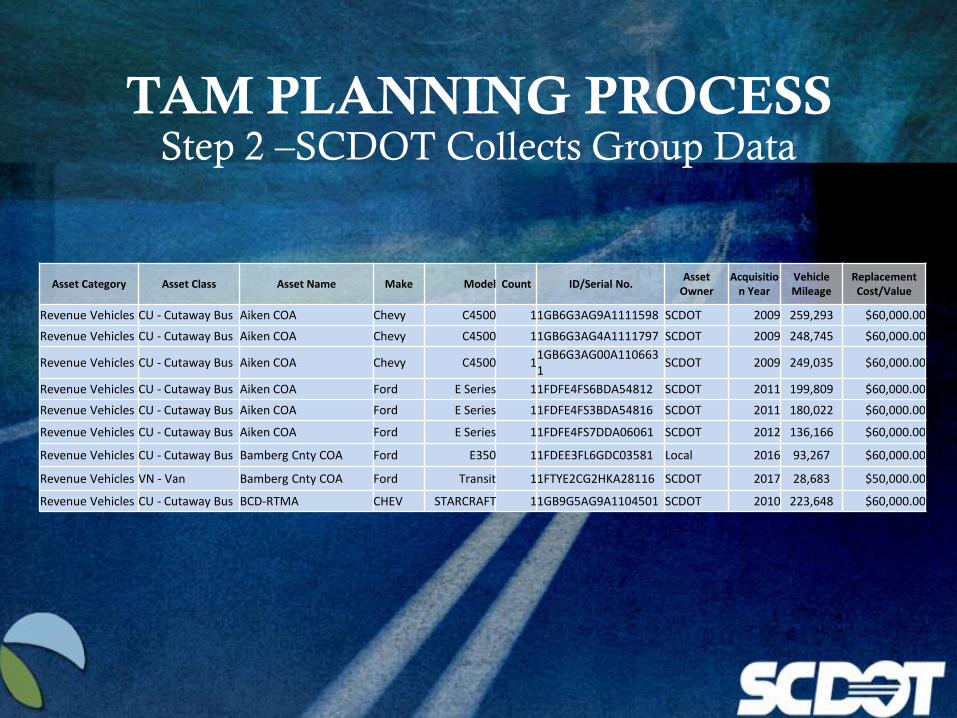
TAM PLANNING PROCESSStep 2 –SCDOT Collects Group Data
Asset Category Asset Class Asset Name Make Model Count ID/Serial No.Asset
OwnerAcquisitio
n YearVehicle Mileage
Replacement Cost/Value
Revenue Vehicles CU - Cutaway Bus Aiken COA Chevy C4500 11GB6G3AG9A1111598 SCDOT 2009 259,293 $60,000.00
Revenue Vehicles CU - Cutaway Bus Aiken COA Chevy C4500 11GB6G3AG4A1111797 SCDOT 2009 248,745 $60,000.00
Revenue Vehicles CU - Cutaway Bus Aiken COA Chevy C4500 11GB6G3AG00A1106631
SCDOT 2009 249,035 $60,000.00
Revenue Vehicles CU - Cutaway Bus Aiken COA Ford E Series 11FDFE4FS6BDA54812 SCDOT 2011 199,809 $60,000.00
Revenue Vehicles CU - Cutaway Bus Aiken COA Ford E Series 11FDFE4FS3BDA54816 SCDOT 2011 180,022 $60,000.00
Revenue Vehicles CU - Cutaway Bus Aiken COA Ford E Series 11FDFE4FS7DDA06061 SCDOT 2012 136,166 $60,000.00
Revenue Vehicles CU - Cutaway Bus Bamberg Cnty COA Ford E350 11FDEE3FL6GDC03581 Local 2016 93,267 $60,000.00
Revenue Vehicles VN - Van Bamberg Cnty COA Ford Transit 11FTYE2CG2HKA28116 SCDOT 2017 28,683 $50,000.00
Revenue Vehicles CU - Cutaway Bus BCD-RTMA CHEV STARCRAFT 11GB9G5AG9A1104501 SCDOT 2010 223,648 $60,000.00

TAM PLANNING PROCESSStep 3 –Reviews Asset Condition
Asset Category/Class Count Avg Age Avg MileageAvg TERM Condition
Avg Value % At or Past ULB
Revenue Vehicles 365 7.4 174,160 N/A $177,095.89 18.90%
AB - Articulated Bus 0 - - N/A - -
AO - Automobile 0 - - N/A - -
BR - Over-the-road Bus 0 - - N/A - -
BU - Bus 89 7.6 202,233 N/A $550,000.00 7.87%
CU - Cutaway Bus 230 7.4 174,894 N/A $59,304.35 21.30%
DB - Double Decked Bus 0 - - N/A - -

TAM PLANNING PROCESSStep 3 –Decision support tool/process will rely critical asset
management
Process/Tool Brief Description
Asset Condition Information SystemA software system that uses asset inventory and condition information to generate 5 to 10-year condition forecasts.
Asset Condition
Condition: 5=Excellent (No visible defects, near new condition)4=Good (Some slightly defective/deteriorated parts)3 = Fair (Moderately defective/ deteriorated parts)2=Marginal (Defective/deteriorated parts need replacement)1= Poor (Past useful life and in need of prioritized repair or replacement)D= Disposal (Scheduled for disposal within 6 months)
Investment Prioritization
SCDOT will rely on its analytical asset management software to assist in making these determinations based on the following weighted criteria: Asset Condition – 65%Safety & Security - 10%Reliability - 20%O & M Cost - 5%OPT defined - 0%
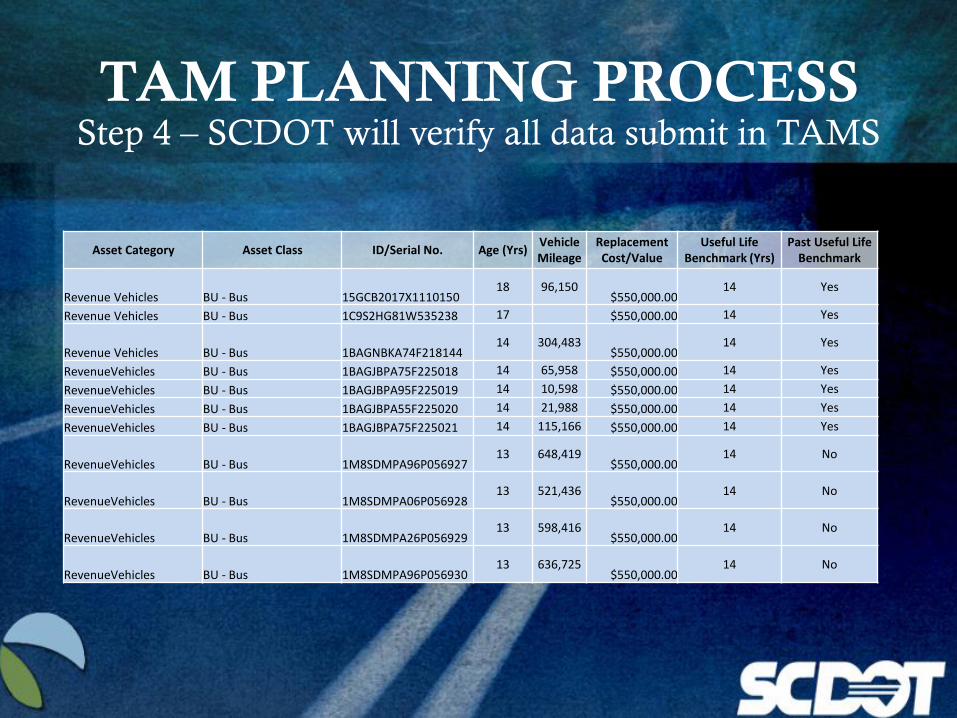
TAM PLANNING PROCESSStep 4 – SCDOT will verify all data submit in TAMS
Asset Category Asset Class ID/Serial No. Age (Yrs)Vehicle Mileage
Replacement Cost/Value
Useful Life Benchmark (Yrs)
Past Useful Life Benchmark
Revenue Vehicles BU - Bus 15GCB2017X111015018 96,150
$550,000.0014 Yes
Revenue Vehicles BU - Bus 1C9S2HG81W535238 17 $550,000.00 14 Yes
Revenue Vehicles BU - Bus 1BAGNBKA74F21814414 304,483
$550,000.0014 Yes
RevenueVehicles BU - Bus 1BAGJBPA75F225018 14 65,958 $550,000.00 14 Yes
RevenueVehicles BU - Bus 1BAGJBPA95F225019 14 10,598 $550,000.00 14 Yes
RevenueVehicles BU - Bus 1BAGJBPA55F225020 14 21,988 $550,000.00 14 Yes
RevenueVehicles BU - Bus 1BAGJBPA75F225021 14 115,166 $550,000.00 14 Yes
RevenueVehicles BU - Bus 1M8SDMPA96P05692713 648,419
$550,000.0014 No
RevenueVehicles BU - Bus 1M8SDMPA06P05692813 521,436
$550,000.0014 No
RevenueVehicles BU - Bus 1M8SDMPA26P05692913 598,416
$550,000.0014 No
RevenueVehicles BU - Bus 1M8SDMPA96P05693013 636,725
$550,000.0014 No

TAM PLANNING PROCESSStep 5 – SCDOT Analyze data and sets up funding priority
• Review agency goals for reasonableness
• Review ULB and decision making process data
• Work with providers to develop condition codes for assets
• Develop TAM plan in collaboration with agencies no later than June
30th 2018
• Post TAM plan to NTD by January, 2019

Contact Information
SC Department of Transportation
955 Park St.
Columbia, SC 29201
Public Transit Director: Johnny Mmanu-ike
E-mail: [email protected]
Phone: 803-737-0996


