Journal of International Economics 74 (2008) 402–421www.elsevier.com/locate/econbase
Welfare gains from Foreign Direct Investmentthrough technology transfer to local suppliers☆
Garrick Blalock a,⁎, Paul J. Gertler b,c
a Cornell University, Department of Applied Economics and Management, 346 Warren Hall, Ithaca, NY 14853, USAb University of California, Berkeley, Haas School of Business, USA
c NBER, USA
Received 5 July 2005; received in revised form 30 January 2007; accepted 21 May 2007
Keywords: Foreign Direct Investment; Technology transfer; Productivity; Supply chain
JEL classification: F23; O14; O12; H41
1. Introduction
Many countries try to attract Foreign Direct Investment (FDI) with costly public programs such as tax holidays,subsidized industrial infrastructure, and duty exemptions. Is this enthusiasm for FDI warranted? In this paper, we
☆ We are indebted to Indra Surbakti, Fitria Fitrani, Kai Kaiser, and Jack Molyneaux for their assistance in compiling the data. We received helpfuladvice from David I. Levine, David C. Mowery, Pranab Bardhan, Ann Harrison, Mary Amiti, Nina Pavcnik, James E. Blalock, Haryo Aswicahyono,Thee Kian Wei, and two anonymous referees. We thank the Institute of Business and Economic Research (IBER) and Management of Technology(MOT) program, both at the University of California, Berkeley, for their generous financial support. We received helpful comments from seminarparticipants at The Pennsylvania State University and the London School of Economics and Political Science. Finally, we are grateful to the factorymanagers in Indonesia who kindly participated in interviews.⁎ Corresponding author. Tel.: +1 607 255 0307; fax: +1 607 255 9984.E-mail addresses: [email protected] (G. Blalock), [email protected] (P.J. Gertler).
403G. Blalock, P.J. Gertler / Journal of International Economics 74 (2008) 402–421
investigate the hypothesis that multinational firms transfer technology to their domestic suppliers and that this transfergenerates greater competition and lower prices that benefit the entire economy. If true, the effect on competition mayjustify public encouragement of FDI.
Recently, a number of authors have argued that that multinationals may deliberately transfer technology to localsuppliers as part of a strategy to build efficient supply chains for overseas operations (Pack and Saggi, 2001; Blalock,2002; Javorcik, 2004). By transferring technology to local suppliers the downstream multinationals lower the cost ofnon-labor inputs. This cost-reduction motive implies that multinationals transfer technology to suppliers because itconfers a private benefit to them. However, unless there is an additional social benefit, there is no case for publicsubsidies to stimulate technology transfers from multinationals.
How might social benefits develop? The primary motivation for multinationals to transfer technology to suppliers isto enable higher quality inputs at lower prices. One problem with this strategy is that if the enabling technology istransferred to only one upstream vendor, then the multinational is vulnerable to hold-up. To mitigate hold-up risk, themultinational could diffuse the technology widely—either by direct transfer to additional firms or by encouragingspillover from the original recipient. Wide diffusion of the technology would then encourage entry into the suppliermarket, thereby increasing competition and lowering prices. However, the multinational cannot prevent the upstreamsuppliers from also selling to others in downstream markets. The lower input prices may induce entry and thereforemore competition in downstream markets, which lowers prices and increases output. Pack and Saggi (2001) show thattheoretically, as long as there is not too much entry, profits will rise in both the downstream and upstream markets. If so,the new surplus generated from increased productivity and the deadweight loss reduced from increased competitionwill be split between consumers and producers in a Pareto-improving distribution.
In this paper we test the hypotheses that FDI leads to a Pareto-superior increase in welfare via these mechanisms.Specifically, we examine whether there were transfers of technology along the supply chain, whether the technologytransfer leads to increased competition, and whether the increased competition induced welfare improvements in termsof lower prices, greater production, and higher profits in both the supply market and in industries downstream of thesupply market. Our chief contribution is to establish and quantify the welfare enhancing externalities of verticaltechnology transfer.
The analysis is in two parts. The first part measures the effect of FDI on local supplier productivity by estimating aproduction function using a rich panel dataset on local- and foreign-owned Indonesian manufacturing establishments.In a number of industries, the realized productivity gain is more than 2%. The second part of the paper examines themarket and welfare effects of technology diffusion from FDI. We find that downstream FDI increases the output andprofits of upstream firms, and decreases prices and concentration of upstream markets. We also find increased outputand profits among downstream firms, and decreased prices and market concentration in markets downstream ofmarkets supplying multinationals. In sum, our findings suggest several welfare effects—i.e., benefits for consumers interms of lower prices and for firms in the form of greater profitability—transmitted both up and down the supply chainfrom the adoption of technology brought with FDI.
2. Conceptual framework
Policymakers often cite technology diffusion to host country firms as a benefit of Foreign Direct Investment (FDI).This belief proliferates in part because of impressive claims of technological development from FDI, such as those ofthe World Bank (1993), p. 1, which says that “[FDI] brings with it considerable benefits: technology transfer,management know-how, and export marketing access. Many developing countries will need to be more effective inattracting FDI flows if they are to close the technology gap with high-income countries, upgrade managerial skills, anddevelop their export markets.”
The proponents offer three explanations for how technology spillovers occur from multinationals to domestic firms.First, local firms may be able to learn simply by observing and imitating the multinationals. Second, employees mayleave multinationals to create or join local firms. Third, multinational investment may encourage the entry ofinternational trade brokers, accounting firms, consultant companies, and other professional services, which then maybecome available to local firms as well.
However, a number of recent empirical studies, which find mixed evidence of technology transfer from FDI, haveprompted many observers to question its existence. Rodrik (1999), p. 37, in a summary of the evidence, comments,“today's policy literature is filled with extravagant claims about positive spillovers from FDI, [but] the hard evidence is
404 G. Blalock, P.J. Gertler / Journal of International Economics 74 (2008) 402–421
sobering.” The studies to which Rodrik refers ask if local competitors benefit from a positive externality, or“technology spillover,” generated by multinational entry in the same industry.1
Indeed, it is hard to believe that such horizontal spillovers are likely. First, the technology gap between foreign anddomestic firms may often be wide. Local firms may lack the absorptive capacity needed to recognize and adopt newtechnology. Similarly, the degree to which foreign and domestic firms actually compete in the same market will alsovary. Domestic firms may produce for the local market while multinationals produce for export. Because of differencesin quality and other attributes, exported and domestically consumed goods may entail different production methodswhich reduce the potential for technology transfer. Second, multinationals may enact measures to minimize technologyleakage to local competitors. Multinationals with non-protectable technology may not enter the market at all if they relyon a technological advantage to sustain rents. Further, foreign firms typically pay managers higher wages to discouragetechnology leakage through former employees. In fact, because of the higher wages, foreign firms may instigate a“brain drain” that lures the most capable managers away from domestic firms.
In contrast, technological benefits to local firms through vertical linkages are much more likely since themultinational has incentives to provide technology to suppliers. Vertical technology transfer could occur through bothbackward (from buyer to supplier) and forward (from supplier to buyer) linkages. Because most multinationals inIndonesia are export-oriented and generally do not supply to Indonesian customers, we focus here on technologytransfer through backward linkages. That is, we examine the effect of downstream FDI on the performance of localsuppliers.
Two arguments suggest that supply chains may be a conduit for technology transfer. First, whereas multinationalsseek to minimize technology leakage to competitors, they also have incentives to improve the productivity of theirsuppliers through training, quality control, and inventory management, for example. To reduce dependency on a singlesupplier, the multinational may establish such relationships with multiple vendors. These relationships likely benefit allfirms which purchase these vendors' output. Second, while the technology gap between foreign and domesticproducers may limit within-industry technology transfer, multinationals likely procure inputs requiring lesssophisticated production techniques for which the gap is narrower.
Evidence of technology transfer through vertical supply chains is well documented in case studies. For example,Kenney and Florida (1993) and Macduffie and Helper (1997) provide a rich description of technology transfer to U.S.parts suppliers following the entry of Japanese automobile makers. However, until recently empirical analysis is limitedto small samples, such as Lall (1980), which documents technology transfer from foreign firms through backwardlinkages in the Indian trucking industry. Blalock (2002) finds evidence of technology transfer through the supply chainin production function estimates in Indonesia, and Javorcik (2004) finds similar results in Lithuania.
Multinationals transfer technology to suppliers to reduce input costs and increase quality. However, if themultinational aids only a single supplier, the supplier can play hold-up and capture all of the rents from its increasedproductivity. In this case, the multinational would not benefit from the technology transfer. The multinational couldovercome this vulnerability, however, by distributing the technology widely to multiple suppliers and potential marketentrants. This would create multiple sources of superior supply and would encourage entry (competition) that wouldlower supply prices. Total surplus rises because the new technology increases productivity and because the deadweightfrom imperfect competition falls. The downstream multinational captures some of the rent because the prices it pays forsupplies have fallen. However, if there is not too much entry, suppliers may also capture some of the rent because ofprofits resulting from increased productivity and sales (Pack and Saggi, 2001).
Although the multinational has an incentive to aid many suppliers, doing so may inadvertently assist competitors ifthe more productive supply base is a non-excludable benefit. In other words, the multinational cannot prevent its nowmore productive suppliers from also selling to the multinational's rivals at lower prices. The lower supply prices mayinduce entry and increase competition so that prices fall in the downstream markets as well. In sum, these actionsincrease surplus by lowering costs of production and by reducing deadweight loss from imperfect competition.Moreover, the lower supply prices not only increase surplus in the multinational's market, but also in all of the marketsto which the suppliers sell.
In a developing country, where export-oriented foreign firms are generally more productive than domestic firms andseldom compete with domestic makers anyway, aiding local buyers may not concern multinationals. However, foreign
1 Examples of empirical papers measuring technology spillovers include Blomstrom and Wolff (1994), Haddad and Harrison (1993), Kokko(1994), Aitken and Harrison (1999), and Haskel et al. (2002). See Moran (2001) and Keller (2004) for excellent surveys of the evidence.
405G. Blalock, P.J. Gertler / Journal of International Economics 74 (2008) 402–421
firms may be concerned that their investment in the local supply chain will eventually benefit later foreign entrants.Given this possibility, one might think that foreign firms would be reluctant to transfer technology to suppliers.
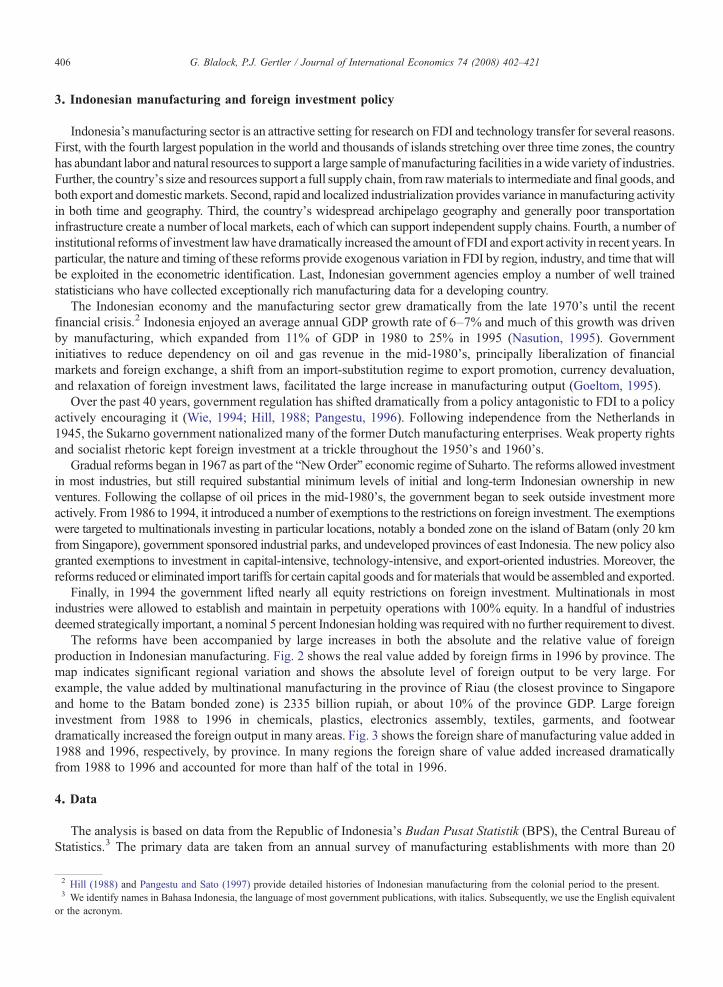
The structural model in Pack and Saggi (2001) shows that, provided new competition is not too great, the benefits ofa competitive supply base to the multinational buyer outweigh the rents lost to free-loading rivals. Perhaps surprisingly,technology diffusion and leakage to other local suppliers can also benefit the initial local recipient. In the case of asingle supplier and just one buyer with some market power, both parties set prices above marginal cost—the “doublemarginalization problem.” If technology diffusion to other upstream firms allows more capable suppliers to enter, thenone would expect market concentration and input prices to fall. Further, given the benefit of lower-priced inputs, firmsdownstream of that supply industry will lower prices and increase output, and new firm entry may occur. The strongerdemand downstream would, in turn, prompt higher output upstream that would help the initial technology recipient.Lower prices and greater volume clearly generate a surplus for consumers. Pack and Saggi note that in some cases,firms also may capture some of this surplus because the benefits of lower input prices and higher volume outweigh thecosts of greater competition. Here, we would expect to see firm profits rise. Fig. 1 illustrates the total effect of FDI.
If the above argument is true, then technology transfer to suppliers is in multinationals' interest, but the benefitsaccrue widely to all industries and consumers not only through improved productivity, but also through increasedcompetition resulting in a lower deadweight loss. Hence, technology transfer induces a Pareto improvement in welfare.However, a multinational might not take into account the social benefits of increased competition, and therefore maytransfer too little technology. In this case, it would be socially optimal to facilitate the transfer of technology frommultinationals to local suppliers.
Although the specific mechanisms for technology transfer described above are typically un-observable in the data,one can identify technology transfer indirectly by otherwise unexplained productivity gains. If vertical supply chainsare a conduit for technology transfer, then one would expect, ceteris paribus, that local firms in industries and regionswith growing levels of downstream FDI would show greater productivity growth compared to other local firms.Further, one would expect to see lower concentration, lower prices, higher output, and higher profits in thesebeneficiary industries, as well as in industries downstream of them. The methodology for testing the productivityeffects is described in Sections 5 and 6, and the methodology and results for the market and welfare effects and theresults are described in Section 7. Both are preceded by some background on Indonesian manufacturing and adescription of the data in the following two sections.
Fig. 1. Flow of technology and welfare effects from FDI.
406 G. Blalock, P.J. Gertler / Journal of International Economics 74 (2008) 402–421
3. Indonesian manufacturing and foreign investment policy
Indonesia's manufacturing sector is an attractive setting for research on FDI and technology transfer for several reasons.First, with the fourth largest population in the world and thousands of islands stretching over three time zones, the countryhas abundant labor and natural resources to support a large sample ofmanufacturing facilities in awide variety of industries.Further, the country's size and resources support a full supply chain, from rawmaterials to intermediate and final goods, andboth export and domesticmarkets. Second, rapid and localized industrialization provides variance inmanufacturing activityin both time and geography. Third, the country's widespread archipelago geography and generally poor transportationinfrastructure create a number of local markets, each of which can support independent supply chains. Fourth, a number ofinstitutional reforms of investment law have dramatically increased the amount of FDI and export activity in recent years. Inparticular, the nature and timing of these reforms provide exogenous variation in FDI by region, industry, and time that willbe exploited in the econometric identification. Last, Indonesian government agencies employ a number of well trainedstatisticians who have collected exceptionally rich manufacturing data for a developing country.
The Indonesian economy and the manufacturing sector grew dramatically from the late 1970's until the recentfinancial crisis.2 Indonesia enjoyed an average annual GDP growth rate of 6–7% and much of this growth was drivenby manufacturing, which expanded from 11% of GDP in 1980 to 25% in 1995 (Nasution, 1995). Governmentinitiatives to reduce dependency on oil and gas revenue in the mid-1980's, principally liberalization of financialmarkets and foreign exchange, a shift from an import-substitution regime to export promotion, currency devaluation,and relaxation of foreign investment laws, facilitated the large increase in manufacturing output (Goeltom, 1995).
Over the past 40 years, government regulation has shifted dramatically from a policy antagonistic to FDI to a policyactively encouraging it (Wie, 1994; Hill, 1988; Pangestu, 1996). Following independence from the Netherlands in1945, the Sukarno government nationalized many of the former Dutch manufacturing enterprises. Weak property rightsand socialist rhetoric kept foreign investment at a trickle throughout the 1950's and 1960's.
Gradual reforms began in 1967 as part of the “NewOrder” economic regime of Suharto. The reforms allowed investmentin most industries, but still required substantial minimum levels of initial and long-term Indonesian ownership in newventures. Following the collapse of oil prices in the mid-1980's, the government began to seek outside investment moreactively. From 1986 to 1994, it introduced a number of exemptions to the restrictions on foreign investment. The exemptionswere targeted to multinationals investing in particular locations, notably a bonded zone on the island of Batam (only 20 kmfrom Singapore), government sponsored industrial parks, and undeveloped provinces of east Indonesia. The new policy alsogranted exemptions to investment in capital-intensive, technology-intensive, and export-oriented industries. Moreover, thereforms reduced or eliminated import tariffs for certain capital goods and formaterials that would be assembled and exported.
Finally, in 1994 the government lifted nearly all equity restrictions on foreign investment. Multinationals in mostindustries were allowed to establish and maintain in perpetuity operations with 100% equity. In a handful of industriesdeemed strategically important, a nominal 5 percent Indonesian holdingwas required with no further requirement to divest.
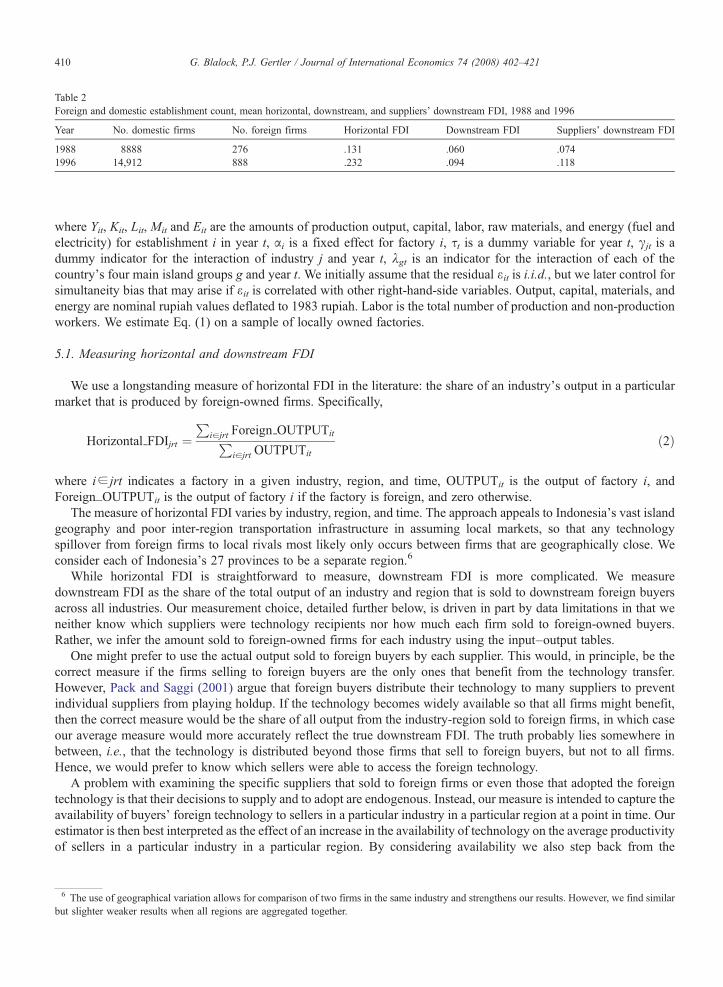
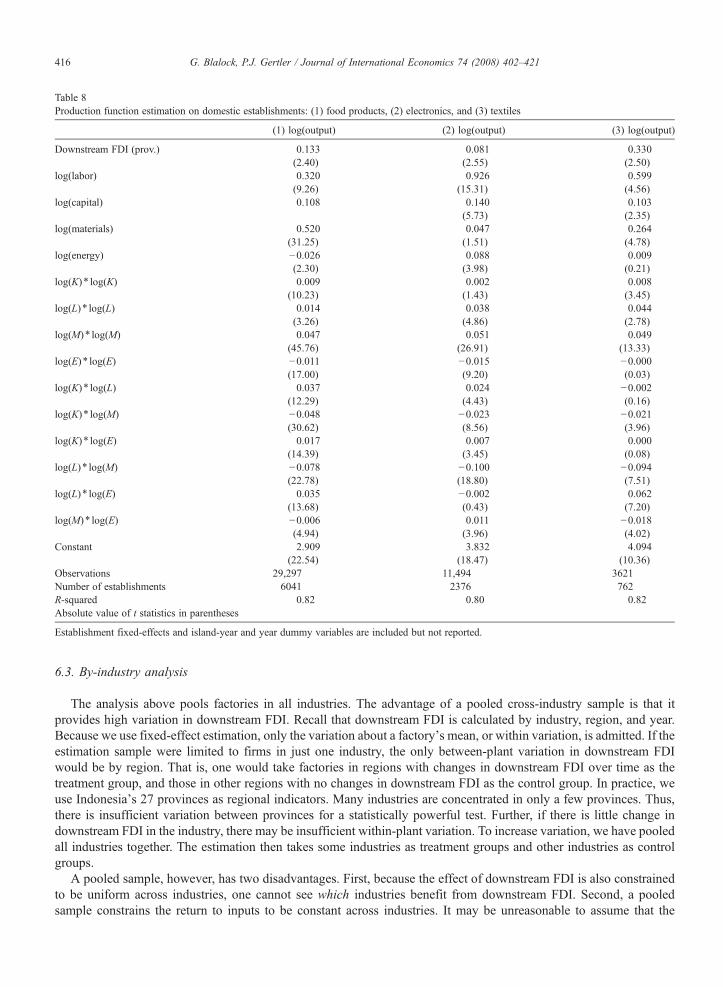
The reforms have been accompanied by large increases in both the absolute and the relative value of foreignproduction in Indonesian manufacturing. Fig. 2 shows the real value added by foreign firms in 1996 by province. Themap indicates significant regional variation and shows the absolute level of foreign output to be very large. Forexample, the value added by multinational manufacturing in the province of Riau (the closest province to Singaporeand home to the Batam bonded zone) is 2335 billion rupiah, or about 10% of the province GDP. Large foreigninvestment from 1988 to 1996 in chemicals, plastics, electronics assembly, textiles, garments, and footweardramatically increased the foreign output in many areas. Fig. 3 shows the foreign share of manufacturing value added in1988 and 1996, respectively, by province. In many regions the foreign share of value added increased dramaticallyfrom 1988 to 1996 and accounted for more than half of the total in 1996.
4. Data
The analysis is based on data from the Republic of Indonesia's Budan Pusat Statistik (BPS), the Central Bureau ofStatistics.3 The primary data are taken from an annual survey of manufacturing establishments with more than 20
2 Hill (1988) and Pangestu and Sato (1997) provide detailed histories of Indonesian manufacturing from the colonial period to the present.3 We identify names in Bahasa Indonesia, the language of most government publications, with italics. Subsequently, we use the English equivalent
or the acronym.
Fig. 2. Value added in manufacturing, 1996, by province.
407G. Blalock, P.J. Gertler / Journal of International Economics 74 (2008) 402–421
employees conducted by Biro Statistik Industri, the Industrial Statistics Division of BPS. Additional data include theinput–output table and several input and output price deflators.
The principal dataset is the Survei Tahunan Perusahaan Industri Pengolahan (SI), the Annual ManufacturingSurvey conducted by the Industrial Statistics Division of BPS. The SI dataset is designed to be a complete annualenumeration of all manufacturing establishments with 20 or more employees from 1975 onward. Depending on theyear, the SI includes up to 160 variables covering industrial classification (5-digit ISIC), ownership (public, private,foreign), status of incorporation, assets, asset changes, electricity, fuels, income, output, expenses, investments, labor(head count, education, wages), raw material use, machinery, and other specialized questions.
BPS submits a questionnaire annually to all registered manufacturing establishments, and field agents attempt tovisit each non-respondent to either encourage compliance or confirm that the establishment has ceased operation.4
Because field office budgets are partly determined by the number of reporting establishments, agents have someincentive to identify and register new plants. In recent years, over 20,000 factories have been surveyed annually.Government laws guarantee that the collected information will only be used for statistical purposes. However, severalBPS officials commented that some establishments intentionally misreport financial information out of concern that taxauthorities or competitors may gain access to the data. Because the fixed-effect analysis admits only within-factory
4 Because some firms may have more than one factory, we henceforth refer to each observation as an establishment, plant, or factory. BPS alsosubmits a different questionnaire to the head office of every firm with more than one factory. Although these data were not available for this study,early analysis by BPS suggests that less than 5% of factories belong to multi-factory firms. We thus generalize our results to firms in our discussion.
Fig. 3. Share of manufacturing value added by foreign firms, by region, 1998 (top) and 1996 (bottom).
408 G. Blalock, P.J. Gertler / Journal of International Economics 74 (2008) 402–421
variation on a logarithmic scale, errors of under- or over-reporting will not bias the results provided that each factoryconsistently misreports over time. Further, even if the degree of misreporting for a factory varies over time, the resultswill be unbiased provided the misreporting is not correlated with other factory attributes in the right-hand-side of theregression.
The analysis here starts from 1988, the first year data on fixed assets are available. To avoid measurement error inprice and other uncertainties introduced by the 1997–1998 Asian financial crisis, the last year of analysis is 1996. Thekey variables are described in an appendix available on request from the authors and summarized for 1988 and 1996 inTable 1. On average, foreign factories are bigger (as measured by profits, employees, and capital), more capitalintensive (as measured by capital per employee), more productive (as measured by profits per employee), and more
Table 1Descriptive statistics by foreign and domestic firms, 1988 and 1996
Capital, materials, energy, and profits are reported in thousands of 1988 rupiah.We proxy profits with revenue minus wages and the cost of materials and energy.
409G. Blalock, P.J. Gertler / Journal of International Economics 74 (2008) 402–421
export-oriented (as measured by percentage of production exported).5 Table 2 shows the sample count, which grewfrom 8888 to 14,912 and from 276 to 888 for domestic and foreign factories respectively.
We derived inter-industry supply chains using input–output (IO) tables published by BPS in 1990 and 1995. Thetables show the value added of goods and services produced by industry and how this value is distributed to otherindustries. The IO tables divide manufacturing activity into 89 industries, and BPS provides concordance tables linkingthe 1990 and 1995 IO codes to 5-digit ISIC codes as described in an appendix available from the authors.
We deflated output, materials, energy, and capital to express values in real terms. An appendix available from theauthors describes the deflator calculation in detail.
Not surprisingly, particularly in a developing country environment, there is a high level of non-reporting and obviouserroneous responses to many survey questions, particularly questions that require some accounting expertise, such as thereplacement and book value of fixed assets. We removed establishments with especially frequent non-responses tofundamental questions such as number of employees. In other cases, we imputed some variables to correct for non-reporting in just one or two years, or to fix obvious clerical mistakes in data keypunching. We cleaned each variableindependently and only removed establishments from the analysis for which the needed variables could not be constructed.For example, establishments with missing wage data could be used for the output regression but not for the profitsregression. Thus, readers will notice slight differences in the sample count across different regressions. We also note thatanalysis on completely raw data yields very similar results to what we report here, although standard errors are slightlyhigher. An appendix available from the authors describes the process by which we prepared the data in more detail.
5. Productivity effects
Our strategy to identify the effect of downstream FDI on productivity is to examine whether domesticestablishments which sell more to foreign-owned firms produce more, ceteris paribus. We estimate this effect using atranslog production function with establishment fixed effects, industry-year and year-island dummies, and measures ofFDI. The production function controls for input levels and scale effects. The establishment fixed effects control fortime-invariant differences across industries and firms, and the industry-year and year-island dummies control forchanges common to all firms in an industry or part of the country at a particular time. We specify the establishment-level translog production function as:
5 We proxy profits with revenue minus wages and the cost of materials and energy. This is similar to EBITDA (Earnings before interest, taxes,depreciation, and amortization), a common proxy for profitability.
Table 2Foreign and domestic establishment count, mean horizontal, downstream, and suppliers' downstream FDI, 1988 and 1996
410 G. Blalock, P.J. Gertler / Journal of International Economics 74 (2008) 402–421
where Yit, Kit, Lit, Mit and Eit are the amounts of production output, capital, labor, raw materials, and energy (fuel andelectricity) for establishment i in year t, αi is a fixed effect for factory i, τt is a dummy variable for year t, γjt is adummy indicator for the interaction of industry j and year t, λgt is an indicator for the interaction of each of thecountry's four main island groups g and year t. We initially assume that the residual εit is i.i.d., but we later control forsimultaneity bias that may arise if εit is correlated with other right-hand-side variables. Output, capital, materials, andenergy are nominal rupiah values deflated to 1983 rupiah. Labor is the total number of production and non-productionworkers. We estimate Eq. (1) on a sample of locally owned factories.
5.1. Measuring horizontal and downstream FDI
We use a longstanding measure of horizontal FDI in the literature: the share of an industry's output in a particularmarket that is produced by foreign-owned firms. Specifically,
Horizontal FDIjrt ¼P
iajrt Foreign OUTPUTitPiajrt OUTPUTit
ð2Þ
where i∈ jrt indicates a factory in a given industry, region, and time, OUTPUTit is the output of factory i, andForeign_OUTPUTit is the output of factory i if the factory is foreign, and zero otherwise.
The measure of horizontal FDI varies by industry, region, and time. The approach appeals to Indonesia's vast islandgeography and poor inter-region transportation infrastructure in assuming local markets, so that any technologyspillover from foreign firms to local rivals most likely only occurs between firms that are geographically close. Weconsider each of Indonesia's 27 provinces to be a separate region.6
While horizontal FDI is straightforward to measure, downstream FDI is more complicated. We measuredownstream FDI as the share of the total output of an industry and region that is sold to downstream foreign buyersacross all industries. Our measurement choice, detailed further below, is driven in part by data limitations in that weneither know which suppliers were technology recipients nor how much each firm sold to foreign-owned buyers.Rather, we infer the amount sold to foreign-owned firms for each industry using the input–output tables.
One might prefer to use the actual output sold to foreign buyers by each supplier. This would, in principle, be thecorrect measure if the firms selling to foreign buyers are the only ones that benefit from the technology transfer.However, Pack and Saggi (2001) argue that foreign buyers distribute their technology to many suppliers to preventindividual suppliers from playing holdup. If the technology becomes widely available so that all firms might benefit,then the correct measure would be the share of all output from the industry-region sold to foreign firms, in which caseour average measure would more accurately reflect the true downstream FDI. The truth probably lies somewhere inbetween, i.e., that the technology is distributed beyond those firms that sell to foreign buyers, but not to all firms.Hence, we would prefer to know which sellers were able to access the foreign technology.
A problem with examining the specific suppliers that sold to foreign firms or even those that adopted the foreigntechnology is that their decisions to supply and to adopt are endogenous. Instead, our measure is intended to capture theavailability of buyers' foreign technology to sellers in a particular industry in a particular region at a point in time. Ourestimator is then best interpreted as the effect of an increase in the availability of technology on the average productivityof sellers in a particular industry in a particular region. By considering availability we also step back from the
6 The use of geographical variation allows for comparison of two firms in the same industry and strengthens our results. However, we find similarbut slighter weaker results when all regions are aggregated together.
411G. Blalock, P.J. Gertler / Journal of International Economics 74 (2008) 402–421
endogeneity issue. Nearly every prior paper in the literature has used the same approach and considered FDI to be ameasure of available technology for the same reasons.
How specifically do we measure the share of industry j's output, in region r, that is sold to foreign firms in year t?From the IO tables we know the amount that firms in one industry purchase from each of the other industries. We alsoknow the share of output in industry j that is produced by foreign-owned firms, i.e., horizontal FDI. If we assume that afirm's share of an industry's demand for a particular input is equal to its output share, then a measure of the share of anindustry's output sold to foreign firms is the sum the output shares purchased by other industries multiplied by the shareof foreign output in each purchasing industry.
For example, consider three industries: wheat flour milling, pasta production, and baking. Suppose that half of thewheat flour industry's output is purchased by the bakery industry and the other half is purchased by the pasta industry.Further, suppose that the bakery industry has no foreign factories but that foreign factories produce half of the pastaindustry output. The calculation of downstream FDI for the flour industry would yield 0.25=0.5(0.0)+0.5(0.5).Formally, Eq. (3) expresses the calculation for industry j, region r, at time t.
Downstream FDIjrt ¼X
k
ajktHorizontal FDIkrt ð3Þ
where αjkt is the proportion of industry j output consumed by industry k. Horizontal FDI is our measure of the share ofan industry's output in a local market that is produced by foreign-owned firms. Values of αjkt before and including 1990follow from the 1990 IO table, values of αjkt from 1991 through 1994 are linear interpolations of the 1990 and 1995 IOtables, and values of αjkt from 1995 on are from the 1995 IO table. Recall that αjkt does not have a region r subscriptbecause the IO table is compiled for the entire national economy.
The measure of downstream FDI varies by industry, and time. Again, the approach appeals to Indonesia's vast islandgeography and poor inter-region transportation infrastructure in assuming local markets, i.e., that intermediate goodsoutput is consumed by firms in the same region. Tables 2 and 3 show some summary statistics for and the correlationsbetween these two measures of FDI and a third measure described in the next section. Tables 4 and 5 show the 25industries with the highest levels of downstream and horizontal FDI, respectively, in 1996.
Finally, we also note that we calculate downstream FDI at the region-level but only have a national IO table. Wecannot observe differences in the true input–output relationship across regions and over time. Visual inspection of the1990 and 1995 IO tables shows relatively little change, but we do not know precisely how much variation there isacross regions. Our priors are that production technologies should not depend, per se, on location, so we expect the IOtable to be relatively stable across regions. But, we cannot be sure. In short, like most empirical studies, ours certainlyincludes some measurement error. In fixed effect estimation, this measurement error tends to downward biascoefficient. So, our estimated effect of downstream FDI likely understate the true effect.
5.2. Identification and estimation
One concern in the estimation of the production function is that the inputs and downstream FDI are choice variables.In the later case, foreign investors may be attracted to industries and regions that have more productive suppliers.Correlations between downstream FDI and productivity thus would be explained by multinational location choicesrather than by technology transfers to suppliers. In order to establish technology transfer as the dominant explanation,we detail our identification strategy below. We also briefly discuss anecdotal evidence and survey results that supporttechnology transfer as the likely explanation for our finding.
There are a number of reasons why downstream FDI might be correlated with the error term in the productionfunction. First, multinationals might buy firms that are located near the most efficient suppliers. We control for this
Table 4Downstream FDI in 1996 for the 25 industries with the highest levels
Industry National Downstream FDI
Sporting and athletics goods 0.75Electrical machinery and apparatus 0.68Machinery and apparatus 0.53Leather tanneries and leather finishing 0.46Musical instruments 0.38Household electronic appliances 0.33Batteries 0.32Basic chemical except fertilizer 0.31Jewelry 0.29Flour except wheat our, milled cereals and peeled root 0.28Ship and its repair 0.27Drying and salting of fish 0.26Knitting mills 0.26Textile 0.25Synthetic resins, plastic and fiber 0.25Kitchen wares, hand tools and agricultural tools 0.22Wheat flour 0.22Other electrical appliances 0.21Yarn and cleaning kapok 0.20Communication equipment and apparatus 0.19Dairy products 0.19Processed tea 0.18Nonferrous basic metal products 0.17Pulp 0.17Other chemical products 0.17
Measurements are at the national level (treating the entire country as one region). Our estimations include regional variation not shown in this table.
Table 5Horizontal FDI in 1996 for the 25 industries with the highest levels
Industry National Horizontal FDI
Sporting and athletics goods 0.96Machinery and apparatus 0.87Pulp 0.85Glass products 0.83Other electrical appliances 0.82Electrical machinery and apparatus 0.82Cosmetics 0.77Pesticides 0.75Household electronic appliances 0.75Communication equipment and apparatus 0.75Basic chemical except fertilizer 0.66Motor cycle 0.64Other metal products 0.56Synthetic resins, plastic and fiber 0.53Jewelry 0.52Other food 0.51Footwear and leather products 0.50Dairy products 0.47Structural metal products 0.46Prime movers engine 0.46Furniture and fixture primarily made of metal 0.43Ship and its repair 0.42Drugs and medicine 0.41Clay and ceramic structural product 0.41Drying and salting of fish 0.39
Measurements are at the national level (treating the entire country as one region). Our estimations include regional variation not shown in this table.
412 G. Blalock, P.J. Gertler / Journal of International Economics 74 (2008) 402–421
413G. Blalock, P.J. Gertler / Journal of International Economics 74 (2008) 402–421
possibility by including establishment fixed effects in the production function. Second, multinationals might buy intofirms supplied by industries whose productivity is growing or expected to grow. We control for this possibility byincluding industry-year fixed effects. Third, multinationals might buy into firms located in areas where supplierproductivity is growing or expected to grow. We control for this possibility by including island-year fixed effects.
Finally, multinationals might locate with the motivation to be supplied by specific sellers which have experienced anidiosyncratic productivity shock. In practice, it seems unlikely that the idiosyncratic portion of the error term would becorrelated with downstream FDI; the long lead time and high transaction costs of investment and contracting withsuppliers suggest that multinationals would invest in industries and regions which offer long-term productivity growthpotential rather than chasing transient boosts to supplier performance. Further, if supply markets are competitive,shocks affecting just one supplier may have little effect on market prices. Nonetheless, the possibility of bias remains.Moreover, unobserved productivity shocks could be correlated with other inputs, such as capital, although the directionof such a simultaneity bias on the downstream FDI coefficient is not clear.
We control for the possible correlations of either downstream FDI or inputs with the idiosyncratic shock by using anestimation procedure suggested by Olley and Pakes (1996). Specifically, it proposes using investment as a proxy foridiosyncratic shocks. The identifying assumption in the Olley–Pakes estimation is that investment is monotonicallyincreasing with respect to the shock, conditional on capital. Because capital responds to the shock only in a laggedfashion through contemporaneous investment, the return to other inputs can be obtained by non-parametricallyinverting investment and capital to proxy for the unobserved shock. An appendix available from the authorssummarizes the Olley–Pakes estimation approach.7
Our causal argument is consistent with the conventional wisdom regarding Indonesia's development and withsurvey evidence of firms elsewhere. As we discussed in Section 3, Indonesia's trade liberalization, not supplierproductivity, prompted the large increase in FDI inflows during the 1990's. Moreover, dozens of case studies andsurveys of multinationals investing in emerging markets, some of which we cite in Section 2, reveal examples oftechnology transfers to local suppliers. For example, Moran (2001) and Moran et al. (2005) provide extensive reviewsof the case studies and surveys of technology transfer from multinationals. The story that appears over and over is thatmultinationals enter, foster relationships with domestic suppliers, and eventually transfer technology or otherwiseencourage productivity gains. For example, one cited survey of Czech Republic firms, Javorcik and Spatareanu (2005),found that 40% of firms that acquired ISO 9000 certification did so to obtain contracts with multinational investorsafter they had entered. In contrast, these surveys of existing literature provide no examples of multinationals enteringmarkets out of attraction for transient gains by local suppliers.
6. Productivity results
Table 6 reports the results of estimating Eq. (1) using an establishment-level fixed-effect estimator on a sample ofdomestic firms.8 All models include establishment, industry-year and island-year fixed effects. Column (1) showsdownstream FDI, column (2) shows horizontal FDI, and column (3) shows the effect of both. The coefficient onhorizontal FDI is close to zero, suggesting that there is little learning from direct foreign competitors. These results areconsistent with the arguments in Rodrik (1999) and findings in Aitken and Harrison (1999) and Javorcik (2004). Noneof our models provide any evidence of horizontal technology transfer.
In contrast, the effect of downstream FDI is large and significant, indicating that firms with growing FDIdownstream acquire technology through the supply chain. Because the estimation is a log-linear production function,the coefficients approximate elasticities and have intuitive interpretations. The 0.087 coefficient on downstream FDIsuggests that firm output increases almost 9% as the share of foreign ownership downstream rises from zero to one. Inpractice, increases in share of downstream FDI of approximately 20% are not unusual, suggesting that the actual
7 Although it is possible to obtain the return to capital variables with an optional second stage of estimation, we do not pursue that here sincecapital is not a variable of interest. An additional concern expressed in Olley and Pakes (1996) is that of survivorship bias. If downstream FDI wereassociated with differences in factory survival probability, then changes in the composition of surviving factories could be confounded with changesin individual factories. In our sample, logit estimates of firm deaths reveal no significant correlation between downstream FDI and survivalprobabilities.8 A Hausman test showed significant correlation between individual establishment effects and the other regressors, thereby rejecting a random-
effects model.
Table 6Production function estimation on domestic establishments
Observations 108,100 108,100 108,100 108,100 108,100 81,112 108,100Number of establishments 23,815 23,815 23,815 0.087 23,815 18,414 23,815R-squared 0.81 0.81 0.81 0.81 0.80 0.79 0.81Absolute value of t statistics in parentheses
(4) Olley–Pakes estimation. (5) With industry-region-year clustering. (6) Population of never-exporting firms. Establishment fixed-effects, industry-year, island-year and year dummy variables are included but not reported.
414 G. Blalock, P.J. Gertler / Journal of International Economics 74 (2008) 402–421
realized productivity gain might be close to 2% (0.2 times 0.087). Table 7 shows the estimated productivity gain basedon the 0.087 point estimate and the actual change in downstream FDI for the industries with a predicted gain of 2% orgreater during 1988–1996.
Column (4) of Table 6 shows the results of the Olley–Pakes estimation. The effect of downstream FDI is statisticallyidentical to that measured without the Olley–Pakes correction. In sum, after allowing for static domestic supplierefficiency, year-industry shocks, island group-year shocks, and idiosyncratic firm-specific shocks, we still see a strongproductivity effect of downstream FDI. If the causality between FDI and productivity gains were the reverse of ourhypothesis, we would expect the effect to disappear when we account for static and transient supplier productivity.
Finally, although the unit of analysis in our estimation is an individual factory, our key variable of interest,downstream FDI, varies at the industry-region-year level. Moulton (1990) shows that if there is a correlation in thedisturbance terms of individual units that share a common aggregate variable value, standard errors can be biaseddownwards in some instances. The intuition of the concern is that the presence of many factory observations within
Table 7Predicted gains in productivity during 1988–1996 from downstream FDI for industries for which the prediction was 2% or greater
Industry Predicted gain
Musicals instruments 0.06Non-ferrous basic metal 0.03Electric generator and electrical motor 0.03Communication equipment and apparatus 0.02Flour except wheat four, milled cereals 0.02Jewelry 0.02Knitting mills 0.02Leather tanneries and leather finishing 0.02Other electrical appliances 0.02Prime movers and engines 0.02
For example, 0.03 indicates a 3 percent increase in output attributable to productivity gains from downstream FDI.
415G. Blalock, P.J. Gertler / Journal of International Economics 74 (2008) 402–421
each cell of actual downstream FDI variation could exaggerate the precision of our estimate. We include industry-yearand island-year dummies, which should partly capture any common disturbances in each cell. Nonetheless, to be sureour results are robust to any disturbance term correlation, we estimate Eq. (1) with clustering at the industry-region-yearlevel. As described in Hoxby (2005), clustering is an over-correction. In most cases, we would significantlyoverestimate the standard errors. Even with this conservative test, the results of which are shown in column (5) ofTable 6, the effect of downstream FDI is still highly significant.
6.1. Correlation with exporting activity
The results so far reveal only the effect on local firms supplying multinationals that operate within Indonesia. Manyof the mechanisms for technology transfer, however, would also benefit local firms that export. Indeed, one wouldexpect some correlation between local firms that supply multinationals within the country and local firms that export.To the extent that local exporters produce products of international quality and price, in-country multinationals wouldbe likely to select them as suppliers. Further, to the extent that local suppliers learn from multinational customers andimprove quality and price, they are more able to export successfully to global markets. Indeed, factory interviewssuggested that multinational customers may sometimes assist their local suppliers in accessing export markets.9
To remove any effects of exporting, we estimated Eq. (1) on a sample including only never-exporting domesticfirms. Column (6) of Table 6 shows that the positive effect of downstream FDI holds and suggests that exports are not aviable alternative explanation for the observed productivity gains.
6.2. Public goods from FDI
The correlation between downstream FDI and local plant productivity could be explained by multinationals'provision of public goods rather than by technology transfer. For example, if multinational entry leads to the building ofnew roads or the installation of more reliable electricity-generating facilities, then local firm productivity may increasewithout any transfer of technology. Since the provision of these public goods would likely be correlated withdownstream FDI, analysis could erroneously attribute local firm gains from public goods to technology transfer.
To test for the role of public goods, we assume that all plants would benefit from the provision of roads, bridges,ports, etc. Although some industries would benefit more than others, this proposition seems reasonable on the groundsthat public goods are non-excludable. We then estimate Eq. (1) substituting Region_FDIrt, the share of foreign firmshare of industrial output in all industries, for Downstream_FDIjrt. Column (7) of Table 6 shows the insignificantcoefficient on Region_FDI, indicating that public goods do not have a major impact on local firm productivity.
9 See Clerides et al. (1998), Bernard and Bradford Jensen (1999), Aw et al. (2000), Delgado et al. (2002) Van Biesebroeck (2003) and Blalock andGertler (2004) for discussion of firm learning and exporting.
Table 8Production function estimation on domestic establishments: (1) food products, (2) electronics, and (3) textiles
Observations 29,297 11,494 3621Number of establishments 6041 2376 762R-squared 0.82 0.80 0.82Absolute value of t statistics in parentheses
Establishment fixed-effects and island-year and year dummy variables are included but not reported.
416 G. Blalock, P.J. Gertler / Journal of International Economics 74 (2008) 402–421
6.3. By-industry analysis
The analysis above pools factories in all industries. The advantage of a pooled cross-industry sample is that itprovides high variation in downstream FDI. Recall that downstream FDI is calculated by industry, region, and year.Because we use fixed-effect estimation, only the variation about a factory's mean, or within variation, is admitted. If theestimation sample were limited to firms in just one industry, the only between-plant variation in downstream FDIwould be by region. That is, one would take factories in regions with changes in downstream FDI over time as thetreatment group, and those in other regions with no changes in downstream FDI as the control group. In practice, weuse Indonesia's 27 provinces as regional indicators. Many industries are concentrated in only a few provinces. Thus,there is insufficient variation between provinces for a statistically powerful test. Further, if there is little change indownstream FDI in the industry, there may be insufficient within-plant variation. To increase variation, we have pooledall industries together. The estimation then takes some industries as treatment groups and other industries as controlgroups.
A pooled sample, however, has two disadvantages. First, because the effect of downstream FDI is also constrainedto be uniform across industries, one cannot see which industries benefit from downstream FDI. Second, a pooledsample constrains the return to inputs to be constant across industries. It may be unreasonable to assume that the
417G. Blalock, P.J. Gertler / Journal of International Economics 74 (2008) 402–421
marginal product of capital or labor is uniform across industries as varied as fish processing and electronics assembly.Such a constraint could bias the results, although it is not obvious in what direction.
To balance the need for variation in downstream FDI and the desire to have industries with similar technologies inthe treatment and control groups, we selected three groups: a food group, a textile group, and an electronics group.These groups correspond to the 31, 32, and 38 2-digit ISIC codes respectively, which span several IO codes each andhave large between- and within-establishment downstream FDI. Table 8 shows the results of estimating Eq. (1) on thethree samples. The results indicate a strong benefit from downstream FDI in all three industries.
As an additional test to ensure that forcing constant returns to inputs across industries is not affecting our results, weinteracted the inputs with industry dummies. Specifically, we estimated a Cobb–Douglas production function witheach of the inputs interacted with a 3-digit ISIC industry code. The result, a return to downstream FDI of 0.074, isremarkably similar to our baseline estimate from Eq. (1), which was 0.087. We are thus reassured that inter-industryheterogeneity in production technology is not a large concern.
6.4. Price heterogeneity
Our framework suggests that multinationals transfer technology to suppliers to reduce input prices and increasequality. The coupling of technology transfer with price reductions introduces a complication in productivity estimation.Recall that we measure firm output as nominal revenue deflated by the industry price index. In a competitive marketwith homogenous goods, our measure will perfectly correlate with the number of units produced. In differentiatedmarkets, however, technology transfer might selectively affect the prices of the recipient firms and, by extension, theirestimated unit output.10
Fortunately, the likely direction of productivity bias from price heterogeneity is opposite to our findings. Supposethe probable case that foreign buyers obtain lower prices from their suppliers and that these price reductions are notreflected in the industry price index. Deflation would thus understate the unit output of technology-recipient firms anddownward bias the measured effect of downstream FDI for the industry overall.
An alternative argument is to consider an industry with little product differentiation. A market of largely commodityinputs and outputs is less likely to demonstrate price heterogeneity across firms. The strong effect of downstream FDIin the textile industry, often an example of a non-differentiated industry, suggests that it is technology transfer thatexplains the productivity gains of domestic supply industries.
7. Market and welfare effects
The previous section, we believe, provides evidence that productivity increases when the share of output purchasedby foreign firms rises. This is consistent with downstream foreign-owned firms transferring technology to upstreamsuppliers. In this section, we examine the market and welfare consequences of transferring this technology and testwhether it results in Pareto improvements in welfare as hypothesized in Pack and Saggi (2001). In particular, we test thehypotheses that technology transfer upstream to suppliers resulted in entry, lower prices, increased output, and higherprofitability in the upstream market; and that the lower supply prices lead to entry, lower prices, increased output, andincreased profitability in the downstream market.
7.1. Methods and identification
Again, we are not able to directly measure the transfer of technology. Rather, we measure the industries and locationwhere and when foreign companies entered downstream of local companies. We examine the effect of changes in theshare of output purchased by foreign firms on prices, concentration, and profitability in the supply industry.Specifically, we estimate several reduced form models. Eq. (4) measures the effect of FDI on concentration.
HIsrt ¼ b0Downstream FDIjrt þ asr þ λgt þ st þ esrt ð4Þwhere HIsrt is the Herfindahl concentration index for 5-digit ISIC industry s in region r in time t. Note that we use the 89IO table codes, indicated by subscript j, to define industries for supply chains. However, for calculating concentration
10 See Melitz (2000) and Katayama et al. (2003) for a detailed discussion of the estimation concerns.
Obs. 13592 13592 13592 2581 2581 2581No. region-product groups 1982 1982 1982No. product groups 307 307 307R-squared 0.05 0.05 0.05 0.78 0.78 0.78Absolute value of t statistics in parentheses
Region-product fixed effects (for concentration columns), product fixed-effects (for price columns), and year fixed-effects are included but notreported. FDI measures are calculated at the province level (as done for all other tables) in columns (1)–(7). Because we not have regional variation inprices, FDI measures for price estimations are calculated at the national level (treating the entire country as one region).
418 G. Blalock, P.J. Gertler / Journal of International Economics 74 (2008) 402–421
indexes, which do not require the IO table, one can more narrowly define industries by the 329 ISIC codes, indicated bysubscript s. αsr is a fixed-effect for the interaction of industry s and region r, τt is year indicator, and λgt is intended tocapture time-variant conditions affecting particular island groupings of the country, and εsrt is an error term.
Eq. (5) measures the effect of FDI on prices.
Pricest ¼ b0Downstream FDIjt þ as þ st þ est ð5ÞBecause prices are not available at the regional level, we use Downstream_FDI at the national level here. That is,
downstream FDI is calculated as if the entire country were one region.Eqs. (6) and (7) measure the effect of FDI on firm output and profits respectively.11 We proxy profits with revenue
minus wages and the cost of materials and energy. This is similar to EBITDA (earnings before interest, taxes,depreciation, and amortization), a common proxy for profitability.
Yit ¼ b0Downstream FDIjrt þ ai þ λgt þ st þ eit ð6Þ
Profitsit ¼ b0Downstream FDIjrt þ ai þ λgt þ st þ eit ð7ÞWe then consider the hypotheses regarding feedback to downstream markets, in particular, that the lower supply
prices induce entry, lower prices, and higher profits. We test this hypothesis by examining the effects of changes inforeign ownership in industries purchasing from the focal supply industry on the performance of other industriessupplied by that focal industry. In other words, we ask what is the effect of buying from industries that supplymultinationals, and we call this measure suppliers' downstream FDI. We measure suppliers' downstream FDI as thevalue of downstream FDI in each of the industries upstream of the focal industry weighted by the share of focal industryinputs provided by that industry.
SuppliersVDownstream FDIjrt ¼X
k
ajktDownstream FDIkrt ð8Þ
where αjkt is the share of industry j inputs obtained from industry k.
11 The specifications in Eqs. (6) and (7) do not control for time varying firm- and industry-specific productivity shocks that may affect both firmoutcomes and foreign investment in downstream industries. For the reasons discussed in Section 5.2 we believe it is unlikely that a shock to aspecific supplier would increase foreign investment in downstream markets. However, the possibility of an industry-wide productivity shock thatincreases both focal sector outcomes and foreign investment in downstream markets remains.
Obs. 108,615 108,615 108,615 91,616 91,616 91,616Number of establishments 23,861 23,861 23,861 21,377 21,377 21,377R-squared 0.07 0.07 0.07 0.04 0.04 0.04Absolute value of t statistics in parentheses
Establishment fixed-effects and island-year and year dummy variables are included but not reported. We proxy profits with revenue minus wages andthe cost of materials and energy.
419G. Blalock, P.J. Gertler / Journal of International Economics 74 (2008) 402–421
We then re-estimate Eqs. (4)–(7) replacing downstream FDI with suppliers' downstream FDI to gauge the welfareeffects in industries downstream of those industries supplying multinationals.
7.2. Market and welfare results
We estimate the effect of FDI on concentration and prices at the market level-province markets in the case ofconcentration and national markets in the case of prices, for which we do not have regional variation. The effect of FDIon output and profitability is calculated at the firm level.
7.2.1. Concentration and priceTable 9 contains the estimations of Eqs. (4) and (5). Columns (1)–(3) show estimates of regional market
concentration with a fixed effect for each 5-digit ISIC product and province cell. Both downstream FDI and suppliers’downstream FDI are significantly associated with a decrease in market concentration, measured by a Herfindahl index.This association suggests that foreign entry downstream will lead to more competition in upstream supply markets.Likewise, other industries downstream of those upstream markets also show increases in competition.
Columns (4)–(6) on Table 9 display the effect of FDI on prices estimated by Eq. (5). Because we do not haveregional variation in prices, the identifying estimation is by industry and year. Although one may be cautious inassigning causality from such a reduced form estimation, the results are consistent with the notion that FDI competitionlowers prices. In fact, downstream FDI and supplier's downstream FDI are both associated with a decline in prices.
Obs. 5210 5210 5210 4120 4120 4120Number of establishments 1324 1324 1324 1096 1096 1096R-squared 0.22 0.23 0.23 0.13 0.13 0.13Absolute value of t statistics in parentheses
Establishment fixed-effects and island-year and year dummy variables are included but not reported. We proxy profits with revenue minus wages andthe cost of materials and energy.
420 G. Blalock, P.J. Gertler / Journal of International Economics 74 (2008) 402–421
7.2.2. Output and profitsWe next estimate establishment output and the proxy for profits. Given that FDI lowers prices, one expects to see an
increase in output. Indeed, columns (1)–(3) of Table 10 show the effect of FDI on domestic firm output by estimatingEq. (6). Both downstream FDI and suppliers' downstream FDI increase output, likely through the effect of FDI onprices and the demand added by the new entry. Columns (4)–(6) estimate Eq. (7) to show whether domestic firmscapture any of the surplus generated from lower prices and higher output. Again, both downstream FDI and suppliers’downstream FDI lead to greater profits, suggesting that firms are capturing some of the welfare benefits of verticaltechnology transfer.
Table 11 estimates Eqs. (6) and (7) on the population of just foreign firms. As was the case with domestic firms, anincrease in downstream FDI and suppliers' downstream FDI is associated with increases in both volume and profits.
8. Summary and implications
Our findings have two key implications. First, vertical supply chains are a conduit for technology transfer from FDIin emerging markets. Second, this technology generates welfare benefits that may warrant pubic policy intervention.
The observation of technology transfer alone is insufficient to inform public policy. If the full benefit of FDI isinternalized between the two private parties, then there is no need for government intervention. Our results suggestthat FDI does indeed generate an externality–lower prices and greater output–that benefits suppliers, final goodsmakers, and consumers. Because the benefits of FDI to the economy exceed the private returns to both themultinational and its direct suppliers, the total amount of FDI may be less than the socially optimal amount withoutintervention.
To gauge the magnitude of the welfare effect, we calculate a simple “back of the envelope” estimation of producerand consumer surplus gains resulting from FDI in Indonesia during the period of our panel. We can easilyapproximate producer surplus by using the estimation results of Eq. (7) to calculate the effect of FDI on our proxy forprofit. If we assume a linear demand curve, we can obtain a rough estimate of consumer surplus as (p1988−p1996)⁎q1988+ .5(q1996−q1988)⁎ (p1996−p1988). The 1988 price and quantity are in the data and we can forecast the effect ofFDI on the 1996 values by using the results of Eqs. (5) and (6). Our simple calculations show that producer surplusincreased by 1.1% in intermediate goods industries and by 0.7% in final goods industries. We find a consumer surplusincrease of 5.8% relative to total sales in final goods industries. Although only rough approximations, the producerand consumer surplus measures are economically substantial.
On the basis of the outcomes we have observed, we conclude that host economy policymakers should, at aminimum, not raise barriers to FDI. In cases where there is potential for multinationals to source supplies from localsuppliers, policymakers should consider providing incentives to encourage FDI.
References
Aitken, Brian J., Harrison, Ann E., 1999. Do domestic firms benefit from direct foreign investment? Evidence from Venezuela. American EconomicReview 89 (3), 605–618.
Aw, Bee Yan, Chung, Sukkyun, Roberts, Mark J., 2000. Productivity and turnover in the export market: micro-level evidence from the Republic ofKorea and Taiwan (China). The World Bank Economic Review 14 (1), 65–90.
Bernard, AndrewB., Bradford Jensen, J., 1999. Exceptional exporter performance: cause, effect, or both? Journal of International Economics 47 (1), 1–25.Blalock, Garrick, 2002. Technology Adoption from Foreign Direct Investment and Exporting: Evidence from Indonesian Manufacturing,
PhD Thesis, University of California, Berkeley, Haas School of Business.Blalock, Garrick, Gertler, Paul J., 2004. Learning from exporting revisited in a less developed setting. Journal of Development Economics 75 (2),
397–416.Blomstrom, Magnus, Wolff, Edward N., 1994. Multinational corporations and productivity convergence in Mexico. In: Baumol, W.J., Nelson, R.R.,
Wolff, E.N. (Eds.), Convergence of Productivity: Cross-National Studies and Historical Evidence. Oxford University Press, New York.Clerides, Sofronis K., Lach, Saul, Tybout, James R., 1998. Is learning by exporting important? Micro-dynamic evidence from Colombia, Mexico, and
Morocco. Quarterly Journal of Economics 113 (3), 903–947.Delgado, Miguel A., Fariñas, Jose C., Ruano, Sonia, 2002. Firm productivity and export markets: a non-parametric approach. Journal of International
Economics 57, 397–422.Goeltom, Miranda S., 1995. Indonesia's Financial Liberalization: An Empirical Analysis of 1981–88 Panel Data. Iseas Current Economic Affairs
Series. ASEAN Economic Research Unit, Institute of Southeast Asian Studies, Singapore.Haddad, Mona, Harrison, Ann, 1993. Are there positive spillovers from direct foreign investment? Evidence from panel data for Morocco. Journal of
Development Economics 42 (1), 51–74.
421G. Blalock, P.J. Gertler / Journal of International Economics 74 (2008) 402–421
Haskel, Jonathan E., Pereira, Sonia C., Slaughter, Matthew J., 2002. Does Inward Foreign Direct Investment Boost the Productivity of DomesticFirms? Discussion Paper, vol. 8433. National Bureau of Economic Research, Cambridge, MA. August.
Hill, Hal, 1988. Foreign Investment and Industrialization in Indonesia. East Asian Social Science Monographs. Oxford University Press, Singapore.Hoxby, Caroline M., 2005. Competition Among Public Schools: A Reply to Rothstein (2004). Working Paper, vol. 11216. National Bureau of
Economic Research, Cambridge, MA. March.Javorcik, Beata Smarzynska, 2004. Does foreign direct investment increase the productivity of domestic firms? In search of spillovers through
backward linkages. American Economic Review 94 (3), 605–627.Javorcik, Beata Smarzynska, Spatareanu, Mariana, 2005. Disentangling FDI spillover effects: what do firm perceptions tell us. In: Moran, T.H.,
Graham, E.M., Blomstrom, M. (Eds.), Does Foreign Direct Investment Promote Development? Institute for International Economics and Centerfor Global Development, Washington, D.C., pp. 45–72.
Katayama, Haijime, Lu, Shihua, Tybout, James, 2003. Why plant-level productivity studies are often misleading, and an alternative approach tointerference. Working Paper, vol. 9617. National Bureau of Economic Research, Cambridge, MA.
Keller, Wolfgang, 2004. International technology diffusion. Journal of Economic Literature 42, 752–782.Kenney, Martin, Florida, Richard L., 1993. Beyond Mass Production: The Japanese System and Its Transfer to the U.S. Oxford University Press,
New York.Kokko, Ari, 1994. Technology, market characteristics, and spillovers. Journal of Development Economics 43 (2), 279–293.Lall, Sanjaya, 1980. Vertical inter-firm linkages in LDCS: an empirical study. Oxford Bulletin of Economics and Statistics 42, 203–226.Macduffie, John Paul, Helper, Susan, 1997. Creating lean suppliers: diffusing lean production through the supply chain. California Management
Review 39 (4), 118–151.Melitz, Marc, 2000. Estimating firm-level productivity in differentiated product industries. Working paper. Harvard University, Department of Economics.Moran, Theodore H., 2001. Parental Supervision: The New Paradigm for Foreign Direct Investment and Development. Institute for International
Economics, Washington, DC.Moran, Theodore H., Graham, Edward M., Blomstrom, Magnus (Eds.), 2005. Does Foreign Direct Investment Promote Development? Institute for
International Economics and Center for Global Development, Washington, D.C.Moulton, Brent R., 1990. An illustration of a pitfall in estimating the effects of aggregate variables on micro units. The Review of Economics and
Statistics 72 (2), 334–338.Nasution, Anwar, 1995. The opening-up of the Indonesian Economy. In: Kuntjoro-Jakti, D., Omura, K. (Eds.), Indonesian Economy in the Changing
World, vol. 32. Institute of Developing Economies, Tokyo.Olley, Steven G., Pakes, Ariel, 1996. The dynamics of productivity in the telecommunications equipment industry. Econometrica 64 (6), 1263–1297.Pack, Howard, Saggi, Kamal, 2001. Vertical technology transfer via international outsourcing. Journal of Development Economics 65 (2), 389–415.Pangestu, Mari, 1996. Economic Reform, Deregulation, and Privatization: The Indonesian Experience. Centre for Strategic and International Studies,
Jakarta.Pangestu, Mari, Sato, Yuri, 1997. Waves of Change in Indonesia's Manufacturing Industry. Institute of Developing Economies, Tokyo.Rodrik, Dani, 1999. The new global economy and developing countries: making openness work. Policy Essay 24, Overseas Development Council.
Johns Hopkins University Press, Washington, DC.Van Biesebroeck, Johannes, 2003. Exporting raises productivity in sub-Saharan African manufacturing. Working Paper, vol. 10020. National Bureau
of Economic Research, Cambridge, MA. October.Wie, Thee Kian, 1994. Intra-regional investment and technology transfer in Indonesia. In: Yanagi, K. (Ed.), Symposium on Intra-Regional Investment
and Technology Transfer. Asian Productivity Organization, Kuala Lumpur, pp. 137–166.World Bank, 1993. Foreign direct investment—benefits beyond insurance. Development Brief 14. Development Economics Vice-Presidency,