Welfare Health Housing E d u c a t i o n Fisca l Employment Services Socia l Networ k s Work Transport Environment Schools Stabilit y Support Finances C oh es ion Housing Temperamen t Aptitudes Biology Motivation Behaviour ESRC Research Network ESRC Research Network “Human Capability and Resilience” “Human Capability and Resilience” 2003 2006
Transcript
Welfare Health
HousingE
du
ca
tion
Fisc
al
Em
plo
ym
en
tServices
Social
Netw
orks
Wor
k
Transport Environment
Schools
Stability
Support FinancesC
oh
esio
n Housing
Temperament
Aptitudes Biology
Motivation Behaviour
ESRC Research NetworkESRC Research Network
“Human Capability and Resilience”“Human Capability and Resilience”
20032003 20062006
Health inequality: importance Health inequality: importance of the life courseof the life course
Moving from description to Moving from description to explanationexplanation
Importance of ‘rainbow model’Importance of ‘rainbow model’
Acknowledges that health inequality Acknowledges that health inequality occurs in a complex context—occurs in a complex context—
Causes may act proximally or distallyCauses may act proximally or distally
Need to add longitudinal perspectiveNeed to add longitudinal perspective
Rainbow encourages us to look for Rainbow encourages us to look for resilience factors as well as risk factorsresilience factors as well as risk factors
Look at responsibility of policiesLook at responsibility of policies
What are the causes of health inequality?
Need to understand causes in order to have effective policies
Also, health inequality offers aetiological clues, even if you are not interested in policy at all
Four major approaches to explaining health inequality
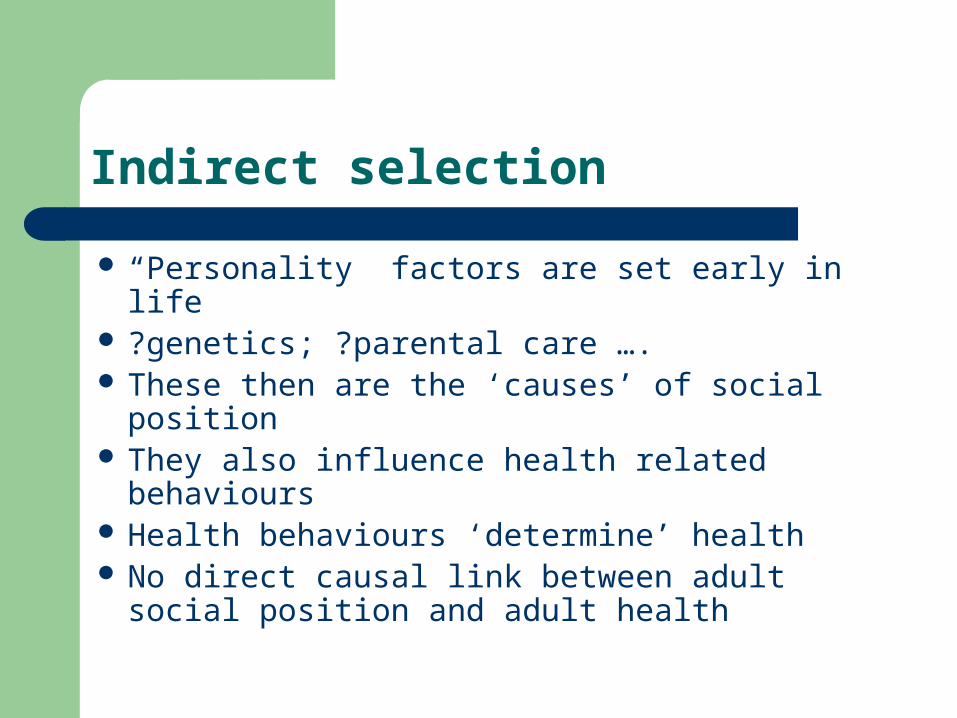
“Personality” factors are set early in life ?genetics; ?parental care …. These then are the ‘causes’ of social position They also influence health related
behaviours Health behaviours ‘determine’ health No direct causal link between adult social
position and adult health
Indirect selection or life course processes?
Merit of this approach is that it can only be tested in longitudinal research
Up to now, not many studies have done this Seems to be a complex mixture of ‘risk’ and
‘resilience’ over time
Cognitive function at 8 years and mortality Cognitive function at 8 years and mortality up to age 54: men born in 1946up to age 54: men born in 1946
Permission granted from International Journal of Epidemiology, Vol 33(2), Kuh et al, Childhood cognitive ability and deaths up until middle age, pp 408-13, Copyright 2005
with permission from Oxford University Press
Developmental contextual model of the development of inequality in psychological health from birth to
age 33 in men and women born 1958
Permission granted from Social Science and Medicine, Vol 57, 2003, Schoon et al , Socio-economic adversity and psychosocial adjustment: a developmental-contextual perspective
p1001-1015, Copyright 2005 with permission from Elsevier
Material explanations
Industrial hazards Dietary inadequacy Accidents at home, work and on road Area pollution Housing inadequate for climatic conditions
Morris et al. Costs of a healthy life
Healthy food = £14.05 p.w. Heating = £5.41 p.w. Clothes and shoes £10.00 p.w. Lodging = £46.80 Social participation = £38.00 Total is about the same as UK Minimum
Wage but far more than benefit levelSource: Morris et al JECH 2000
Cost of a healthy life
Biological necessities (food, clothing, heat) only make up the minority
Major costs are social participation and lodging
These 2 are determined by wider social forces
No such thing as a ‘pure material’ explanation
Amartya Sen’s “capability” explanations
Affordability of biological necessities depends on the costs of social participation
“Relative deprivation in the space of incomes can yield absolute deprivation in the space of capabilities. In a country that is generally rich, more income may be needed to buy enough commodities to achieve the same social functioning, such as ‘appearing in public without shame’. The same applies to the capability of ‘taking part in the life of the community’”
Material and psychosocial hazards accumulate in the life course
“Social reproduction” Less advantaged family background is linked
to worse educational results Education is strongly linked to social class in
adulthood Social class influences risks e.g. poor
housing, low income, unemployment, job insecurity, low work autonomy
Unemployment 12+ months 1981-1991 by Unemployment 12+ months 1981-1991 by father’s social class at birth father’s social class at birth
0
1
2
3
4
5
6
Unadjusted Adjusted
I-IIIIINIIIMIVV
Od
ds
rat
io f
or
12+
m
on
ths’
un
emp
loym
en
t
Od
ds
rat
io f
or
12+
m
on
ths’
un
emp
loym
en
t
Adj. crowding, education, region,height at 7, BSAG, parents’ heights
Adj. crowding, education, region,height at 7, BSAG, parents’ heights
Father’s social class
Father’s social class
Journal of Epidemiology & Community Health, 1996, 50: 415 -422, reproduced with permission from BMJ Publishing Group
Economic status 1971 and 1981 by semi- or unskilled Economic status 1971 and 1981 by semi- or unskilled manual class membership in 1991manual class membership in 1991
Men 35-60: % in classes RG IV/V in 1991
0
10
20
30
40
50
Emp 71& 81 Emp 71, Unemp81
Unemp 71, Emp81
Unemp 71 & 81
Employed 1991
Unemployed 1991
Sick/inactive 1991
Permission granted from International Journal of Epidemiology, 31(2), Mel Bartley and Ian Plewis, Accumulated labour market disadvantage and limiting long term illness, pp 336-341, Copyright 2005 with permission from Oxford University Press.
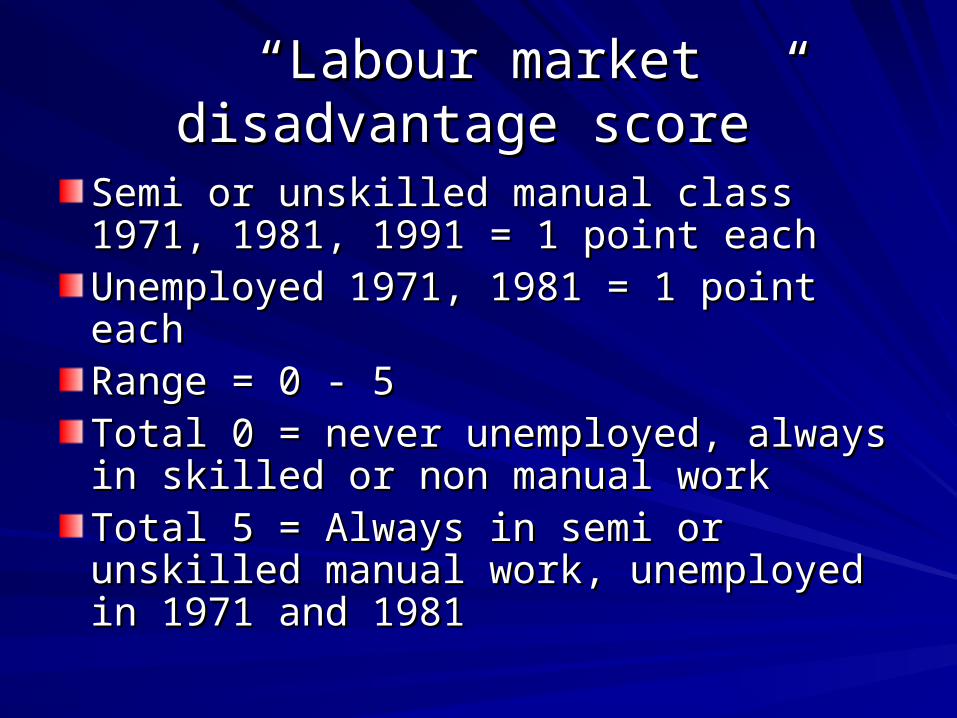
““Labour market disadvantage Labour market disadvantage score”score”
Semi or unskilled manual class 1971, Semi or unskilled manual class 1971, 1981, 1991 = 1 point each1981, 1991 = 1 point eachUnemployed 1971, 1981 = 1 point eachUnemployed 1971, 1981 = 1 point eachRange = 0 - 5Range = 0 - 5Total 0 = never unemployed, always in Total 0 = never unemployed, always in skilled or non manual workskilled or non manual workTotal 5 = Always in semi or unskilled Total 5 = Always in semi or unskilled manual work, unemployed in 1971 and manual work, unemployed in 1971 and 19811981
Odds of limiting long standing illness in 1991 by accumulated labour Odds of limiting long standing illness in 1991 by accumulated labour market disadvantage 1971-1991market disadvantage 1971-1991
Men aged 36-60 in 1991Men aged 36-60 in 1991
0
1
2
3
4
Od
ds
of L
LT
I 012345
Permission granted from International Journal of Epidemiology, 31(2), Mel Bartley and Ian Plewis, Accumulated labour market disadvantage and limiting long term illness, pp 336-341, Copyright 2005 with permission from Oxford University Press.
Life-course explanations for health inequality
Health inequality is the result of processes that operate over time in the life of the individual
Consistent with the observation that inequality takes the form of a ‘gradient’
More recently developed approaches
“Neo-material”
“Life-course political economy”: social environments as sources of capability and resilience
“Neo-material explanation”
Originates in the debate on income distribution and overall population health
Why might income inequality damage health and well-being?
“Income inequality” may influence aspects of social relationships: relative importance of domination versus mutual support
It might be acting as an indicator of other social institutions such as welfare, education, housing, transport.
The ‘psychosocial interpretation’: Social relationships vary with income inequality
Social trust Social distance Mutual support Aggression and violence
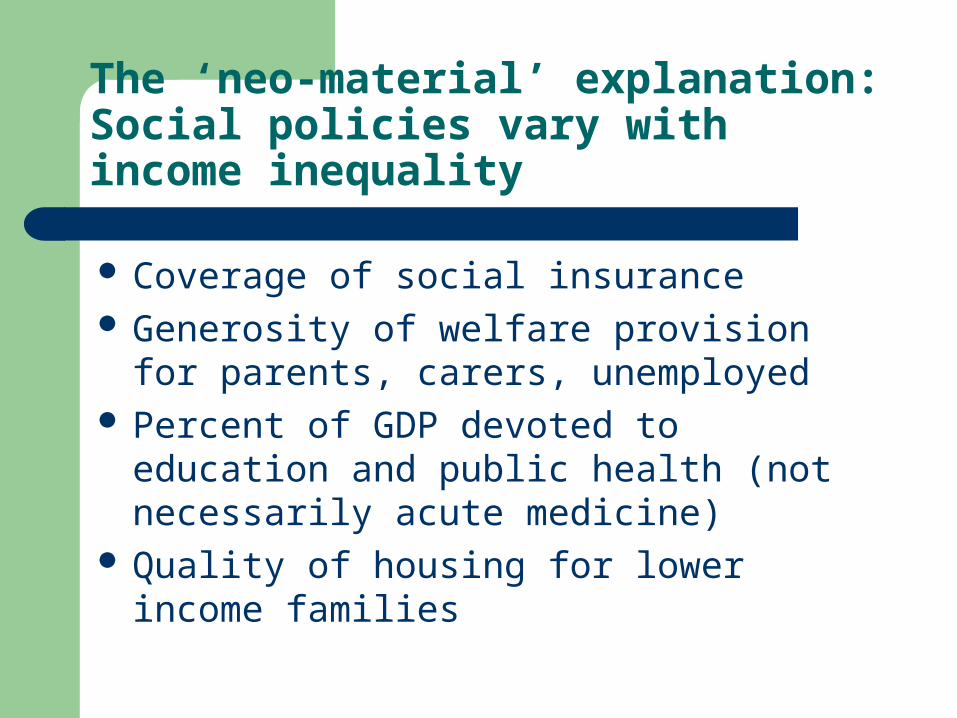
The ‘neo-material’ explanation: Social policies vary with income inequality
Coverage of social insurance Generosity of welfare provision for parents,
carers, unemployed Percent of GDP devoted to education and
public health (not necessarily acute medicine)
Quality of housing for lower income families
The ‘capability’ interpretation
Social environment influences individual development & resilience through quality of relationships over time
Social and economic policies influence adequacy of individual resources for health and quality of life = ‘capability’
Need for a ‘life course political economy’ of health inequality?
1. The causes of major trends in population health are still poorly understood
2. Economic environment relates to health in the context of the life course;
3. Effects of social policies differ between stages of the life course (childhood, youth, maturity, older age).