31
WELFARE REFORM IN THE UK: 1997 - 2007 Mike Brewer THE INSTITUTE FOR FISCAL STUDIES WP20/07

WELFARE REFORM IN THE UK: 1997 - 2007
Mike Brewer
THE INSTITUTE FOR FISCAL STUDIESWP20/07

Welfare Reform in the UK: 1997 - 2007
Mike Brewer*
Institute for Fiscal Studies, London, UK
17 May 2007
Abstract
This paper presents a tour of welfare reform in the UK since the last change of government, summarising the most important changes in active labour market policies, and in measures intended to strengthen financial incentives to work. It argues that developments in the UK’s active labour market policies occurred in two broad phases: first, the Government sought to strengthen ALMPs for those individuals deemed to be unemployed, through the New Deal programme. Second, the Government has reformed benefits for individuals traditionally viewed as inactive and thus excused job search activity, such as lone parents, and the sick and disabled. Accompanying these have been changes to direct taxes, tax credits and welfare benefits aiming to strengthen financial work incentives. However, financial work incentives have been strengthened by less than might be expected given the early rhetoric: the expansion in family-based tax credits have weakened the financial work incentives of (potential) second earners in families with children, many more workers now face combined marginal tax and tax credit withdrawal rates in excess of 60% than a decade ago, and a desire to achieve broad reductions in relative child poverty has led the Government to increase substantially income available to non-working families with children. We also summarise evaluations of three important UK welfare-to-work reforms (WFTC, NDYP and Pathways to Work), but without comparing their efficacy.
* Mike Brewer, Programme Director, Direct Tax and Welfare sector, Institute for Fiscal Studies, contact [email protected]. This paper was written at the request of the Economic Council of Sweden. Support from the ESRC Centre for the Microeconomic Analysis of Public Policy at the Institute for Fiscal Studies is gratefully acknowledged. The author is very grateful to Richard Blundell for comments and discussions on these issues, and to colleagues at the IFS whose joint work is referred to in this paper. The Labour Force Survey (LFS) and the Family Resources Survey (FRS) are Crown Copyright material, and are reproduced with the permission of the Controller of HMSO and the Queen’s Printer for Scotland. The LFS is available from the UK Data Archive, and the FRS was made available by the Department for Work and Pensions, neither of which bears any responsibility for analysis or interpretation in this paper.
1

1. Introduction
This paper gives a necessarily partial and brief overview of reforms to welfare to work policies (sometimes shortened to “welfare reforms”) in the UK since 1997, the year that the New Labour party formed the government. The aim has been to describe some of the key policies, discuss the impact of policies on a (small) number of employment-related indicators, but also summarise some of the more thorough econometric evaluations of particular welfare reforms (although with no attempt to compare the policies discussed).
Chapter 2 gives some details of the main measures: reforms to what can be thought of as active labour market policies, and then reforms to taxes and benefits aimed at strengthening financial work incentives. Chapter 3 shows what happened to financial work incentives and some employment and poverty outcomes that could be thought of as success measures for welfare reforms. Chapter 4 summarises the results of econometric evaluations of Working Families’ Tax Credit, the New Deal for Young People, and the new Pathways to Work pilot (for recipients of incapacity benefit), arguably the three most important changes since 1997. Section 5 concludes.
2. Main welfare to work reforms – description
In this section, we give an overview of the various aspects of welfare to work policies, or other policies expected to have a significant impact on groups on welfare.1
2.1 Active Labour Market Policies
The centrepiece of the Labour Government’s welfare to work reforms in its first few years was the New Deal. In the general policy parlance, the New Deal represents a strengthening of the ALMP applicable to recipients of out-of-work benefits. There are a number of New Deals aimed at different groups on welfare, each with differing eligibility requirements and varying degrees of compulsion. For example, the New Deal for Young People is compulsory for all those under 25 who have been unemployed for 6 months; the New Deals for Lone Parents (NDLP), by contrast, are voluntary programmes that offer only advice and support, with no threat of financial sanctions. NDYP, therefore, places significant restrictions on the behaviour of young long- term unemployed as well as offering extra support; NDLP, though, represents only additional support. As we discuss later, this reflects that lone parents are excused from having to claim a benefit for the unemployed until their children are all aged 16 or more.
1 An early exposition of the current Government’s priorities for welfare reform can be found in HM Treasury (1997); a more recent one is DWP (2006). Reassuringly, the two have much in common.
2

New Deal for Young People (18 to 24) The New Deal for Young People (NDYP) was introduced across the UK in April 1998; before this time, there was no specific programme for young unemployed people, only for the long-term unemployed. Participation in NDYP is compulsory for all young people aged between 18 and 24 who have been claiming Jobseeker’s Allowance (JSA) for at least six months, and involves up to four months of extensive assistance with job search from a personal advisor. If participants have not found employment by the end of this ‘gateway’ period, then they are offered up to four options, all of which seek to improve their employability (these are: subsidised job placement with training. education, voluntary or environmental work). By the end of 2004, there have been almost 1.2 million completed spells on NDYP. 38 per cent of participants left for sustained2 unsubsidised jobs, 11 per cent transferred to other benefits, 20 per cent have left for other known reasons, while the remaining 31 per cent for unknown reasons.
New Deal for 25 plus The national New Deal 25 Plus programme (ND25+) was originally launched in June 1998 and reformed in April 2001. The programme focuses upon the long-term unemployed with mandatory participation for all individuals who have been claiming JSA for 18 of the last 21 months. The programme now shares common features with the NDYP, beginning with an initial ‘gateway’ period lasting for up to four months, followed by an ‘Intensive Activity Period’ (IAP) typically lasting for no more than 26 weeks. The IAP includes flexible packages of support which can combine work experience/placements, work focused training and help with motivation and soft skills.
New Deal for Lone Parents, New Deal for Disabled People, New Deal for 50 plus and New Deal for Partners These are all voluntary programmes open to different groups of the inactive or unemployed (New Deal for Partners is aimed at non-working partners of benefit recipients). Participants in the programme are assigned a personal advisor, who generally assists with a range of job search activities.
Jobcentre Plus A key operational change introduced by the government was the merger of the two agencies individually responsible for employment services and administration of social security benefits into one body known as Jobcentre Plus (administration of social security benefits for those aged 60 and over has been given to another agency). As well as reducing government’s administrative costs and claimants’ compliance costs, the aim was to allow the Government to place greater emphasis on getting benefit claimants back to work, even for those receiving a benefit for the inactive (who therefore face no
2 A sustained job is defined as one lasting for more than 13 weeks.
3
requirement to look for work), such as lone parents and those with ill-health or disabilities.
Pathways to Work In line with the trend for later reforms to focus on those recipients of benefits supposedly designed for the inactive, since October 2003 the Government has been piloting reforms which both provide greater support (financial and non-financial) and impose greater obligations to encourage claimants of incapacity benefits to move into paid work. These are known as the ‘Pathways to Work’ reforms. The Government has already committed to extending the reforms across the UK by 2008, and set a long-term target to reduce the number of individuals claiming incapacity benefits by 1 million within ten years (DWP, 2006).
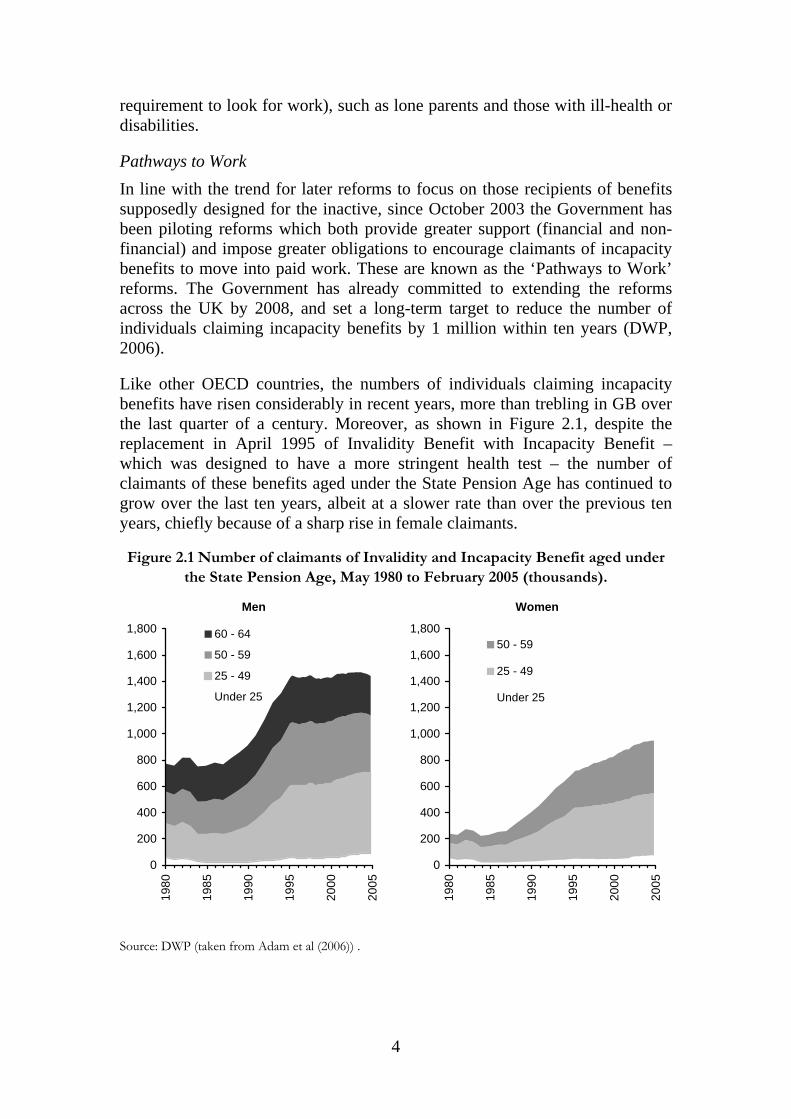
Like other OECD countries, the numbers of individuals claiming incapacity benefits have risen considerably in recent years, more than trebling in GB over the last quarter of a century. Moreover, as shown in Figure 2.1, despite the replacement in April 1995 of Invalidity Benefit with Incapacity Benefit – which was designed to have a more stringent health test – the number of claimants of these benefits aged under the State Pension Age has continued to grow over the last ten years, albeit at a slower rate than over the previous ten years, chiefly because of a sharp rise in female claimants.
Figure 2.1 Number of claimants of Invalidity and Incapacity Benefit aged under the State Pension Age, May 1980 to February 2005 (thousands).
Men
0
200
400
600
800
1,000
1,200
1,400
1,600
1,800
1980
1985
1990
1995
2000
2005
60 - 64
50 - 59
25 - 49
Under 25
Women
0
200
400
600
800
1,000
1,200
1,400
1,600
1,800
1980
1985
1990
1995
2000
2005
50 - 59
25 - 49
Under 25
Source: DWP (taken from Adam et al (2006)) .
4

Many individuals receiving Incapacity Benefit do so for a long time. As stated in the recent DWP five year strategy, on average those claiming the benefit for more than twelve months end up claiming for eight years (DWP, 2005). The reforms being piloted are motivated by concerns that the current arrangements do not do enough (indeed, do nothing at all) to encourage claimants back into paid work or help them manage their health condition (a detailed discussion can be found in the Green Paper which proposed the pilots: DWP, 2002).
The Pathways to Work package of reforms for new claimants of incapacity benefits includes three aspects: mandatory monthly work-focused interviews during the first six months (those with particularly serious medical conditions are exempted) a set of health-related and labour market programmes, and increased financial support and incentives, with a new Return to Work Credit paying £40 a week for the first year of paid employment after leaving incapacity benefits if gross annual earnings are below £15,000.
Lone Parents The treatment of lone parents within the welfare system deserves particular attention for a number of reasons. First, the UK has internationally high proportions of families with children headed by a lone parent (currently 25%, with longitudinal data suggesting that one third of mothers will spend some time as a lone mother before all her children are aged 18). Second, lone parents tend to have relatively poor skills, and those in work tend to work part-time for relatively low wages, and so whether working or not, they make up a significant proportion of the group likely to be affected by welfare reforms. Third, the UK has very generous (by international standards) rules for lone parents who claim welfare benefits: lone parents in the UK are excused from all job-search requirements until their youngest child reaches 16. Partly as a consequence of the latter two points, fewer than half of lone parents were in work in 1997, and relative poverty rates for children in lone parent families were much higher than children in couple families.3
Many of the changes to tax credits, minimum wage, and childcare policies (described in section 2.2) have been of particular help to lone parents. But it is only very recently that the Government has proposed increasing the requirements asked of lone parents on welfare, with a proposal that lone parents should have to engage in job-search as a condition of receiving benefit when their youngest child reaches 12. Previous reforms had the stated aim of making the NDLP more effective and more accessible, requiring lone parents to meet at least annually with a personal adviser (case worker), and had introduced a time-limited in-work bonus.4
3 See Brewer et al (2007b).
4 This is much like the Return to Work bonus: it pays £40 a week, for up to 12 months duration, to lone parents who have been on welfare for at least a year and then leave welfare
5

2.2 Changes to financial incentives to work
This section describes the main ways in which the current UK Government has sought to strengthen financial work incentives for those with low earning power, discussing the minimum wage, personal tax changes and then changes to in-work benefits and tax credits.
Minimum wage In April 1999, a national minimum wage (NMW) was introduced in the UK at a rate of £3.00 per hour for those aged 18-21 (the development rate) and at the higher rate of £3.60 per hour for those aged 22 and over (Table 2.1). In Spring 1998, before the NMW was introduced, the Office for National Statistics estimated that 1.3 million individuals were paid wages below these introductory rates.5 By the following year, the number of individuals who were estimated to be paid below these rates had fallen to a little under half a million, and since then the number of individuals paid below the operating national minimum wage rates has been relatively stable, fluctuating slightly between about 230,000 and 340,000.6 The value of the minimum wage relative to the economy-wide average hourly wage rate has been increasing: in 1999, the main rate was equivalent to 36.8% (47.0%) of the mean (median) wage in that year, but by 2004 it was worth 39.8% (51.9%) of the respective mean (median) wage.
Table 2.1. The UK’s minimum wage
Rates effective from Main rate Development rate
Median wage
Mean wage
April 1999 £3.60 £3.00 £7.66 £9.79 October 2000 £3.70 £3.20 £7.93 £10.22 October 2001 £4.10 £3.50 £8.28 £10.78 October 2002 £4.20 £3.60 £8.62 £11.35 October 2003 £4.50 £3.80 £8.95 £11.73 October 2004 £4.85 £4.10 £9.35 £12.18 October 2005 £5.05 £4.25 £9.56 £12.50 October 2006 £5.35 £4.45 £9.95 £13.00 October 2007 £5.52 £4.60
Notes: Main rate paid to workers aged 22 years and older. Development rate paid to workers aged 18 - 21 years inclusive and workers aged 22 years and above who starting a new job with a new employer and doing accredited training. From October 2004 a new rate of £3.00 per hour was introduced. This applies to all 16 year olds who are no longer of compulsory school age, and 17 year olds. Mean and median wages are for all adult employees. Source: Low Pay Commission website (http://www.lowpay.gov.uk/). Mean and Median wages: derived from ASHE and taken from http://www.statistics.gov.uk/StatBase/Product.asp?vlnk=13101.
to get a job. Early evaluation results, though, show very small impacts on labour market outcomes: Brewer et al (2007a).
5 Office for National Statistics (2004a).
6 Individuals can be paid less than the minimum wage either through genuine non-compliance, or through errors in the household surveys on which these estimates are based.
6
In general, a binding minimum wage should increase the gap between in-work and out-of-work incomes for low-skilled groups, and so induce an increase in labour supply. It may also, however, reduce the demand for labour if low skilled workers become uneconomic to employ. Dickens and Manning (2002) find that virtually all of the impact of the NMW on the distribution of wages occurred within the first two months of its introduction, and the impact on employment seems to have been small (see, for example, Machin and Wilson (2004) or Stewart (2004)). The impact on welfare to work policies may, then, be limited, but the Government now sees the minimum wage as an essential backstop to low wages, particularly to help prevent the incidence of in-work support (see section 3.2) being entirely on employers.
Personal tax changes In the current Government’s first parliamentary term, a series of changes were made to income tax and social insurance contributions (called National Insurance in the UK) which particularly affected low-paid workers, and which were (correctly) described by the Government as improving financial gains to working for the low-wage. Compared with the changes to financial work incentives arising from the Working Families’ Tax Credit, the impact of these changes was much smaller on any individual’s financial incentives, but affecting many more workers. To save space, they are not described further here. 7
In-work benefit reform Since 1997, there have been two sets of changes to in-work benefits (or tax credits). The first of these (in October 1999; the replacement of a programme called family credit (FC) with one called Working Families’ Tax Credit) was motivated by concerns to improve the incentives for (some) low-earning parents to be in work. The rationale for the second set of reforms (in April 2003, which introduced the child and working tax credits) is less clear, though, and most domestic attention since 2003 has been devoted to operational issues of implementing a tax credit assessed on combined family income given the constraints of an income tax system that is individually assessed.
Phase 1: the Working Families Tax Credit In October 1999, a programme called family credit was replaced by Working Families’ Tax Credit (WFTC). In the jargon, WFTC was a ‘refundable’ tax credit, ie payable even if it exceeded the family’s income tax liability. To be
7 See HM Treasury (1998) for the report recommending some of these change, and Myck (2000) and Gregg et al (1999) for analysis. One of these changes, however – a lower rate of income tax (10%) on the first £2,000 of income – has since been removed in favour of a lower basic rate of tax (which was 23% in 1997, and is due to be 20% by 2008): this was announced in the 2007 Budget (HMT (2007)).
7

entitled, at least one adult in a family with children must work at least 16 hours a week. So-called “hours rules” are a pervasive feature in the UK welfare benefit system, and have since spread into in-work tax credits.8
There is a basic credit for each family plus additions for each child, and this is withdrawn once earnings exceed a disregard. The phase-out or withdrawal rate in WFTC was 55%, but this applies to earnings after income tax and social insurance have been deducted, so the usual overall marginal deduction rate for someone receiving WFTC was 69%. 9
In operational terms, there was little difference between WFTC and its predecessor, family credit (FC): for example, WFTC was still subject to strict capital rules, like all welfare benefits in the UK. The one high-profile operational difference, though, was that WFTC was administered by the tax authority (not the agency responsible for social security benefits), and, except where couples with children requested it to be paid to a non-working adult, was paid to individuals through employers.
However, the more important difference with FC was that WFTC was substantially more generous, with a higher earnings disregard, a lower withdrawal rate, more generous entitlements, and a subsidy for childcare expenditures.10 Overall, these changes substantially increased in-work incomes for eligible families, and the number of eligible families, and the WFTC was approximately twice as expensive as its immediate predecessor: Figure 2.2 shows that expenditure on employment tax credits almost doubled between 1998–99 and 2000–01, going from £2.68 billion to £4.81 billion in constant 2002 prices. There was a further substantial increase by 2002, to £6.46 billion.
Figure 2.2. Expenditure on in-work programmes in Great Britain, 1991/2 – 2002/3
8 Theoretically, they allow for a closer targeting on low wages, rather than low earners, but this must be traded off against the increased complexity of design and administration and the need for monitoring/compliance checks.
9 In 2000/1, for example, income tax was 22% and employee payroll tax was 10%. Of the 68% of any increase in earnings retained by the employee after these taxes, 55% was lost in foregone WFTC, so the combined withdrawal rate was 0.32 + 0.55 * (1 – 0.32) = 69%. Families also in receipt of means-tested benefits that help with rents or local taxes (known, respectively, as housing benefit and council tax benefit, would, though, face higher rates than these).
10 The UK has a mixed-economy provision of childcare; many low-income families with children would be paying for work-related childcare from self-employed (but regulated) childminders, private or not-for-profit day nurseries, or after-school clubs.
8

0
1,000
2,000
3,000
4,000
5,000
6,000
7,000
1991-92
1992-93
1993-94
1994-95
1995-96
1996-97
1997-98
1998-99
1999-2000
2000-01
2001-02
2002-03
Exp
endi
ture
(£m
, 200
2 pr
ices
)WFTC DPTC
FC DWA
DPTC – disabled person’s tax credit. DWA – disability working allowance. Note: WFTC replaced FC in October 1999, so there was expenditure on both of them during the 1999–2000 tax year. Source: Author’s calculations.
While reducing the marginal withdrawal rate of those who would have been eligible for Family Credit, this change also increased the numbers of workers who faced a tax credit withdrawal as their earnings rose on top of income tax and social insurance, and so the number of workers facing marginal withdrawal rates in excess of 60% (the top income tax rate in the UK is 40%) has risen accordingly (from 0.8m to 1.7m: this is discussed further in Section 5.1. As we shall see later, the fact that WFTC is assessed on the joint income of a couple means that, as more families with children became entitled to it, so did incentives to work for many potential second (and mostly female) workers weaken.
Phase 2: the child and working tax credits Tax credits were further reformed in 2003 with the introduction of child tax credit (CTC) and working tax credit (WTC), in what was the biggest change in support for children since the introduction of child benefit in 1977. The CTC merged together several parts of the tax and benefit system that supported families with children, while WTC extended in-work support to adults without children (for the first time). CTC and WTC, like WFTC, are refundable tax credits.
This reform was not primarily motivated by strengthening work incentives: in fact, there were minimal changes to budget constraints in April 2003. Instead, the reforms entirely overhauled the administration of tax credits, bringing them closer to the income tax system in terms of concepts and definitions (so tax credits now depend upon annual income as defined for income tax purposes)
9

but keeping their administration and payment mechanisms separate from income tax.11
The current set of tax credits probably illustrate the Government’s frustration with both the income tax and the welfare system as ways of targeting financial support: the income tax system does not allow sufficiently accurate targeting, and traditional means-tested benefits are seen as unacceptably complicated and stigmatising, and inappropriate for a programme that covers the vast majority of families with children. But tax credits have experienced considerable and widely-reported administrative difficulties ever since computer problems caused substantial delays to payments to many families in the first few months of 2003–04. Because of this, much policy attention since 2003 has been on improving their operation, rather than the inherent work incentives. In fact, as we argue later, the current pattern of changes to entitlements to tax credits is weakening, rather than strengthening, work incentives.
A more significant change economically in 2003 was that, for the first time in the UK, additional support was offered to families without children who were in work but on a low income, through the WTC. This is less generous than it is for families with children: those without children have to be aged 25 or over, to work full-time, and to be on very low wages. Around 320,000 families without children receive the working tax credit, but take-up (programme participation) is extremely low, at under 1 in 5.12 Given this take-up rate is so much lower than amongst families with children, the most plausible explanation is that tax credits for working adults without children are still novel, and information and awareness about them still low.
Welfare benefit changes This Government’s changes to taxes and benefits affecting families with children have by no means all been to encourage work: a concern to reduce child poverty in broad terms has led the Government to increase substantially the additional amounts payable for children in welfare benefits (before 2003) and amounts payable in the non-work-contingent child tax credit (after 2003). Both these directly weaken incentives to work, as we discuss below.
Work-related Childcare Work-related childcare in the UK is provided by public and private suppliers, but the extent of Government intervention into this mixed market has increased dramatically since 1997, with the aims of expanding labour supply choices, improving work–life balance for parents but also advancing the long-term social and educational outcomes of children.
11 See Brewer (2003) for amplification of these points.
12 HMRC (2007).
10
The main policy for achieving the first of these has been to make substantially more generous parental subsidies for spending on formal childcare (ie nurseries, after-school clubs, childminders, but not for informal payments to friends and families) that are directly paid to parents in work, with the current incarnation of this programme known as the childcare tax credit. 13 In real terms, spending on the childcare tax credit in December 2004 was more than 16 times greater than spending on its equivalent in November 1998. Although this large increase in subsidy presumably encourages parents to use formal childcare rather than informal childcare, the impact on maternal labour supply is less clear. There has been no direct evaluation, and a review of US studies suggests that the elasticity of maternal labour supply to the price of childcare is very low14
There have also been changes to the provision of early education, and considerable supply-side interventions to increase the amount of childcare places provided by the non-government sector: these are discussed more in Brewer et al (2005).
2.3 Conclusions
The intention of this section is to give an overview of the key welfare to work changes since 1997. In the area of ALMPs, the UK Government first expanded the role of ALMPs for those people on benefits traditionally considered to be unemployed through the New Deal; more recent reforms – which are still incomplete – are aiming to get back to work welfare recipients traditionally considered to be inactive, and therefore excused from job search requirements (the sick and disabled, and lone parents). These changes have been complemented with general direct tax reforms to strengthen incentives to work for all low earners, and targeted in-work tax credit programmes, mostly for families with children.
3. Outcomes
This section is designed to review some high-level outcomes, which might be thought of as “success measures”.
Although not strictly an outcome, we first review how tax and benefit changes have altered financial work incentives, particularly for families with children, given that so much of the UK Government’s changes have been to tax credits for families with children. We then review broad changes in employment-related outcomes, and then examine trends in relative poverty.
13 See Brewer et al (2005) for further details of the topics presented below.
14 See Brewer and Paull (2004) and studies cited there.
11

3.1 Financial work incentives
Given that considerable attention has been focused with the UK Government on strengthening financial work incentives, it is appropriate to consider both how they vary across different family types, but also how they have changed in recent years.
Tables 3.1 and 3.2 focus more directly on the impact of tax and benefit changes since 1997/8 on financial work incentives: Table 3.1 shows the replacement rates of working parents, summarising some of the features of the changing distributions, and Table 3.2 shows how the distribution of marginal effective tax rates has changed.15 Both sets of statistics have been calculated by holding constant the characteristics of the population, and considering the real impact of tax and benefit changes on these work incentive measures.
Table 3.1 The impact of tax and benefit changes from 1997 – 2004 on the replacement rates of working parents
Replacement rates (%) April 1997
April 2004
Change (ppt)
Lone parents Mean 67.9 65.0 -2.9
Median 71.9 65.9 -6.0 25th centile 55.8 52.3 -3.5 75th centile 81.9 80.4 -1.5
Proportion whose rate rises 21.3% Proportion whose rate falls 56.7%
Individuals in couples with children whose partner does not work
Mean 59.3 61.1 +1.8 Median 62.6 65.5 +2.9
25th centile 41.3 45.3 +4.0 75th centile 80.6 79.5 -1.1
Proportion whose rate rises 52.7% Proportion whose rate falls 26.6%
Individuals in couples with children whose partner does work
Mean 59.2 62.5 +3.3 Median 58.5 62.7 +4.2
25th centile 45.6 50.4 +4.8 75th centile 74.3 76.0 +1.7
Proportion whose rate rises 53.8% Proportion whose rate falls 6.6%
15 The replacement rate is defined as net income if out of work divided by net income in work. The marginal effective tax rate measures what fraction of a small rise in earnings is lost in income tax, employees’ social insurance contributions and foregone benefit and tax credit payments (it ignores employers’ social insurance contributions).
12

Source: authors’ calculations from FRS 2002/03 and TAXBEN and taken from Brewer and Shephard (2004). Notes: Excludes parents aged over 55 and self-employed. The row marked “25th centile” reports the replacement rate which is higher than 25% of all replacement rates faced by that family type. The row marked “75th centile” reports the replacement rate which is higher than 75% of all replacement rates faced by that family type.
Table 3.2 The impact of tax and benefit changes from 1997 – 2004 effective marginal rate faced by working parents
Effective marginal tax rates (%) April 1997
April 2004
Change (ppt)
Lone parents Mean 58.0 58.3 +0.3
Median 72.5 69.0 -3.5 Proportion whose rate rises 31.2% Proportion whose rate falls 46.9%
Individuals in couples with children whose partner does not work
Mean 43.0 48.2 +5.2 Median 35.7 42.1 +4.4
Proportion whose rate rises 45.4% Proportion whose rate falls 21.0%
Individuals in couples with children whose partner does work
Mean 32.5 36.8 +6.1 Median 33.0 34.9 +1.9
Proportion whose rate rises 39.4% Proportion whose rate falls 10.0%
Source: authors’ calculations from FRS 2002/03 and TAXBEN and taken from Brewer and Shephard (2004) Notes: Excludes parents aged over 55 and self-employed. The row marked “25th centile” reports the marginal tax rate which is higher than 25% of all marginal tax rate faced by that family type. The row marked “75th centile” reports the marginal tax rate which is higher than 75% of all marginal tax rates faced by that family type.
The changes to the tax and benefit system between April 1997 and April 2004 imply that:
• The majority of lone parents now face a stronger reward to work than in 1997.
• The UK Government’s tax and benefit reforms have hardly changed the mean effective marginal tax rate faced by working lone parents, while the median effective marginal tax rate has fallen. More lone parents have experienced a strengthening of their incentive to progress than have experienced a worsening.
• Low-earning lone parents face stronger financial incentives to progress in the labour market, whilst medium- and high-earning lone parents face
13
smaller financial incentives to progress (not shown in tables – see Brewer and Shephard, 2004).
• A small number of couples with children face an increased financial reward for having one adult in work, but many more face a smaller financial reward. The same set of reforms since 1997 has weakened the financial reward to having a second earner. Together with the first effect, this means that a couple with children now faces a relatively stronger incentive, on average, to be a single earner couple, rather than to have two earners or none, than in 1997.
• The financial incentives to progress for the majority of workers in couples with children have worsened, with the mean effective marginal tax rate faced by individuals in couples with children 5 percentage points higher, thanks to the Government’s tax and benefit reforms. The increases in the median effective marginal tax rate have not been as large, however.
3.2 Indicators of employment and worklessness
Since 1997 the employment rate of women has increased from 67.2% to 70.2% (in 2006) with the majority of this increase concentrated between 1997 and 2001 (see Figure 3.1). Over the same period, the employment rate of men rose from 77.7% to 78.8%. Taken together, these increases imply an increase in the overall employment rate from 72.9% to 74.6%. This rise in the employment rates did not begin with the current Labour government, however: the employment rate has been rising since the recession of the early 1990s. The employment rate of men is still lower than it was in the 1970s, but that of women is substantially higher, and it is this increase that has helped raise the employment rate to its highest level since the 1970s. However, it is notable that the rise in employment has not been experienced amongst the low skilled (defined in this case as the 15% of the working-age population with the least qualifications, usually none), for whom employment has fallen almost continuously since 1992: other groups usually thought of as being disadvantaged in the labour market (older working age individuals , lone parents, those with disabilities, ethnic minorities), by contrast, have seen their employment rates converge with the economy-wide average since 1997.16
16 This discussion is based on the DWP’s Opportunity for All indicator 19, http://www.dwp.gov.uk/ofa/indicators/indicator-19.asp .
14

Figure 3.1 Employment rates in Britain, 1979-2006
0
10
20
30
40
50
60
70
80
90
1979
1984
1989
1994
1999
2004
Year
Em
ploy
men
t rat
es (%
)
-3%
-2%
-1%
0%
1%
2%
3%
4%
5%
6%
Rea
l GD
P gr
owth
All
Male
Female
Low skilled
GDP growth(right axis)Thatcher Major Blair
Notes: Seasonally adjusted. The employment rate is calculated as the proportion of the population of working age (16-59 for women and 16-64 for men) who are in employment (working at least one hour in the reference week or temporarily away from a job). Low skilled defined as the 15% of the working-age population with the lowest qualifications (most of whom have no qualifications). Source: Department for Work and Pensions (Opportunity for All Indicator 18) based on original data from Office for National Statistics.
There has been a clear shift in the focus of the Government’s welfare to work policies since 1997 from the unemployed to the inactive. This broadly reflects the Government’s perceived success in reforming active labour market policies for the unemployed. Figures 3.2 and 3.3 therefore show unemployment and inactivity rates.
Unemployment (ILO) is very low by historical standards, and the Government claims that its range of New Deals has been instrumental in achieving this. Inactivity rates, though, are broadly unchanged since 1997, with falling inactivity amongst women (mainly mothers) being offset by rising inactivity amongst men (mainly those in poor health). For men, the most common reason for inactivity is long-term sickness, followed by being in education, and those who retired before reaching the state pension age. 17 Since 1997, the slight rise in the inactivity rate amongst men is explained by increases in the number of students, those retiring early, and other factors. For women, the single most important reason for inactivity is if they are looking after family or their home (in 1997 this was cited as the reason by half of all inactive women). While the number of women who are economically inactive either through long-term sickness or because they are studying has increased since 1997, this has been more than offset by a decline in the number of women who care for family and/or their home. For both men and women, the proportion of the economically inactive who say they would like a job has declined since 1997 from 31.4% to 25.5%.
17 See Office for National Statistics (2005).
15

Figure 3.2 Unemployment Rates in Britain, 1979 – 2006
0
2
4
6
8
10
12
14
16
1979
1984
1989
1994
1999
2004
Year
Une
mpl
oym
ent r
ates
(%)
-3%
-2%
-1%
0%
1%
2%
3%
4%
5%
6%
All
Male
Female
GDP growth(right axis)
Thatcher Major Blair
Notes: Seasonally adjusted. Unemployment is measured according to the ILO definition. This covers people who are: out of work, want a job, have actively sought work in the previous four weeks and are available to start work within the next fortnight; or out of work and have accepted a job that they are waiting to start in the next fortnight. Source: Office for National Statistics.
Figure 3.3 Inactivity Rates in Britain, 1979-2006
0
5
10
15
20
25
30
35
40
1979
1984
1989
1994
1999
2004
Year
Inac
tivity
rate
s (%
)
-3%
-2%
-1%
0%
1%
2%
3%
4%
5%
6%
Rea
l GD
P gr
owth
All
Male
Female
GDP growth(right axis)
Thatcher Major Blair
Notes: Seasonally adjusted. The inactivity rate is calculated as the proportion of the working age population who are neither employed or unemployed (see figure notes for Figure 3.1 and Figure 3.2). Source: Office for National Statistics.
Some of the Government’s most high profile employment policies – the Working Families’ Tax Credit and the New Tax Credits – have been targeted either exclusively or largely at families with children, and Figure 3.4 shows that employment rates have risen in four groups of adults in families with dependent children. Men in couples with children and women living in couples with a working partner have relative high rates, and both are higher now than in 1997, although there is a suggestion that the employment rate of mothers with working partners may have plateaued. However, more disadvantaged groups
16

(lone parents, and women in couples with a non-working partner) have seen much greater growth in employment. In particular, the employment rate of lone parents rose from 45.5% to 56.5% between 1997 and 2006 [2006 not shown in the graph]. This has meant that the proportion of children in workless households – a key target of the labour Government when it came to power – has fallen from 18.5% to 16.1% since 1997 (not shown).
Figure 3.4. Employment rates of adults in families with dependent children
0%
10%
20%
30%
40%
50%
60%
70%
80%
90%
100%
1994 1996 1998 2000 2002 2004
Lone parents
Women in couples: fatherworks
Women in couples: fatherdoes not work
Fathers in couples
Source: from Brewer and Shephard (2004), based on quarterly Labour Force Survey data.
3.3 Relative poverty
As discussed above, the UK Government has sought to reduce relative poverty, with tough targets for reductions amongst children (see Waldfogel, this volume).
Table 3.3 shows relative poverty rates (ie, the proportion of the population living in households with less than 60% of median equivalised income) since 1996/7. Other than a blip upwards in the last year, the trend over the past decade has been for falls in relative poverty, concentrated amongst children (and their parents) and pensioners. However, relative poverty rates amongst the remaining group – working-age non-parents, is in 2005/6 at its highest ever level.
Table 3.3. Relative poverty: percentage and number of individuals in households with incomes below 60% of median AHC income
17

Children Pensioners Working-age parents
Working-age non-parents
All
% Million % Million % Million % Million % Million1996–97 (GB) 34.1 4.3 29.1 2.9 26.6 3.3 17.2 3.5 25.3 14.0 1997–98 (GB) 33.2 4.2 29.1 2.9 25.9 3.2 15.9 3.3 24.4 13.6 1998–99 (GB) 33.9 4.3 28.6 2.9 26.3 3.2 15.5 3.2 24.4 13.6 1999–00 (GB) 32.7 4.2 27.6 2.8 25.5 3.1 16.1 3.4 24.0 13.4 2000–01 (GB) 31.1 3.9 25.9 2.6 24.7 3.0 16.2 3.4 23.1 13.0 2001–02 (GB) 30.8 3.9 25.6 2.6 24.5 3.0 15.6 3.4 22.7 12.8 2002–03 (UK) 29.8 3.9 24.2 2.5 24.1 3.0 16.5 3.7 22.4 13.1 2003–04 (UK) 28.7 3.7 20.6 2.2 23.5 2.9 16.6 3.7 21.5 12.6 2004–05 (UK) 28.4 3.6 17.6 1.9 23.0 2.9 16.1 3.6 20.5 12.1 2005–06 (UK) 29.8 3.8 17.0 1.8 24.8 3.1 17.5 4.0 21.6 12.7 Changes (ppt) Total: 1996–97 to 2005–06
–4.3 –12.1 –1.8 (0.3) –3.6
Labour I: 1996–97 to 2000–01
–3.0 –3.2 –1.9 –1.0 –2.1
Labour II: 2000–01 to 2004–05
–2.8 –8.3 –1.6 (–0.1) –2.6
Latest year: 2004–05 to 2005–06
(1.4) (0.2) (–0.6) (–0.1) 1.8 0.2 1.4 0.3 1.1 0.7
Notes: Reported changes may not equal the differences between the corresponding numbers due to rounding. Changes in parentheses are not significantly different from zero at the 5% level. Changes in the number of individuals in poverty are only shown where these can be calculated consistently at the UK level. All figures are presented using the modified OECD equivalence scale. Source: from Brewer et al (2007b), based on Family Resources Survey, various years.
Although the UK government has not seemed so concerned with overall inequality, it is instructive to review progress in this area.18 The Gini coefficient in Great Britain rose from a value of around 0.25 in 1979 and reached a peak in the early 1990s of around 0.34. Since the early 1990s, the changes in income inequality have been less dramatic: after falling slightly over the early to mid-1990s, inequality is effectively unchanged from its level in the mid 1990s, and remains at historically high levels (not shown here).19
18 One view is that the concern for relative poverty is a concern about inequality at the bottom, given that the poverty line is a fraction of median income.
19 For past trends, see Goodman et al (1997). Note that other measures of inequality, such as the 90:10 ratio, have fallen since 1997/8: see Brewer et al (2007b).
18

4. A focus on some specific evaluations
This section provides a closer look at some of the evaluations of the UK Government’s policies, describing econometric evaluations of WFTC, NDYP, and Pathways to Work.
4.1 Working Families’ Tax Credit
As one of the highest-profile changes to be made early on by the present UK Government, WFTC has been evaluated in a number of studies, and these are summarised in Brewer and Browne (2006). The review compared studies that had treated the introduction of WFTC as a natural experiment with one that used a structural model of labour supply to simulate ex post the impact of WFTC compared with its predecessor. In general, the results from both sets of studies are reassuringly similar (this can also be viewed as a validation of the structural model).
Those studies that treated the introduction of WFTC as a natural experiment used difference-in-differences to estimate the impact of WFTC on the employment of families with children, making use of families without children as a control group. The raw data underlying this is shown in Figure 4.1: there is a clear convergence in the employment rate of lone parents with single adults without children which, prima facie, would suggest a positive employment effect of WFTC.20
20 In fact, the convergence starts some time before October 1999, and the various studies reviewed by Brewer and Browne (2006) have different ways of accounting for this.
19

Figure 4.1. Employment rates of single adults by parental status, 1997 – 2004.
30
40
50
60
70
80
1997
Q1
1998
Q1
1999
Q1
2000
Q1
2001
Q1
2002
Q1
2003
Q1
2004
Q1
Empl
oym
ent r
ate
(%)
Lone parentsSingle adults without children
Notes: Not seasonally adjusted. The employment rate is calculated as the percentage of the population of working age (16–59 for women and 16–64 for men) who are in employment (working at least one hour in the reference week or temporarily away from a job). Source: Brewer and Shephard (2005), based on Labour Force Survey data, various years.
One limitation of the difference-in-differences approach is that it cannot evaluate the impact of WFTC alone on labour market behaviour of families with children, because WFTC was introduced around the same time as other tax and benefit reforms that affected families with children (most of which were referred to in section 3). Technically, those studies using difference-in-differences are evaluating the impact of all changes to the economic and policy environment that affected families with children differently from families without children: the most important of these other than WFTC was an increase in welfare benefits for families with children.
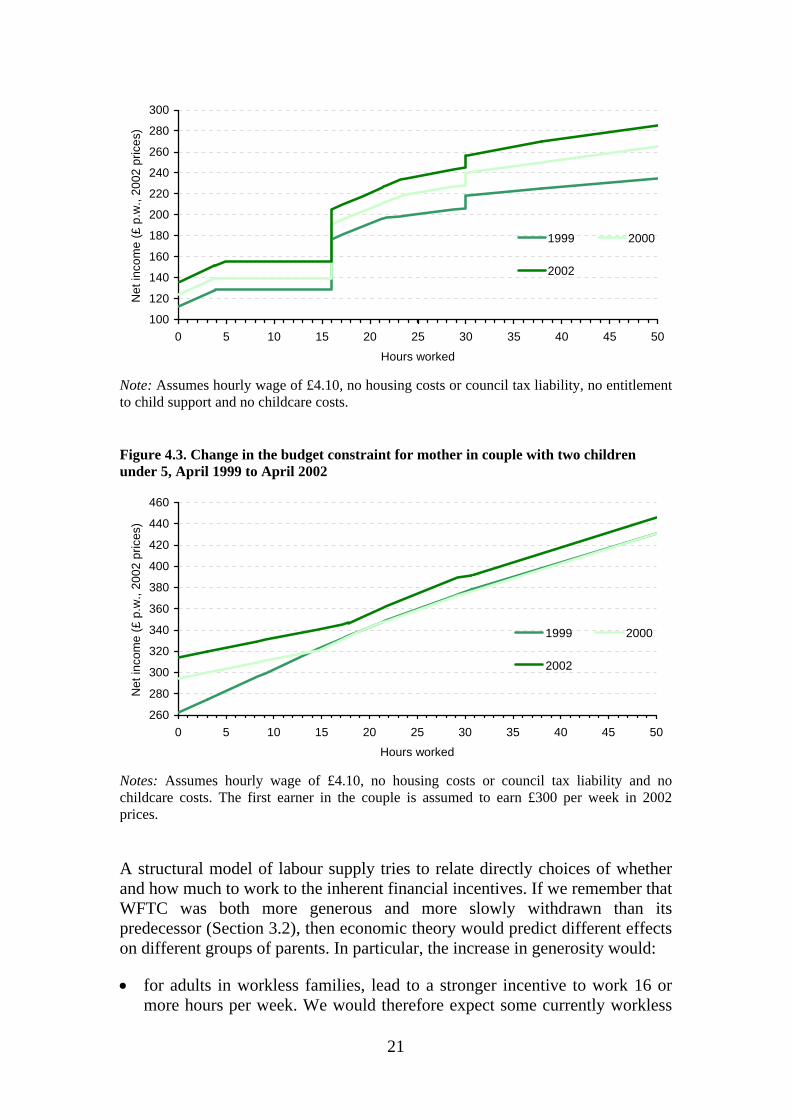
Figures 4.2 and 4.3 illustrate this by showing the impact of tax and benefit changes between April 1999 and April 2002 (ie just before WFTC was introduced to just before CTC and WTC replaced it) on the budget constraints faced by a lone parent and by a mother in a couple respectively, both with two children aged under 5 and earning the 2002 minimum wage. Figure 4.2 makes clear that the income available to a lone parent who was not working increased substantially over this period, although by slightly less than the income available to a low-earning working lone parent. Figure 4.3 shows that the income available to the family when the second earner does not work increased substantially, but the income available to the family when both adults worked increased by much less, consistent with a higher PTR (see section 4.1).
Figure 4.2. Change in the budget constraint for a lone parent with two children under 5, April 1999 to April 2002
20
100
120
140
160
180
200
220
240
260
280
300
0 5 10 15 20 25 30 35 40 45 50
Hours worked
Net
inco
me
(£ p
.w.,
2002
pric
es)
1999 2000
2002
Note: Assumes hourly wage of £4.10, no housing costs or council tax liability, no entitlement
Figure 4.3. Change in the budget constraint for mother in couple with two children
to child support and no childcare costs.
under 5, April 1999 to April 2002
260
280
300
320
340
360
380
400
420
440
460
0 5 10 15 20 25 30 35 40 45 50Hours worked
Net
inco
me
(£ p
.w.,
2002
pric
es)
1999 2000
2002
Notes: Assumes hourly wage of £4.10, no housing costs or council tax liability and no
A structural model of labour supply tries to relate directly choices of whether
• for adults in workless families, lead to a stronger incentive to work 16 or more hours per week. We would therefore expect some currently workless
childcare costs. The first earner in the couple is assumed to earn £300 per week in 2002 prices.
and how much to work to the inherent financial incentives. If we remember that WFTC was both more generous and more slowly withdrawn than its predecessor (Section 3.2), then economic theory would predict different effects on different groups of parents. In particular, the increase in generosity would:
21

families to participate as a result of this reform, and also some parents currently working less than 16 hours per week to move over the threshold.
lead to a reduction in the number of two-worker families, when two-worker• families found they needed to work a little less hard in order to achieve their
Th dults in different families depending on their income:
ould be an increase in the returns to an extra hour’s work as a result of the lower withdrawal rate,
• se who previously earned too much to claim FC but who were now eligible for WFTC would experience both an income
The Tasimulations of WFTC alone on lone parents: employment is predicted to rise by
upply
pre-reform standard of living (an income effect away from work).
e lower withdrawal rate would also have different effects on a
• For those previously claiming FC, there w
leading to an increase in the number of hours worked (a substitution effect towards work).
On the other hand, tho
and a substitution effect away from work.
ble below [apologies: copied directly from PDF] shows the results of the
5.1 ppts (from 45.3%), and mean hours worked increases amongst workers (because the lower withdrawal rate increased incomes the most where the taper previously ended, usually corresponding to full-time work). However, the reforms implemented at the same time as the WFTC acted to reduce employment amongst lone parents, and a simulation of the set of changes actually introduced between 1999 and 2002 (not shown here) suggests that tax and benefit changes increased lone parent employment by 3.7 ppts.
Table 4.1. The estimated impact of WFTC on lone mothers’ labour s
After WFTC
Not working Part- me Full-time Total tiBefore WFTC Not working 49.6 2.4 2.8 54.7 Part-time 0.0 22.4 1.1 23.5 Full-time 0.0 0.41 21.4 21.8 Total 49.6 25.2 25.2 100.0 Change in employmen 5.1 (0.68) t rate Average change in week s 1.78 ) ly hour(all)
(0.21
Average change in weekly hours (workers)
0.75 (0.05)
Average hours before WFTC (all) 12.42 (0.20) Average hours before WFTC 27.4 (0.16) (workers) Notes: based on Table 4 in Brewer et al (2006 . Estimated standard deviations iven in bb) g rackets.
22
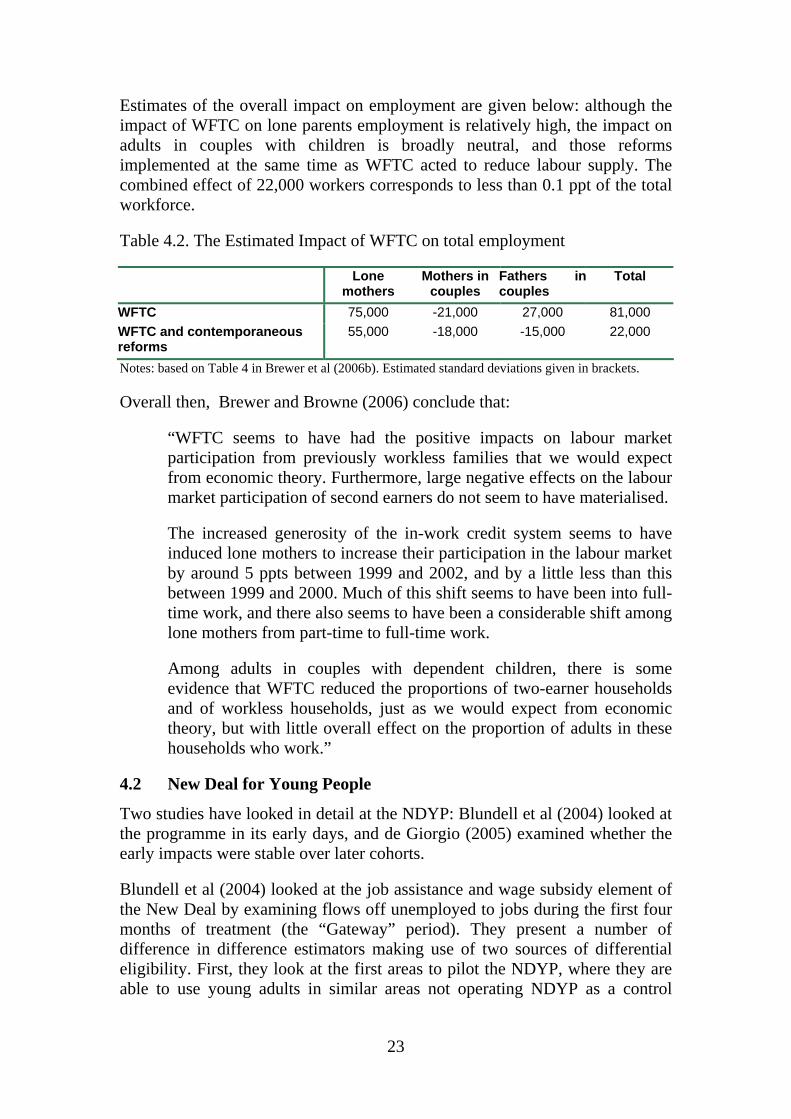
Estimates of the overall impact on employment are given below: although the impact of WFTC on lone parents employment is relatively high, the impact on adults in couples with children is broadly neutral, and those reforms implemented at the same time as WFTC acted to reduce labour supply. The combined effect of 22,000 workers corresponds to less than 0.1 ppt of the total workforce.
Table 4.2. The Estimated Impact of WFTC on total employment
Lone mothers
Mothers in couples
Fathers in couples
Total
WFTC 75,000 -21,000 27,000 81,000 WFTC and contemporaneous reforms
55,000 -18,000 -15,000 22,000
Notes: based on Table 4 in Brewer et al (2006b). Estimated standard deviations given in brackets.
Overall then, Brewer and Browne (2006) conclude that:
“WFTC seems to have had the positive impacts on labour market participation from previously workless families that we would expect from economic theory. Furthermore, large negative effects on the labour market participation of second earners do not seem to have materialised.
The increased generosity of the in-work credit system seems to have induced lone mothers to increase their participation in the labour market by around 5 ppts between 1999 and 2002, and by a little less than this between 1999 and 2000. Much of this shift seems to have been into full-time work, and there also seems to have been a considerable shift among lone mothers from part-time to full-time work.
Among adults in couples with dependent children, there is some evidence that WFTC reduced the proportions of two-earner households and of workless households, just as we would expect from economic theory, but with little overall effect on the proportion of adults in these households who work.”
4.2 New Deal for Young People
Two studies have looked in detail at the NDYP: Blundell et al (2004) looked at the programme in its early days, and de Giorgio (2005) examined whether the early impacts were stable over later cohorts.
Blundell et al (2004) looked at the job assistance and wage subsidy element of the New Deal by examining flows off unemployed to jobs during the first four months of treatment (the “Gateway” period). They present a number of difference in difference estimators making use of two sources of differential eligibility. First, they look at the first areas to pilot the NDYP, where they are able to use young adults in similar areas not operating NDYP as a control
23

group. Second, they look at a time when the programme ran nationally, and use slightly older (and therefore ineligible) adults as a control group.
They conclude that the outflow rate to jobs has risen by about 20 per cent for young men as a result of the New Deal during its National Roll Out (i.e. five percentage points more men find jobs in the first four months of the New Deal above a pre-program level of twenty five percentage points).21 The results are very similar when using regional comparison groups to when older, ineligible adults are used as the control group; this suggests that either equilibrium wage and substitution effects are not very strong or they broadly cancel each other out.
The idea of using older, ineligible, adults as a control group was exploited further in De Giorgi (2005), who estimate a local average treatment effect (LATE) using a non-parametric regression discontinuity. De Giorgi is also able to look at outcomes after a longer period of time (ie up to 12 months after starting the gateway, rather than 4 months) and for a series of different cohorts. Reassuringly, the study also finds that the NDYP increases the proportion of unemployed men who move into work by about 6-7%, and that this impact is relatively stable over time.
4.3 Pathways to work
As is common with reforms piloted by the UK Department for Work and Pensions, the Pathways to Work policies were first introduced in a number of areas. As with the pilots of the NDYP, this naturally suggests a difference in difference evaluation, using claimants of incapacity benefits in non-pilot areas as a control group.
Figure 4.4 applies this concept to administrative data, and shows that flows off incapacity benefits in the pilot areas were around 8 percentage points higher in the six months after starting a claim than in other areas, and that this effect occurred for both phases of pilots.
Figure 4.4 Six-month off-flow rate from incapacity benefits, by whether or not subject to the Pathways to Work pilots in October 2003 (Phase 1) or April 2004
(Phase 2).
21 Women make up around 1 in 4 participants on NDYP; Blundell et al (2004) reports that the estimated impacts on women were smaller, less precisely estimated, and not robust to the choice of control group.
24

20%
25%
30%
35%
40%
45%
50%
Jul-1
999
Oct
-199
9Ja
n-20
00Ap
r-20
00Ju
l-200
0O
ct-2
000
Jan-
2001
Apr-
2001
Jul-2
001
Oct
-200
1Ja
n-20
02Ap
r-20
02Ju
l-200
2O
ct-2
002
Jan-
2003
Apr-
2003
Jul-2
003
Oct
-200
3Ja
n-20
04Ap
r-20
04Ju
l-200
4O
ct-2
004
Jan-
2005
Apr-
2005
Time of benefit start
Non Pathways areasPhase 1 areasPhase 2 areas
October2003
April2004
Source: Chart 2, Page 54 of House of Commons Work and Pensions Committee (2006). See also Blyth (2006).
In a more formal evaluation, Table 4.3 shows difference-in-differences estimates of the outcomes of interest for those who made an enquiry about claiming incapacity benefits (having taking into account background characteristics, time since the enquiry and broad area of residence).
The first column shows the early impact of the Pathways to Work pilots on the likelihood of being in paid work in the week before to the second wave interview (which is on average around 10½ months after the individual made the initial enquiry about claiming incapacity benefits 22). It shows that the early impact of the Pathways to Work policy was to increase the percentage of individuals doing paid work at that time by +9.4 percentage points. To place this in context, just under one-third (31.9%) of those in the pilot areas in the period after the pilots had been implemented reported that they had been in paid work in the previous week, so the estimated impact suggests that in the absence of these pilots the employment rate in the last week would have been just 22.5% (i.e. 31.9–9.4).
Table 4.3 Difference-in-differences estimates of the early impact, all who made enquiry about claiming incapacity benefits
Paid work last week
Monthly earnings
Receives incapacity benefits
Reports that “health affects
activities” (1) (2) (3) (4)
25

Paid work last week
Monthly earnings
Receives incapacity benefits
Reports that “health affects
activities” (1) (2) (3) (4) Estimated treatment effect
9.44*** (2.26)
71.73*** (20.05)
–8.19*** (2.51)
–2.87** (1.40)
Sample size 7,861 7,861 7,861 7,861 Adjusted R^2 14.9% 13.8% 11.0% 34.2%
Note: Unweighted. Standard errors in parentheses. *** denotes that the coefficient is statistically different from zero at the 1% level; ** at the 5% level and * at the 10% level. Other variables controlled for include days since initial enquiry into claiming IB, broad area of residence, and a set of demographic variables, education level and initial health condition. Source: Derived from tables in chapter 4 of Adam et al (2006)
The estimates also suggest that the early effects of the pilots were to increase monthly earnings (by £71.73, or over a quarter of total earnings in the pilot areas), reduce the likelihood an individual was claiming incapacity benefits by 8 percentage points, and reduce the percentage of respondents reporting that their health limited their daily activities. The pilots seem to have been more successful at helping older workers, and those who did not claim to have mental health problems. However, the authors stress that these are preliminary results covering a very short period of time, and more evidence on medium-run impacts are needed.
5. Conclusions
This paper has presented a tour of welfare reform in the UK over the past decade since the last change of government. It has presented the most important changes in active labour market policies, and to measures intended to strengthen financial incentives to work, including a minimum wage and parental subsidies for spending on work-related childcare.
We have argued that the developments in the UK’s active labour market policies went in two broad phases: first, the Government sought to strengthen ALMPs for those individuals claiming Jobseeker’s Allowance, the benefit for those deemed to be unemployed, chiefly through various New Deal programmes. Second, the Government has turned to those individuals claiming benefits because they are not in work, but who traditionally have been viewed as inactive and therefore excused from job search activity: lone parents, and the sick and disabled (those claiming incapacity benefits). For both those groups, we have seen a gradual escalation in the requirements asked of benefit recipients, and in the focus on work, but this has stopped short of requiring job-search (or similar activities) as a condition of receiving benefit.
There have also been two phases of changes to taxes, benefits and financial work incentives. A set of changes in the late 1990s (including the WFTC)
26

aimed to strengthen financial work incentives. But tax credits for families with children and in-work support for those without children were comprehensively altered in 2003 in a reform whose economic rationale is less clear. UK assessments of the merits of the 2003 reform have ever since been (rightly) dominated by operational concerns, and recent government policy on tax credits and financial work incentives is harder to infer than it was nearly a decade ago, except perhaps for an increased use of targeted and time-limited in-work payments.
Blundell (2002) describes the goals of welfare reform as being to reduce government expenditure, increase the income of the poor (or low skilled) and increase labour supply; what varies across countries and over time is the relative weight given to these often contradictory goals. Where within this triangle can we place the current UK government? We would argue that the reforms to ALMPs are primarily motivated by the desire to reduce spending on welfare benefits, and to increase labour supply and thereby GDP.
However, the aims of the Government’s changes to taxes and benefits are less clear cut. Although we have argued that there have been a set of changes to taxes and benefits designed deliberately to strengthen financial work incentives, the story is more complicated than this, for at least two reasons. First, the expansion of the WFTC and the expansion in the generosity of tax credits that followed have generally been weakening the financial work incentives of (potential) second earners in families with children. Second, as well as increasing the generosity of tax credits that are conditional on work, welfare benefits for families with children and (after 2003), the child tax credit (which is not work-contingent, and is means-tested with an extremely generous earnings disregard) have been increased too. In other words, the extent to which financial work incentives have been strengthened has been compromised by the Government’s desire to achieve broad reductions in relative child poverty. And it has learnt that, although welfare to work measures can help reduce child poverty, achieving short-run reductions in child poverty is only possible with increases to the generosity of benefits and tax credits available to low-income families with children, and in recent years, this has increasingly meant increases in income-related payments to families with children, with obvious implications for financial work incentives.
We have also summarised independent evaluations of three important UK policies: WFTC, NDYP and the newer Pathways to Work pilots. All have been deemed by the Government to have been “successful”. However, for WFTC and Pathways to Work, this is true only if “success” is defined as “has had a desirable impact on outcomes of interest”; to date only NDYP has been subject to a full cost and benefit analysis.
27
References
Adam, S., Emmerson, C., Frayne, C. and Goodman, A. (2006) Early quantitative evidence on the impact of the Pathways to Work pilots, Department for Work and Pensions Research Report 354, Leeds: CDS.
Blundell, R. (2002), ‘Welfare-to-Work: Which Policies Work and Why?’, Keynes Lecture in Economics, Proceedings of The British Academy, Vol.117, 477-524.
Blundell, R., Costa Dias, M., Meghir, C, and Van Reenen, J. (2004) “Evaluating the employment impact of a mandatory job search assistance program”, Journal of the European Economic Association, 2, 569-606.
Blyth, B. (2006), Incapacity Benefit reforms – Pathways to Work Pilots performance and analysis, Working Paper No. 26, London: Department for Work and Pensions (http://www.dwp.gov.uk/asd/asd5/wp26.pdf)
Brewer, M. (2003), “The New Tax Credits”, IFS Briefing Note no. 35, http://www.ifs.org.uk/bns/bn35.pdf .
Brewer, M. and Browne, J. (2006), “The Effect of the Working Families’ Tax Credit on Labour Market Participation”, IFS Briefing Note no. 69, http://www.ifs.org.uk/bns/bn69.pdf.
Brewer, M., Crawford, C. and Dearden, L. (2005), “Reforms to childcare policy” in Robert Chote, Carl Emmerson, David Miles and Zoë Oldfield (eds), IFS Green Budget 2005, London: Institute for Fiscal Studies.
Brewer, M., Goodman, A., Shaw, J. and Sibieta, L. (2006a), Poverty and Inequality in Britain: 2006, Commentary no. 101, London: Institute for Fiscal Studies.
Brewer, M., Duncan, A., Shephard, A. and Suarez, M-J., (2006b), “Did Working Families’ Tax Credit Work? The Impact of In-Work Support on Labour Supply in Great Britain”, Labour Economics 13, 699-720.
Brewer, M., Browne, J., Crawford, C. and Knight, G. (2007a), The lone parent pilots after 12 to 24 months: an impact assessment of In-Work Credit, Work Search Premium, Extended Schools Childcare, Quarterly Work Focused Interviews and New Deal Plus for Lone Parents, Department for Work and Pensions Research Report 415. Leeds: CDS.
Brewer, M., Goodman, A., Muriel, A. and Sibieta, L. (2007b), Poverty and Inequality in Britain: 2007, Briefing Note 73, London: Institute for Fiscal Studies
Brewer, M. and Paull. G. (2004), “Reviewing approaches to understanding the link between childcare use and mothers’ employment”, Department for Work and Pensions Working Paper 14, http://www.dwp.gov.uk/asd/asd5/WP14.pdf
Brewer, M and Shephard, A. (2004) “Has Labour Made Work Pay?”, http://www.jrf.org.uk/bookshop/eBooks/1859352626.pdf.
Brewer, M and Shephard, A. (2005), “Employment and the Labour Market”, IFS 2005 Election Briefing Note no. 5, http://www.ifs.org.uk/bns/05ebn5.pdf.
28

Department for Work and Pensions (2002), Pathways to work: Helping people into employment, London: Department for Work and Pensions, Cm 5690, (http://www.dwp.gov.uk/consultations/consult/2002/pathways/pathways.pdf).
Department for Work and Pensions (2005), Five year strategy: Opportunity and security throughout life, London: Department for Work and Pensions, Cm 6447, (http://www.dwp.gov.uk/publications/dwp/2005/5_yr_strat/pdf/report.pdf).
Department for Work and Pensions (2006), A New Deal for Welfare: Empowering People to Work, Cm 6730 session 2005/6, London: TSO.
Department for Work and Pensions (2007), Households Below Average Income 1994/95–2005/06, Leeds: Corporate Document Services.
Dickens, R. and Manning, A. (2002), ‘Has the National Minimum Wage Reduced UK Wage Inequality?’, London: Centre for Economic Performance.
De Giorgi, G. (2005). “Long-term effects of a mandatory multistage program: the New Deal for young people in the UK”, IFS Working Papers, W05/08.
Goodman, A., Johnson, J. and Webb, S. (1997), Inequality in the UK, Oxford: Oxford University Press.
Gregg, P., Johnson, P. and Reed, H. (1999), Entering Work and the Tax and Benefit System, London: Institute for Fiscal Studies.
HM Revenue and Customs (2007), “Child Tax Credit and Working Tax Credit Take-up rates 2004-05”, http://www.hmrc.gov.uk/stats/personal-tax-credits/takeup-rates2004-05.pdf.
HM Treasury (1997), Employment Opportunity in a Changing Labour Market, The Modernisation of Britain’s Tax and Benefit System Number 1, London: HM Treasury.
HM Treasury (1998), Work Incentives: A Report by Martin Taylor, The Modernisation of Britain’s Tax and Benefit System Number 2, London: HM Treasury.
HM Treasury (2007), Building Britain’s Long-term Future: Prosperity and Fairness for Families. London: The Stationery Office.
House of Commons Work and Pensions Committee (2006), Incapacity Benefits and Pathways to Work, Volume I (http://www.publications.parliament.uk/pa/cm200506/cmselect/cmworpen/616/616i.pdf).
Machin, S. and Wilson, J. (2004), ‘Minimum wages in a low-wage labour market: care homes in the UK’, Economic Journal, 114, C102–109.
Myck, M. (2000), “Fiscal Reforms Since 1997”, Institute for Fiscal Studies Briefing Note 14, http://www.ifs.org.uk/bns/bn14.pdf.
Office for National Statistics (2004a), Labour Market Trends, vol 112, no 12, pp 481-483.
29

Office for National Statistics (2004b), ‘Work and Worklessness among Households July 2004’, http://www.statistics.gov.uk/pdfdir/work0704.pdf.
Office for National Statistics (2005), Labour Market Trends, April 2005, www.statistics.gov.uk/downloads/theme_labour/LMT_April05.pdf
Stewart, M. (2004), ‘The employment effects of the national minimum wage’, Economic Journal, 114, C110–116.
30


