36
Financial Overview John Shrewsberry, Senior EVP, Chief Financial Officer May 24, 2016 © 2016 Wells Fargo & Company. All rights reserved.
| Date post: | 07-Feb-2018 |
| Category: |
Documents |
| Upload: | truongdien |
| View: | 217 times |
| Download: | 0 times |

Financial Overview
John Shrewsberry, Senior EVP, Chief Financial Officer
May 24, 2016
© 2016 Wells Fargo & Company. All rights reserved.

- -
Strong results since 2014 Investor Day
2013 2015
83.886.1
2013 2015
Book Value per Common Share (1)
Revenue ($ in billions)
Pre tax Pre provision Profit (2)
($ in billions) Diluted Average Common Shares Outstanding (in millions)
Net Capital Returned to Shareholders (3) ($ in billions)
Diluted EPS
34.936.1
2013 2015
5,371.2
5,209.8
2013 2015
7.2
12.6
2013 2015
$3.89$4.12
2013 2015
$30.48
$34.58
1Q14 1Q16
(1) Book value per common share is common stockholder’s equity divided by common shares outstanding. (2) Pre-tax pre-provision profit (PTPP) is total revenue less noninterest expense. Management believes PTPP is a useful financial measure because it enables
investors and others to assess the Company’s ability to generate capital to cover credit losses through a credit cycle. (3) Represents common stock dividends and net share repurchases.
Wells Fargo 2016 Investor Day Financial Overview 1
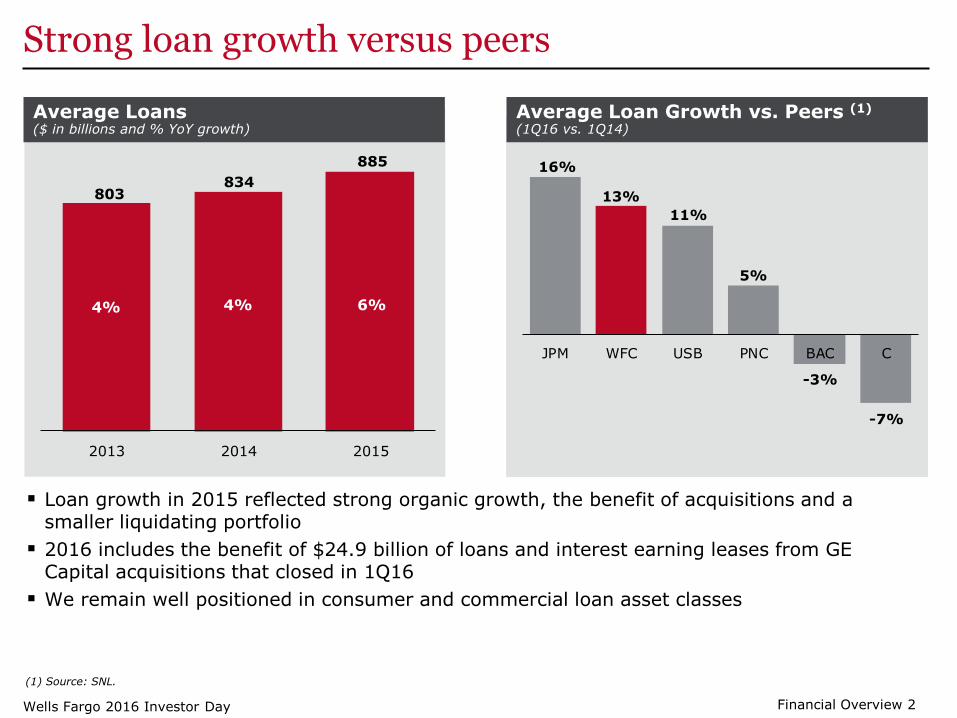
Strong loan growth versus peers
803834
885
2013 2014 2015
16%
13%
11%
5%
-3%
-7%
JPM WFC USB PNC BAC C
6%4% 4%
Average Loans ($ in billions and % YoY growth)
Average Loan Growth vs. Peers (1)
(1Q16 vs. 1Q14)
Loan growth in 2015 reflected strong organic growth, the benefit of acquisitions and a smaller liquidating portfolio
2016 includes the benefit of $24.9 billion of loans and interest earning leases from GE Capital acquisitions that closed in 1Q16
We remain well positioned in consumer and commercial loan asset classes
(1) Source: SNL.
Wells Fargo 2016 Investor Day Financial Overview 2

Strong deposit growth versus peers
15%
13% 13%
7%
3%
-5%
USB WFC PNC BAC JPM C
1,021
1,114
1,194
2013 2014 2015
7% 9% 9%
Average Deposits ($ in billions and % are YoY growth)
Average Deposit Growth vs. Peers (1)
(1Q16 vs. 1Q14)
Average deposit growth of 7% in 2015 reflected growth across the franchise
Average deposit cost of 10 bps in 1Q16, up 1 bp from 1Q15 as we maintained pricing discipline
(1) Source: SNL.
Wells Fargo 2016 Investor Day Financial Overview 3

Diversified business model has driven revenue growth despite low rates
5% 5%
4% 4% 4% 4%
WFC USB PNC C BAC PNC
5% 5%
-2%
-3%
-4%
-7%
WFC USB JPM C PNC BAC
Revenue Growth (TTM (1) 1Q14 through TTM 1Q16)
Revenue/Average Assets (2Q14 through 1Q16)
Source: SNL. (1) Trailing twelve months.
Wells Fargo 2016 Investor Day Financial Overview 4
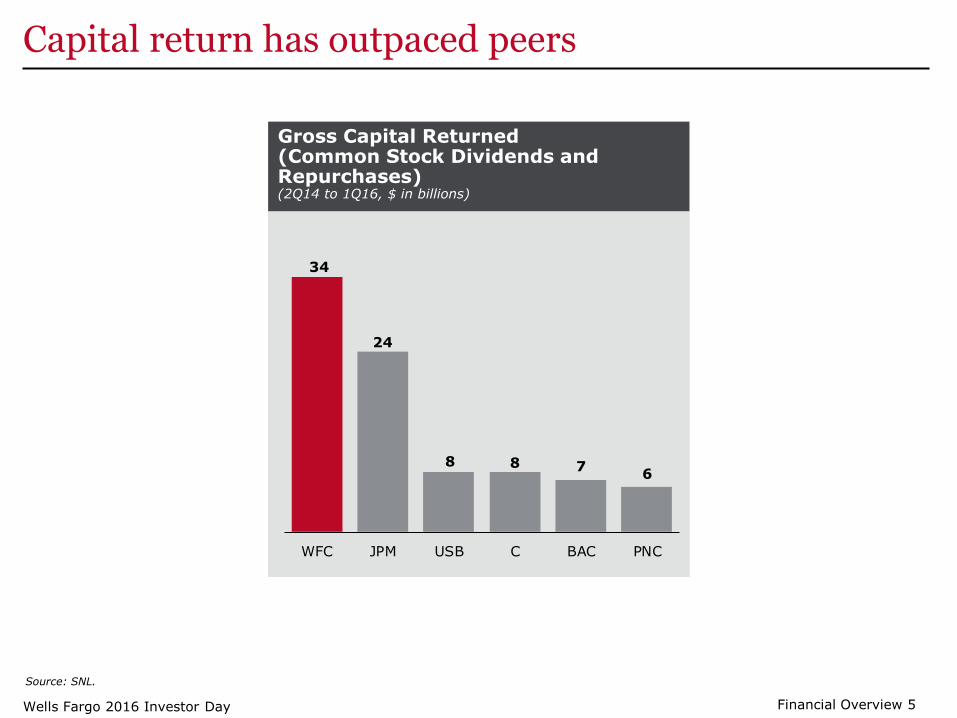
Capital return has outpaced peers
34
24
8 8 76
WFC JPM USB C BAC PNC
Gross Capital Returned (Common Stock Dividends and Repurchases) (2Q14 to 1Q16, $ in billions)
Source: SNL.
Wells Fargo 2016 Investor Day Financial Overview 5
-
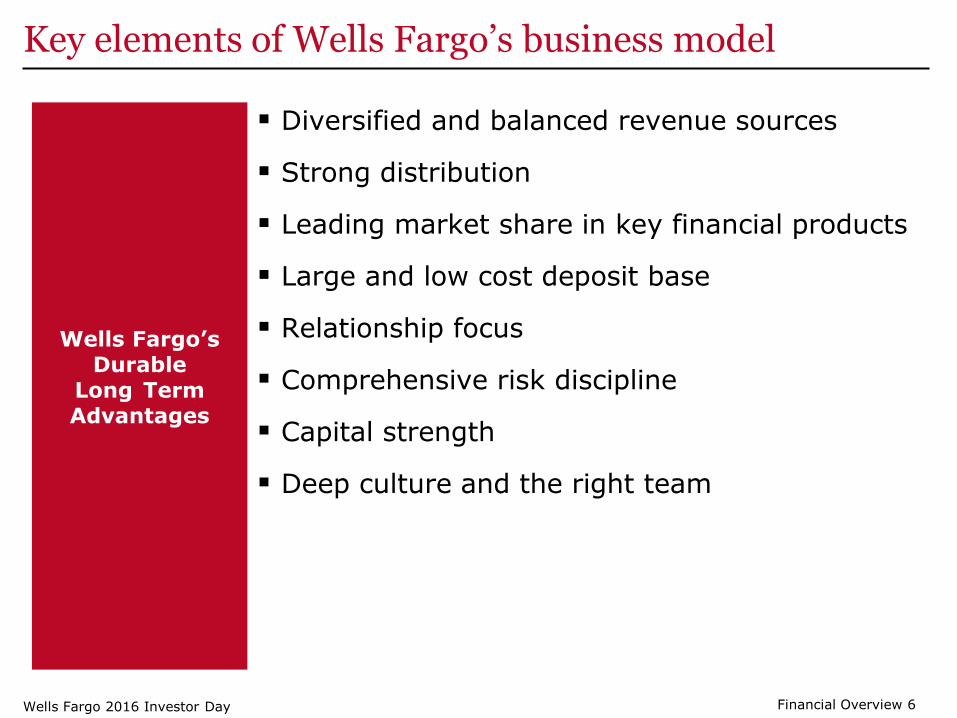
Key elements of Wells Fargo’s business model
Wells Fargo’s Durable
Long Term Advantages
Diversified and balanced revenue sources
Strong distribution
Leading market share in key financial products
Large and low cost deposit base
Relationship focus
Comprehensive risk discipline
Capital strength
Deep culture and the right team
Wells Fargo 2016 Investor Day Financial Overview 6

47%
53%Net Interest
Income
Noninterest Income
$22.2 billion
Balanced and diversified sources of revenue
Balanced Spread and Diversified Fee Generation (% of noninterest income) Fee Income
Deposit Service Charges 12%
Brokerage Advisory, Commissions and Other 21%
Trust and Investment Management 8%
Investment Banking 3%
Card Fees 9%
Charges and Fees on Loans 3%
Cash Network 1%
CRE Brokerage Commissions 1%
Letters of Credit Fees 1%
Wire & Remittance and All Other Fees 4%
Mortgage Servicing, net 8%
Mortgage Originations/Sales, net 7%
Insurance 4%
Net Gains from Trading 2%
Net Gains on Debt Securities 2%
Net Gains from Equity Investments 2%
Lease Income 4%
All Other Noninterest Income 8%
Deposit Service Charges 12% Net Gains from Trading 2%
Total Trust & Investment Fees 32% Net Gains on Debt Securities 2%
Card Fees 9% Net Gains from Equity Inv. 2%
Total Other Fees 10% Lease Income 4%
Total Mortgage Banking 15% All Other Noninterest Income 8%
Data for 1Q16. Insurance 4%
Financial Overview 7 Wells Fargo 2016 Investor Day
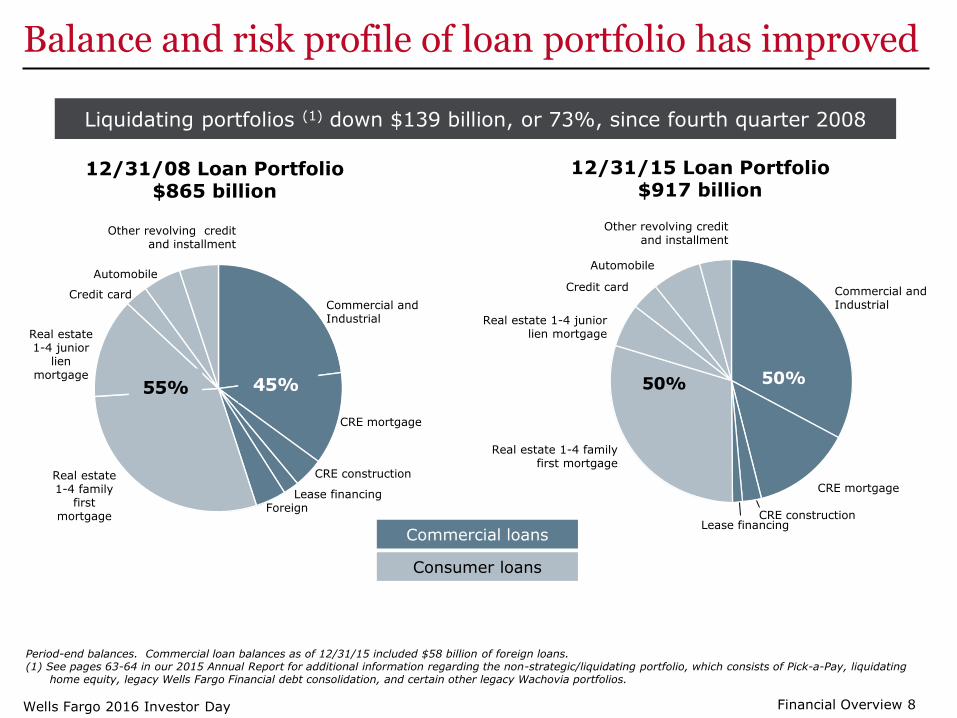
Balance and risk profile of loan portfolio has improved
Liquidating portfolios (1) down $139 billion, or 73%, since fourth quarter 2008
12/31/08 Loan Portfolio 12/31/15 Loan Portfolio $865 billion $917 billion
50%50%
Consumer loans
Commercial loans
Commercial and Industrial
CRE mortgage
CRE construction Lease financing
Real estate 1-4 family first mortgage
Real estate 1-4 junior lien mortgage
Credit card
Automobile
Other revolving credit and installment
Commercial and Industrial
CRE mortgage
CRE construction
Lease financing
Real estate 1-4 family
first mortgage
Real estate 1-4 junior
lien mortgage
Credit card
Other revolving credit and installment
Automobile
45%55%
Foreign
Period-end balances. Commercial loan balances as of 12/31/15 included $58 billion of foreign loans. (1) See pages 63-64 in our 2015 Annual Report for additional information regarding the non-strategic/liquidating portfolio, which consists of Pick-a-Pay, liquidating
home equity, legacy Wells Fargo Financial debt consolidation, and certain other legacy Wachovia portfolios.
Wells Fargo 2016 Investor Day Financial Overview 8

Our business model and size give us unique advantages vs. peers
Versus Large Banks
Lower risk profile
More straightforward business model
More U.S. focused
More consistent returns
Versus Regional Banks
Geographic diversification and proximity to customers
Broader distribution
More diverse product set
Deeper customer base
Economies of scale (risk infrastructure, innovation, product development)
Wells Fargo 2016 Investor Day Financial Overview 9

-
-
More straightforward, U.S.-focused business model than large peers
3.5%
3.0%3.0%
2.0%
JPMCBACWFC
19
44
53
86
WFC JPM BAC C
14.6%14.4%
8.2%
4.3%
JPMCBACWFC
4.4%
10.9% 11.4%
52.3%
WFC BAC JPM C
Non U.S. Exposure as a % of Total Assets (1)
(Source: Company reports, 4Q15) Trading Assets as a % of Total Assets (Source: Company reports, 4Q15)
GSIB Buffer (Source: Company reports, 4Q15)
Average 1 Day VaR, 99% confidence level (Source: Company reports, FY15, $ in millions)
(2)
(1) Top 20 non-U.S. country exposure, except for Citi which is all exposures over 0.75% of total assets (18 countries). (2) 95% confidence level.
Wells Fargo 2016 Investor Day Financial Overview 10

Higher, more stable returns than large peers
(1,000)
-
1,000
2,000
3,000
4,000
5,000
6,000
7,000
8,000
1Q12 1Q13 1Q14 1Q15 1Q16
BAC C JPM WFC
Return on Assets (ROA) vs. Volatility (1)
Normalized Standard Deviation of ROA
Long-T
erm
Avera
ge R
OA
GAAP Reported Earnings (1Q12-1Q16, $ in millions)
0.00%
0.50%
1.00%
1.50%
0% 50% 100% 150%
WFC
JPM
BAC
C
One of only two companies in the U.S., and the only bank, to earn over $5 billion for 14 consecutive quarters
Source: SNL. (1) Quarterly results from 1Q09 through 4Q15.
Wells Fargo 2016 Investor Day Financial Overview 11

Broader distribution and customer base than smaller peers
508
54 44
WFC PNC USB
1,649
296
138
WFC USB PNC
24
5 5
WFC USB PNC
6,123
3,129 2,613
WFC USB PNC
Number of Stores/Branches (Source: Company reports, 1Q16)
# of States Where Retail Deposit Market Share is #1 or #2 (1) (Source: FDIC, SNL, June 2015)
Residential Mortgage Loans Serviced $ in billions (Source: IMF, 4Q15)
2015 Wealth Management Rankings (2)
(Assets Under Management, $ in billions)
#4
#16 #19
(1) Retail deposits are pro forma for acquisitions, cap deposits at $1 billion in a single banking store and exclude credit unions. (2) Source: Barron’s; accounts with minimum $5 million.
Wells Fargo 2016 Investor Day Financial Overview 12

Market presence gives us a scale advantage versus smaller peers
209
53
10
WFC USB PNC
21.6
9.0
7.2
WFC PNC USB
147.7
42.7
28.2
WFC USB PNC
321.5
99.3 91.3
WFC PNC USB
Commercial Loans Outstanding (1)
($ in billions; Source: Company reports, 1Q16)
Commercial Real Estate Loans Outstanding ($ in billions; Source: Company reports, 1Q16)
Small Business Loan Originations (2)
($ in billions)
2015 Residential Mortgage Loan Originations ($ in billions; Source: IMF, FY15)
(1) WFC commercial loans reflects Commercial and Industrial loans outstanding. (2) Based on 2014 CRA government data for loans less than $1 million. Peer data is as reported by Wells Fargo Bank N.A,
PNC Bank N.A. (PA) and US Bank N.A. (WI).
Wells Fargo 2016 Investor Day Financial Overview 13

Our business model has provided leading total shareholder returns (1)
Total Shareholder Return (annualized) (1)
3 Year 5 Year 10 Year
WFC 12.3% 11.6% 7.1%
BAC 4.4 1.0 -9.6
C -1.7 -1.0 -20.2
JPM 10.5 8.0 6.2
PNC 10.7 8.6 5.0
USB 8.7 11.5 5.8
KBW Nasdaq
Bank Index 6.6 6.5 -2.5
Source: Bloomberg. (1) Total shareholder return means increases (decreases) in common stock price plus dividends issued on common stock. Assumes dividends are reinvested. As of 3/31/2016.
Wells Fargo 2016 Investor Day Financial Overview 14
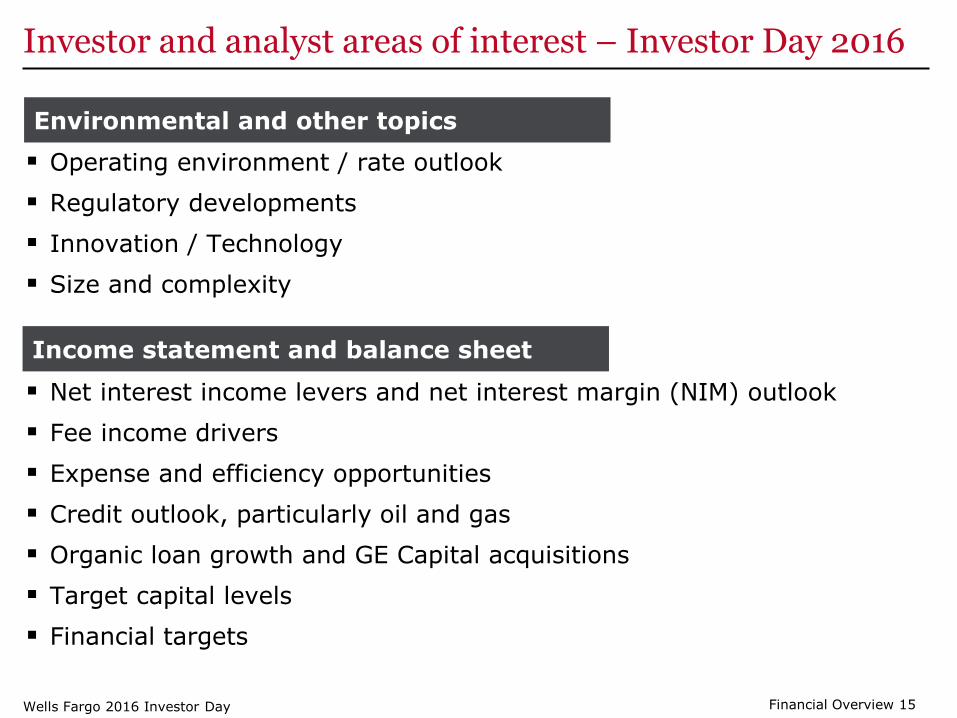
Investor and analyst areas of interest – Investor Day 2016
Environmental and other topics
Operating environment / rate outlook
Regulatory developments
Innovation / Technology
Size and complexity
Income statement and balance sheet
Net interest income levers and net interest margin (NIM) outlook
Fee income drivers
Expense and efficiency opportunities
Credit outlook, particularly oil and gas
Organic loan growth and GE Capital acquisitions
Target capital levels
Financial targets
Wells Fargo 2016 Investor Day Financial Overview 15

–
Operating environment
Unemployment, GDP Growth and Slope of the Yield Curve (1) 1Q14 1Q16
-2.0%
-1.0%
0.0%
1.0%
2.0%
3.0%
4.0%
5.0%
6.0%
7.0%
1Q14 3Q14 1Q15 3Q15 1Q16
Slope of the Yield Curve Unemployment GDP
Continued period of low rates since our last Investor Day
25 bps increase in the Fed Funds rate in December 2015; first increase in 7 years
Long end of the curve has remained low
- 10 year treasury yield over the last 2
years:
• High: 2.66% (June 2014)
• Low: 1.63% (February 2016)
Slow, steady economic activity
Stable annual GDP growth:
- 2014: 2.4%; 2015: 2.4%
Continued improvement in unemployment:
- 5.0% in 1Q16, down from 6.6% in 1Q14
Expect continued annual GDP growth of 2% +/- and “lower for longer” interest rates
(1) Slope of the yield curve is the 10-year Treasury less the 3-month Treasury.
Financial Overview 16 Wells Fargo 2016 Investor Day

Regulatory environment has continued to evolve
Capital
Liquidity
Other
SLR
LCR
NSFR
Living Will
Volcker
GSIB
CCAR
TLAC
Fourth submission recently completed
Fed to address GSIB buffer in next CCAR cycle
Final rules released last year
WFC currently has 2.00% buffer
Not a constraint for WFC
7.6% as of 1Q16
Rules not yet issued at our 2014 Investor Day Presents NIM headwind
Final rules effective January 2015
Exceed requirement with an internal buffer
Not expected to be an issue due to balance sheet structure
Final rules expected in January 2018
Recently received feedback Must re-submit by October 1, 2016
Not a key issue due to small investment banking presence
Reporting requirements add expense
Wells Fargo 2016 Investor Day Financial Overview 17

Reducing non-core businesses and adjusting risk profile While we have continued to grow our balance sheet through organic growth and acquisitions, we have also been reducing non-core businesses and adjusting our risk profile
Wells Fargo 2016 Investor Day Financial Overview 18
Business Time Frame DescriptionWholesale 2010-2014 Exited non-strategic insurance locations/businesses, including
2014 sale of 40 offices WIM 2011 Sold HD VestCLG 2015 Sold remaining interest in RELS appraisal JV CLG 2015 Sold Government Guaranteed Student Loan portfolio CLG 2015 Sold auto Warranty Solutions business
Wholesale 2016 Sold RCIS crop insurance business
Business Time Frame DescriptionCLG 2009-2016 Discontinued legacy Pick-a-Pay loans; current balance less than
half of balance acquired from WachoviaWholesale 2009-2016 Executing run-off of legacy Wachovia commercial assetsWholesale 2010-2015
CLG 2011 Discontinued reverse mortgage originationsCLG 2011-2012 Shutdown Wells Fargo Financial subprime businessCLG 2014 Discontinued interest-only home equity product
Community Banking 2014 Discontinued Direct Deposit Advance product
Reduced Non-Core Businesses
Improved Risk Profile

Overview of 1Q16 GE Capital acquisitions Revenue
- Net Interest Income
• Added $18.3 billion of Commercial & Industrial loans and $6.6 billion of capital leases; weighted average yield of ~5.7%
• Remaining $2 billion of international loans are anticipated to close in 2H16
• Projecting ~$300 million of net interest income per quarter beginning in 2Q16
- Noninterest Income • Added $5.9 billion of operating leases (recorded in Other Assets)
• Revenue recognized in lease income (largely offset by operating lease expense)
Noninterest expense - Ongoing expenses
• Operating lease expense
• Personnel expense for the ~2,300 team members that have joined Wells Fargo, with another 700 expected to join
• Equipment, net occupancy and technology expenses associated with office locations and systems maintenance
• Efficiency ratio (1) of these acquisitions (excluding merger-related costs) expected to be in the high end of the corporate target range of 55%-59%
- Merger-related costs • Anticipate merger transition to take 2 years
• Costs include system transitions, BSA/AML analysis and non-systems transition costs
Provision expense - Net charge-offs on loans and capital leases
• Loans and leases were recorded at fair value at time of close, ~$0.9 billion net writedown
$1.4 billion of loans were purchased credit-impaired with $0.3 billion in non-accretable difference
- Reserve build for these acquisitions anticipated to start in 2Q16, resulting from both the accretion of the non-PCI portfolio, as well as the required build for new originations
(1) For more details on the Company’s efficiency ratio, please see slide 29.
Wells Fargo 2016 Investor Day Financial Overview 19
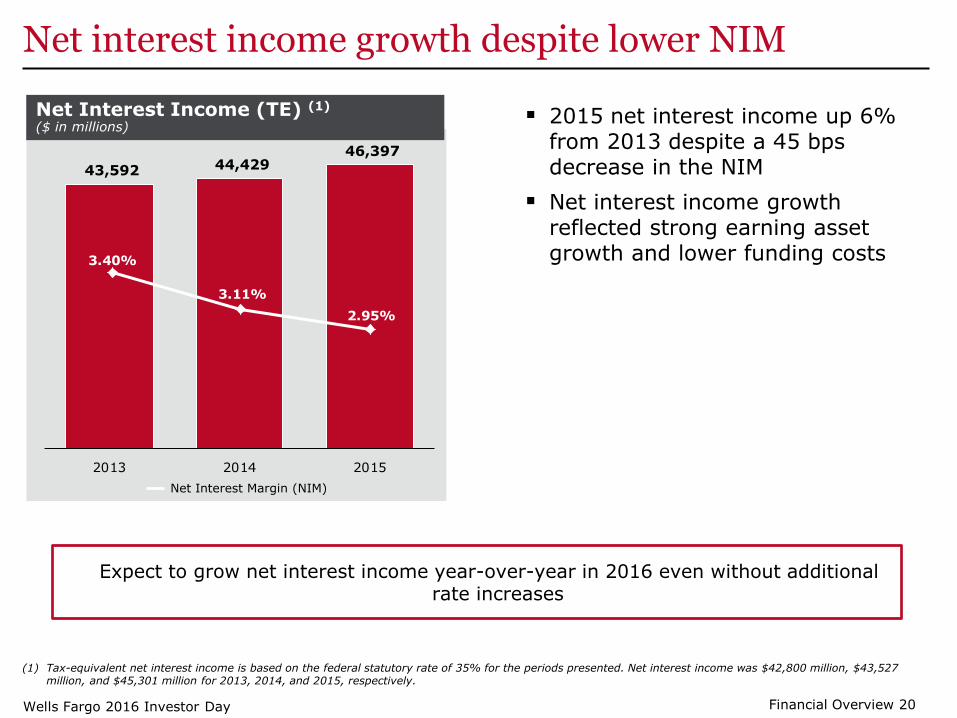
Net interest income growth despite lower NIM
43,592 44,429 46,397
2013 2014 2015
Net Interest Margin (NIM)
Net Interest Income (TE) (1)
($ in millions)
3.40%
3.11%
2.95%
2015 net interest income up 6% from 2013 despite a 45 bps decrease in the NIM
Net interest income growth reflected strong earning asset growth and lower funding costs
Expect to grow net interest income year-over-year in 2016 even without additional rate increases
(1) Tax-equivalent net interest income is based on the federal statutory rate of 35% for the periods presented. Net interest income was $42,800 million, $43,527 million, and $45,301 million for 2013, 2014, and 2015, respectively.
Financial Overview 20 Wells Fargo 2016 Investor Day

Diversity of noninterest income has driven stability
13,430 14,280 14,468
8,774 6,381 6,501
8,214 8,481 8,888
10,562 11,678 10,899
$40,980 $40,820 $40,756
2013 2014 2015
All Other Fee
Income
Deposit Charges
and Card Fees
Total Mortgage
Banking
Total Trust &
Investment Fees
Noninterest Income ($ in millions)
Diversified sources of noninterest income
- Trust and investment fees were 35% of total noninterest income in 2015, up from 33% in 2013
- Mortgage banking fee income as a percent of total noninterest income declined to 16% in 2015 from 21% in 2013
- Customer-driven fee categories such as card fees and deposit service charges have continued to grow as we grow our customer base
Trust and investment fees influenced by market conditions and customer growth
Expect mortgage banking fee income to grow modestly, based on market size
Card fees and deposit service charges expected to grow in line with customer growth and usage
Financial Overview 21 Wells Fargo 2016 Investor Day

Expenses up modestly while continuing to invest in the business
Efficiency ratio (2) stable over the last three years (58.3% in 2013, 58.1% in 2014, 58.1% in 2015)
Noninterest Expense ($ in millions)
20,185 19,972 20,329
9,951 9,970 10,352
821 1,249 1,871
17,885 17,846 17,422
$48,842 $49,037 $49,974
2013 2014 2015
All Other
Operating Losses
Commission and
Incentive
Compensation
Salaries &
Employee
Benefits
(1)
Noninterest expense up modestly from 2013 as expense savings were offset by investments in the business and higher operating losses
- Salaries and employee benefits stable
- Commission and incentive compensation up, but generally tied to revenue growth
- All other (1) expenses down
Positive operating leverage every year 2013-2015
(1) All other expense is total noninterest expense minus operating losses, salaries, employee benefits, commission and incentive compensation. (2) Efficiency ratio defined as noninterest expense divided by total revenue (net interest income plus noninterest income). Noninterest expense and our efficiency
ratio may be affected by a variety of factors, including business and economic cyclicality, seasonality, changes in our business composition and operating environment, growth in our business and/or acquisitions, and unexpected expenses relating to, among other things, litigation and regulatory matters.
Wells Fargo 2016 Investor Day Financial Overview 22

Efficiency improvements fund reinvestment in the business We remain focused on reducing expenses while maintaining a high level of customer service and continuing to invest in the business
Efficiencies Achieved
Investing for the Future
Travel and entertainment expense down 22% in 2015 compared with 2013
Transition to paperless operations has reduced transportation and operational costs
Workforce location optimization has resulted in $500 million cost savings annually
Residential mortgage servicing FTEs down 17% since 4Q14
Occupancy expense benefitted from a 21 million square foot reduction in space since 2009
Continual refreshing of stores and ATMs, and improved digital capabilities
Customer experience (e.g., improved credit card rewards program and online/mobile residential mortgage originations platform)
Technology, including continued investment in industry-leading Treasury Management platform
Safety and security, including improved authentication procedures
Risk and compliance, including cybersecurity; Corporate Risk FTEs up 43% from 2013 to 2015
Customer experience Risk, compliance and reputation
Digital and innovation
Wells Fargo 2016 Investor Day Financial Overview 23
-
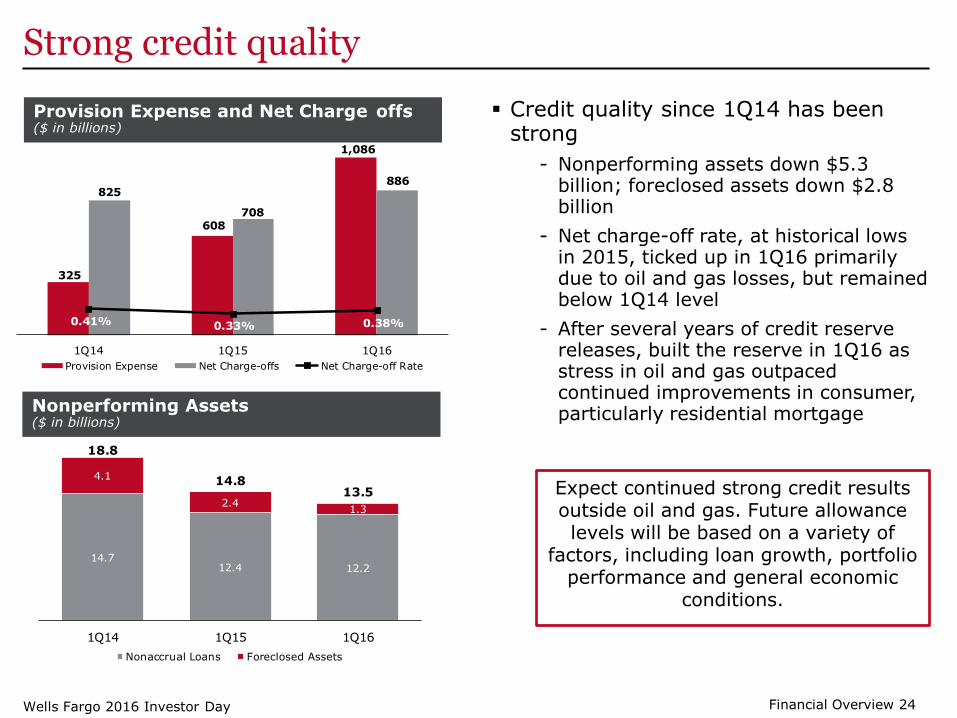
Strong credit quality
Provision Expense and Net Charge offs ($ in billions)
Nonperforming Assets ($ in billions)
325
608
1,086
825
708
886
0.41% 0.33% 0.38%
1Q14 1Q15 1Q16
Provision Expense Net Charge-offs Net Charge-off Rate
Credit quality since 1Q14 has been strong
- Nonperforming assets down $5.3 billion; foreclosed assets down $2.8 billion
- Net charge-off rate, at historical lows in 2015, ticked up in 1Q16 primarily due to oil and gas losses, but remained below 1Q14 level
- After several years of credit reserve releases, built the reserve in 1Q16 as stress in oil and gas outpaced continued improvements in consumer, particularly residential mortgage
14.712.4 12.2
4.1
2.41.3
18.8
14.813.5
1Q14 1Q15 1Q16
Nonaccrual Loans Foreclosed Assets
Expect continued strong credit results outside oil and gas. Future allowance levels will be based on a variety of
factors, including loan growth, portfolio performance and general economic
conditions.
Financial Overview 24 Wells Fargo 2016 Investor Day

Outstanding
55%
1%
6%
6%
8%
3%
21%
Oil and gas loan portfolio as of 1Q16
$17.8 billion of Oil and Gas Loans (1)
Field Service
Contract Drilling
Natural Gas Pipeline
Extraction
Oil & Gas Pipeline
Wholesalers
Refining
Exploration and Production (E&P) Midstream Services
Expect continued stress in the oil and gas portfolio in 2016. More credit losses will be realized and there is the potential for
additional reserve builds.
As of March 31, 2016, unless noted. (1) Industry classifications based on NAICS classifications. (2) Exposure = Loans outstanding + unfunded commitments.
Disclosed at 1Q16 Earnings:
Outstandings up $474 million in 1Q16, or 3%, from 4Q15 on drawn lines and the acquisition of $236 million in loans from GE Capital
- Outstandings include $819 million second lien and $374 million of mezzanine loans
Total oil and gas exposure (1)(2) of $40.7 billion as of 1Q16, down $1.3 billion, or 3%, from 4Q15 reflecting declines across all 3 sectors from reductions to existing credit facilities and net charge-offs
~22%, or $8.8 billion, of exposure to investment grade companies (3)
- ~34% of unfunded commitments are to investment grade companies
Update:
Have now completed 46% of spring borrowing base redeterminations in E&P (4)
- 66% of loans had a line decrease
- 23% were unchanged
- 11% had a line increase
(3) Publicly rated investment grade rating from at least one of the debt rating agencies, as of 3/31/16. (4) Data as of May 6, 2016.
Financial Overview 25 Wells Fargo 2016 Investor Day

-
Capital has remained strong even as we have grown assets
Common Equity Tier 1 Ratio (Fully Phased In) (1)
10.5% 10.6% 10.6%10.8%
10.6%
1Q15 2Q15 3Q15 4Q15 1Q16
Capital has remained strong even as we have grown the balance sheet and returned more capital to shareholders
- Assets up 17% from year-end 2013 to year-end 2015
- Returned over $25 billion of capital on a net basis (2) 2014 – 2015
- Recently increased common stock dividend rate to $0.38 per share from $0.375, payable June 1, 2016
Common Equity Tier 1 ratio well above the regulatory minimum and buffers and our internal buffer
- Common Equity Tier 1 ratio (fully phased-in) of 10.6% at 3/31/16 (1)
- Above our 10.0% internal target even after redeploying capital in 1Q16 for the addition of assets acquired from GE Capital
(1) Capital ratios are calculated assuming the full phase-in of the Basel III capital rules. See page 33 for additional information regarding capital ratios. (2) Net payout means common stock dividends and share repurchases less issuances and stock compensation-related items.
Wells Fargo 2016 Investor Day Financial Overview 26

Target update: Return on Assets (ROA)
Full Year ROA target: 1.10% - 1.40%; consistent with recent performance
ROA Since 2014 Investor Day versus 2014 and 2016 Targets
2014 Target Range 1.30%-1.60%
2016 Target Range 1.10%-1.40%
2Q14 3Q14 4Q14 1Q15 2Q15 3Q15 4Q15 1Q16
ROA Considerations
ROA has migrated downward since 2Q14 due to continued low rates, higher levels of liquidity (LCR), tighter lending spreads and higher provision expense
.Represents target range set at 2014 Investor Day. Represents target range set at 2016 Investor Day.
Wells Fargo 2016 Investor Day Financial Overview 27

2Q14 3Q14 4Q14 1Q15 2Q15 3Q15 4Q15 1Q16
Target update: Return on Equity (ROE)
Full Year ROE target: 11% - 14%; consistent with recent performance
ROE since 2014 Investor Day versus 2014 and 2016 Targets
2014 Target Range 12%-15%
2016 Target Range 11%-14%
ROE Considerations
ROE has migrated downward since 2Q14 due to continued low rates, higher liquidity, compressed lending spreads and higher provision expense
Represents target range set at 2014 Investor Day. Represents target range set at 2016 Investor Day.
Wells Fargo 2016 Investor Day Financial Overview 28
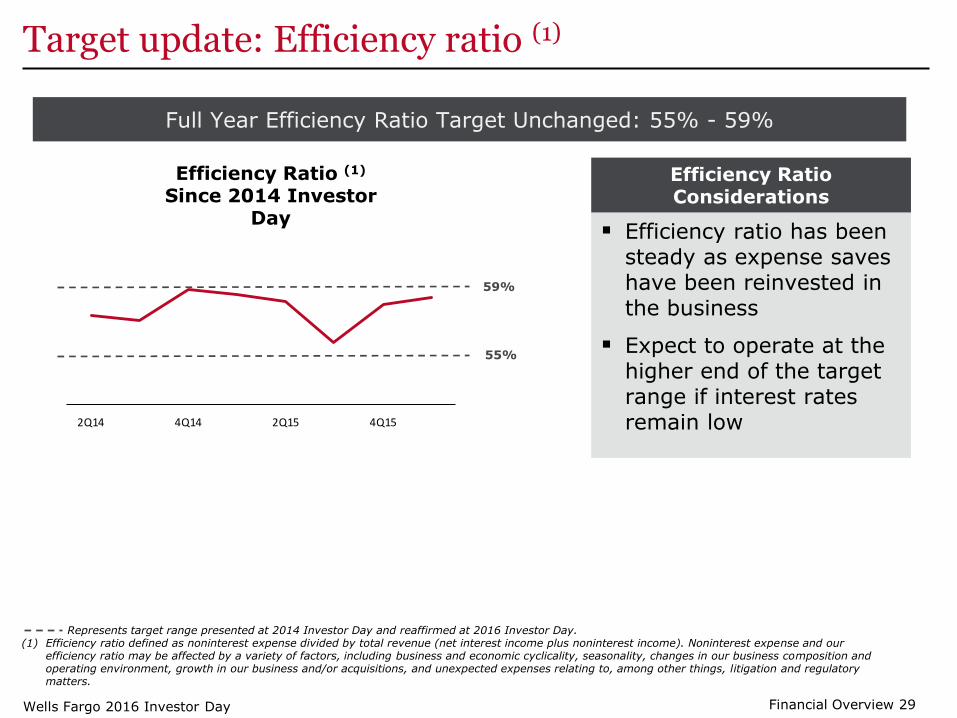
Target update: Efficiency ratio (1)
Full Year Efficiency Ratio Target Unchanged: 55% - 59%
Efficiency Ratio (1)
Since 2014 Investor
2Q14 4Q14 2Q15 4Q15
Day
Efficiency Ratio Considerations
Efficiency ratio has been steady as expense saves
59% have been reinvested in the business
55% Expect to operate at the higher end of the target range if interest rates remain low
Represents target range presented at 2014 Investor Day and reaffirmed at 2016 Investor Day. (1) Efficiency ratio defined as noninterest expense divided by total revenue (net interest income plus noninterest income). Noninterest expense and our
efficiency ratio may be affected by a variety of factors, including business and economic cyclicality, seasonality, changes in our business composition and operating environment, growth in our business and/or acquisitions, and unexpected expenses relating to, among other things, litigation and regulatory matters.
Wells Fargo 2016 Investor Day Financial Overview 29

Target update: Net payout ratio (1)
Full Year Net Payout Ratio Target Unchanged: 55% - 75%
Net Payout Ratio (1) and Dividend Payout Ratio (2)
2013-2015 75%
Net Payout Ratio Considerations
34%
57% 59%
29%32%
35%
2013 2014 2015
Net Payout Ratio Dividend Payout Ratio
55%
Strong organic capital generation and stable ROE support capital return
Returning capital remains a priority
Represents target ranges presented at 2014 Investor Day and reaffirmed at 2016 Investor Day.
(1) Net payout ratio means the ratio of (i) common stock dividends and share repurchases less issuances and stock compensation-related items, divided by (ii) net income applicable to common stock. Dividends and share repurchases are subject to Wells Fargo board and regulatory approvals, and other considerations. Share issuances may vary based on business and market conditions, as well as other factors.
(2) Dividend payout ratio means the ratio of (1) common stock dividends, divided by (ii) net income applicable to common stock.
Wells Fargo 2016 Investor Day Financial Overview 30

Performance targets remain at industry leading levels
55.2%
58.7%60.5%
61.4%62.2%
75.9%
USB WFC JPM C PNC BAC
1Q16 ROA versus Peers (Source: SNL)
1Q16 ROE versus Peers (Source: Company reports)
1Q16 Net Payout Ratio versus Peers (Source: Company reports)
1Q16 Efficiency Ratio versus Peers (Source: SNL)
1.32%
1.21%
1.07%
0.93%
0.79%
0.50%
USB WFC PNC JPM C BAC
13.0%
11.8%
9.0%8.4%
6.4%
3.8%
USB WFC JPM PNC C BAC
81%
74%
60% 60%
42%
35%
PNC USB WFC JPM C BAC
Represents target ranges set at 2016 Investor Day.
Wells Fargo 2016 Investor Day Financial Overview 31

Summary
Solid performance since last Investor Day
- Continued to grow loans and deposits, which are the building blocks of long-term growth
- Strong liquidity and capital allowed us to take advantage of acquisition opportunities
- Returned more capital to shareholders
- Maintained risk discipline
Unique positioning versus regional and large bank peers
Diversified business model allows us to perform consistently over the cycle
Performance targets remain at industry-leading levels
Wells Fargo 2016 Investor Day Financial Overview 32

Common Equity Tier 1 (Fully phased-in)
- 1 -
Wells Fargo 2016 Investor Day Financial Overview 33
Wells Fargo & Company and Subsidiaries COMMON EQUITY TIER 1 UNDER BASEL III (FULLY PHASED-IN) (1)
(in billions) Mar 31,
2016 Dec 31,
2015 Sep 30,
2015 Jun 30,
2015 Mar 31,
2015 Total equity $ 198.5 193.9 194.0 190.7 190.0
Noncontrolling interests (1.0 ) (0.9) (0.9 ) (1.1 ) (1.2)
Total Wells Fargo stockholders’ equity 197.5 193.0 193.1 189.6 188.8
Adjustments:
Preferred stock (22.0 ) (21.0) (21.0 ) (20.0 ) (20.0)
Goodwill and other intangible assets (2) (30.9 ) (28.7) (28.7 ) (29.1 ) (28.9)
Investment in certain subsidiaries and other (1.9 ) (0.9) (1.6 ) (0.6 ) (0.9)
Common Equity Tier 1 (Fully Phased-In) under Basel III (1) (A) 142.7 142.4 141.8 139.9 139.0
Total risk-weighted assets (RWAs) anticipated under Basel III (3) (B) $ 1,345.1 1,321.7 1,331.8 1,325.6 1,326.3
Common Equity Tier 1 to total RWAs anticipated under Basel III (Fully Phased-In) (A)/(B) 10.6 % 10.8 10.6 10.6 10.5
(1) Basel III capital rules, adopted by the Federal Reserve Board on July 2, 2013, revised the definition of capital, increased minimum capital ratios, and introduced a minimum Common Equity Tier 1 (CET1) ratio. These rules established a new comprehensive capital framework for U.S. banking organizations that implements the Basel III capital framework and certain provisions of the Dodd-Frank Act. The rules are being phased in through the end of 2021. Fully phased-in capital amounts, ratios and RWAs are calculated assuming the full phase-in of the Basel III capital rules. Fully phased-in regulatory capital amounts, ratios and RWAs are considered non-GAAP financial measures that are used by management, bank regulatory agencies, investors and analysts to assess and monitor the Company’s capital position. We have included this non-GAAP financial information, and the corresponding reconciliation to total equity, because of current interest in such information on the part of market participants.
(2) Goodwill and other intangible assets are net of any associated deferred tax liabilities. (3) The final Basel III capital rules provide for two capital frameworks: the Standardized Approach, which replaced Basel I, and the Advanced Approach applicable to certain
institutions. Under the final rules, we are subject to the lower of our CET1 ratio calculated under the Standardized Approach and under the Advanced Approach in the assessment of our capital adequacy. The capital ratio for March 31, 2016, December 31, 2015, September 30, 2015, and June 30, 2015, was calculated under the Basel III Standardized Approach RWAs, and the capital ratio for March 31, 2015 was calculated under the Basel III Advanced Approach RWAs.

Biography

John Shrewsberry Senior EVP, Chief Financial Officer
Senior Executive Vice President John Shrewsberry is the chief financial officer responsible for Wells Fargo’s financial management functions including accounting and control, financial planning and analysis, line of business finance functions, asset-liability management, treasury, tax management, investor relations, and the company’s investment portfolios. John is also responsible for Wells Fargo’s corporate development, information technology, corporate properties and security, corporate strategy, and enterprise expense and efficiency functions. John serves on the Wells Fargo Operating, Management, and Market Risk Committees and is based in San Francisco.
A 22-year veteran of banking and investing, John served as head of Wells Fargo Securities from 2006 through May 2014, where he was responsible for investment banking, capital markets, institutional fixed income, equity, derivatives sales and trading, investment research, and a credit-intensive principal investment portfolio. From 2001 through 2005, he was the group head of Wells Fargo Commercial Capital, the successor to a commercial finance company he co-founded that became part of Wells Fargo in 2001. Previously, John worked at Goldman Sachs and Credit Suisse First Boston in the principal finance areas. He started his career as a Certified Public Accountant at Coopers & Lybrand.
John earned his B.A. in economics from Claremont McKenna College, in Claremont, CA, and an MBA from the Yale School of Management.
John currently serves on the board for the Committee on Capital Markets Regulation. Committed to serving the communities around him, John also serves on the boards of the Robert Day School of Economics and Finance, the Yale School of Management, the Yale Corporation Investment Committee and is active with the Juvenile Diabetes Research Foundation.
Wells Fargo 2016 Investor Day Financial Overview 35


