News Release | January 14, 2020 Wells Fargo Reports Fourth Quarter 2019 Net Income of $2.9 Billion Diluted EPS of $0.60 included the impact of litigation accruals of $(0.33) per share Fourth quarter 2019 financial results: Net income of $2.9 billion and diluted earnings per share (EPS) of $0.60 • Operating losses of $1.9 billion, driven by $1.5 billion, or ($0.33) per share, of litigation accruals for a variety of matters, including previously disclosed retail sales practices matters; a majority of the litigation accruals was not tax deductible Revenue of $19.9 billion, down from $21.0 billion in fourth quarter 2018 • Net interest income of $11.2 billion, down $1.4 billion • Noninterest income of $8.7 billion, up $324 million Noninterest expense of $15.6 billion, up $2.3 billion primarily due to higher operating losses Average loans of $956.5 billion, up $10.2 billion, or 1% Average deposits of $1.3 trillion, up $53.0 billion, or 4% Credit quality: • Provision expense of $644 million, up $123 million from fourth quarter 2018 Net charge-offs of $769 million, up $48 million Net charge-offs of 0.32% of average loans (annualized), up from 0.30% Reserve release 1 of $125 million, compared with a $200 million release in fourth quarter 2018 • Nonaccrual loans of $5.3 billion, down $1.2 billion, or 18% Strong capital position while returning more capital to shareholders: • Common Equity Tier 1 ratio of 11.1% 2 • Returned $9.0 billion to shareholders in fourth quarter 2019 through common stock dividends and net share repurchases, up from $8.8 billion in fourth quarter 2018 Quarterly common stock dividend of $0.51 per share, up 19% from $0.43 per share Period-end common shares outstanding down 446.8 million shares, or 10% Full year 2019 financial results: Net income of $19.5 billion and diluted earnings per share (EPS) of $4.05 Return on assets (ROA) of 1.02%, return on equity (ROE) of 10.23%, and return on average tangible common equity (ROTCE) of 12.20% 3 Financial results reported in this document are preliminary. Final financial results and other disclosures will be reported in our Annual Report on Form 10-K for the year ended December 31, 2019, and may differ materially from the results and disclosures in this document due to, among other things, the completion of final review procedures, the occurrence of subsequent events, or the discovery of additional information. 1 Reserve build represents the amount by which the provision for credit losses exceeds net charge-offs, while reserve release represents the amount by which net charge-offs exceed the provision for credit losses. 2 See table on page 37 for more information on Common Equity Tier 1. Common Equity Tier 1 is a preliminary estimate. 3 Tangible common equity and return on average tangible common equity are non-GAAP financial measures. For additional information, including a corresponding reconciliation to GAAP financial measures, see the “Tangible Common Equity” tables on page 36.
Transcript
News Release | January 14, 2020
Wells Fargo Reports Fourth Quarter 2019 Net Income of $2.9 Billion Diluted EPS of $0.60 included the impact of litigation accruals of $(0.33) per share
Fourth quarter 2019 financial results:
Net income of $2.9 billion and diluted earnings per share (EPS) of $0.60
• Operating losses of $1.9 billion, driven by $1.5 billion, or ($0.33) per share, of litigation accruals for avariety of matters, including previously disclosed retail sales practices matters; a majority of thelitigation accruals was not tax deductible
Revenue of $19.9 billion, down from $21.0 billion in fourth quarter 2018
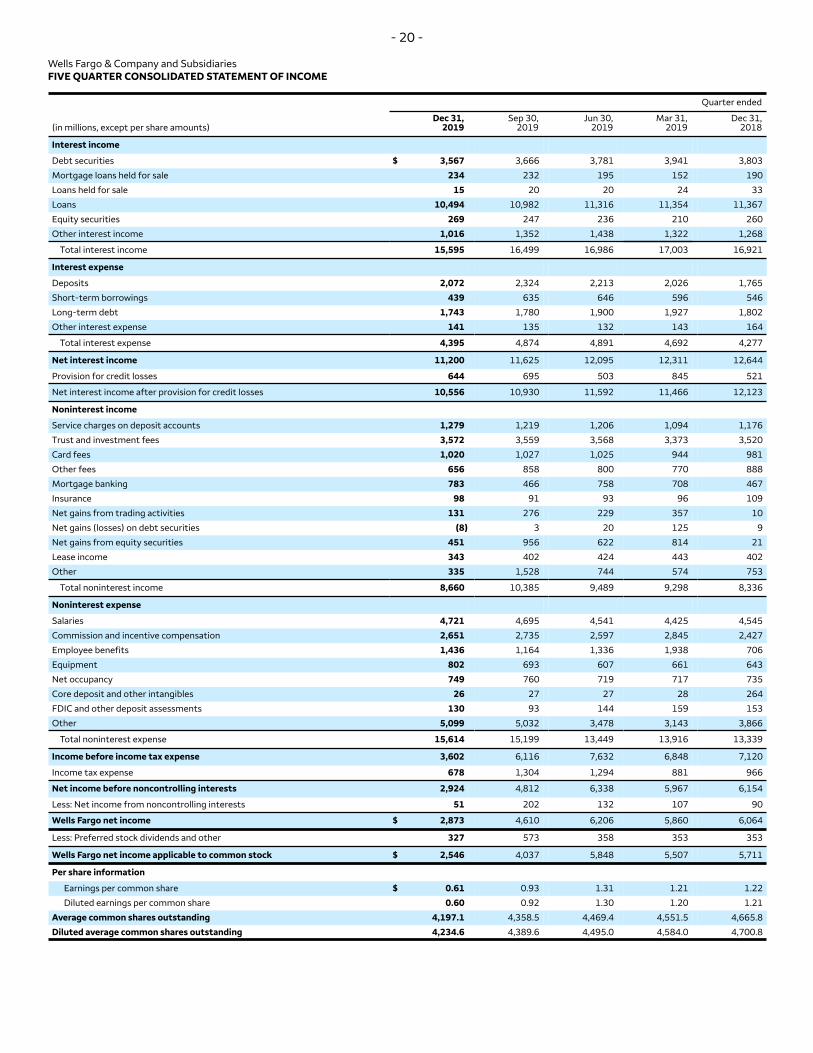
• Net interest income of $11.2 billion, down $1.4 billion
• Noninterest income of $8.7 billion, up $324 million
Noninterest expense of $15.6 billion, up $2.3 billion primarily due to higher operating losses
Average loans of $956.5 billion, up $10.2 billion, or 1%
Average deposits of $1.3 trillion, up $53.0 billion, or 4%
Credit quality:
• Provision expense of $644 million, up $123 million from fourth quarter 2018
Net charge-offs of $769 million, up $48 million
Net charge-offs of 0.32% of average loans (annualized), up from 0.30%
Reserve release1 of $125 million, compared with a $200 million release in fourth quarter 2018
• Nonaccrual loans of $5.3 billion, down $1.2 billion, or 18%
Strong capital position while returning more capital to shareholders:
• Common Equity Tier 1 ratio of 11.1%2
• Returned $9.0 billion to shareholders in fourth quarter 2019 through common stock dividends and netshare repurchases, up from $8.8 billion in fourth quarter 2018
Quarterly common stock dividend of $0.51 per share, up 19% from $0.43 per share
Period-end common shares outstanding down 446.8 million shares, or 10%
Full year 2019 financial results:
Net income of $19.5 billion and diluted earnings per share (EPS) of $4.05
Return on assets (ROA) of 1.02%, return on equity (ROE) of 10.23%, and return on average tangible common equity (ROTCE) of 12.20%3
Financial results reported in this document are preliminary. Final f inancial results and other disclosures will be reported in our Annual Report on Form 10-K for the year ended December 31, 2019, and may differ materially from the results and disclosures in this document due to, among other things, the completion of f inal review procedures, the occurrence of subsequent events, or the discovery of additional information.
1 Reserve build represents the amount by which the provision for credit losses exceeds net charge-offs, while reserve release represents the amount by which net charge-offs exceed the provision for credit losses.
2 See table on page 37 for more information on Common Equity Tier 1. Common Equity Tier 1 is a preliminary estimate. 3 Tangible common equity and return on average tangible common equity are non-GAAP financial measures. For additional information, including
a corresponding reconciliation to GAAP financial measures, see the “Tangible Common Equity” tables on page 36.
- 2 -
Selected Financial Information
Dec 31, 2019
Quarter ended
Sep 30, Dec 31, 2019 2018
Year ended Dec. 31,
2019 2018
Earnings
Diluted earnings per common share $ 0.60 0.92 1.21 4.05 4.28
Wells Fargo net income (in billions) 2.87 4.61 6.06 19.55 22.39
Return on assets (ROA) 0.59% 0.95 1.28 1.02 1.19
Return on equity (ROE) 5.91 9.00 12.89 10.23 11.53
Return on average tangible common equity (ROTCE) 7.08 10.70 15.39 12.20 13.73
Asset Quality
Net charge-offs (annualized) as a % of average total loans 0.32% 0.27 0.30 0.29 0.29
Allowance for credit losses as a % of total loans 1.09 1.11 1.12 1.09 1.12
Allowance for credit losses as a % of annualized net charge-offs 343 415 374 379 390
Other
Revenue (in billions) $ 19.9 22.0 21.0 85.1 86.4
Efficiency ratio (b) 78.6% 69.1 63.6 68.4 65.0
Average loans (in billions) $ 956.5 949.8 946.3 951.0 945.2
Average deposits (in billions) 1,321.9 1,291.4 1,268.9 1,286.3 1,275.9
Net interest margin 2.53% 2.66 2.94 2.73 2.91
(a) Tangible common equity and return on average tangible common equity are non-GAAP financial measures. For additional information, including a corresponding reconciliation to GAAP financial measures, see the “Tangible Common Equity” tables on page 36.
(b) The efficiency ratio is noninterest expense divided by total revenue (net interest income and noninterest income).
SAN FRANCISCO – January 14, 2020 – Wells Fargo & Company (NYSE:WFC) reported net income of $2.9 billion, or
$0.60 per diluted common share, for fourth quarter 2019, compared with $6.1 billion, or $1.21 per share, for fourth
quarter 2018, and $4.6 billion, or $0.92 per share, for third quarter 2019.
Chief Executive Officer and President Charlie Scharf said, “Wells Fargo is a wonderful and important franchise that
has made some serious mistakes, and my mandate is to make the fundamental changes necessary to regain the full
trust and respect of all stakeholders.”
“During my first three months at Wells Fargo my primary focus has been on advancing our required regulatory work
with a different sense of urgency and resolve, while beginning to develop a path to improve our financial results. This
work is necessary to build the appropriate foundation for us to move forward. Wells Fargo plays an important role for
our country, and we know that ultimately our actions and results will dictate when that trust is fully regained. And
while the work is substantial, I am confident that with the appropriate prioritization of resources, processes, and
management attention, we can accomplish what is expected of us," Mr. Scharf added.
"In addition, even in my short time at the company, it is clear that our opportunities to improve our performance are
substantial when we finish this work. Our cost structure is too high, and I believe there are many areas where we will
be able to increase our rate of growth. While it is too early to put time frames around these goals, we will be diligent
in pursuing them and I am confident the opportunities are meaningful,” Mr. Scharf concluded.
Chief Financial Officer John Shrewsberry said, “Wells Fargo reported $2.9 billion of net income in the fourth quarter
and diluted earnings per share of $0.60, which included the impact of $1.5 billion, or $(0.33) per share, of litigation
accruals for a variety of matters, including previously disclosed retail sales practices matters. Our net interest income
declined in the fourth quarter driven predominantly by the impact of the lower interest rate environment. In
addition, while we are spending what is necessary in order to improve risk management, our other expenses were too
- 3 -
high and becoming more efficient remains a top priority. However, we continued to have positive business trends
with both loans and deposits growing from the third quarter and a year ago. We also saw increases from the third
quarter and a year ago in primary consumer checking customers, debit and credit card usage, Wealth and Investment
Management total client assets, and Investment Banking market share. Our net charge-off rate remained near
historic lows, and our capital levels were strong even as we returned $9 billion to shareholders through common
stock dividends and net share repurchases in the fourth quarter, reducing common shares outstanding by 10%
compared with a year ago.”
Net Interest Income
Net interest income in the fourth quarter was $11.2 billion, down $425 million from third quarter 2019,
predominantly due to balance sheet repricing driven by the impact of the lower interest rate environment,
amortization, partially offset by the benefit of balance sheet growth.
The net interest margin was 2.53%, down 13 basis points from the prior quarter predominantly due to balance sheet
repricing driven by the impact of the lower interest rate environment, unfavorable hedge ineffectiveness accounting
results, and higher MBS premium amortization.
Noninterest Income
Noninterest income in the fourth quarter was $8.7 billion, down $1.7 billion from third quarter 2019. Fourth quarter
noninterest income included lower other income, market sensitive revenue4, and other fees, partially offset by higher
mortgage banking income and service charges on deposit accounts.
• Other fees were $656 million, down $202 million compared with third quarter 2019, primarily due to lower
commercial real estate brokerage commissions as a result of the sale of our commercial real estate brokerage
business, Eastdil Secured (Eastdil), on October 1, 2019.
• Mortgage banking income was $783 million, up from $466 million in third quarter 2019. Net mortgage servicing
income was $23 million, up from a loss of $142 million in the third quarter which included a residential mortgage
servicing rights asset valuation adjustment reflecting the impact of higher prepayment rates. Net gains on
mortgage loan origination and sales activities were $760 million, up from $608 million in the third quarter,
primarily due to an increase in residential held-for-sale mortgage loan originations to $42 billion from $38 billion
in the third quarter and higher gains associated with exercising servicer cleanup calls in the fourth quarter. The
production margin on residential held-for-sale mortgage loan originations5 was 1.21%, flat compared with the
third quarter.
• Market sensitive revenue4 was $574 million, down from $1.2 billion in third quarter 2019, predominantly due to
lower net gains from equity securities from our affiliated venture capital and private equity partnerships, and
lower net gains from trading activities. Fourth quarter 2019 net gains from equity securities included
$236 million from deferred compensation plan investment results (largely offset by employee benefits
expense).
4 Market sensitive revenue represents net gains from trading activities, debt securities, and equity securities. 5 Production margin represents net gains on residential mortgage loan origination/sales activities divided by total residential held-for-sale
mortgage originations. See the “Selected Five Quarter Residential Mortgage Production Data” table on page 42 for more information.
- 4 -
• Other income was $335 million, down $1.2 billion from the prior quarter. Third quarter 2019 included a
$1.1 billion gain from the sale of our Institutional Retirement and Trust (IRT) business. Fourth quarter 2019
included a $362 million gain from the sale of Eastdil.
Noninterest Expense
Noninterest expense in the fourth quarter was $15.6 billion, up $415 million from the prior quarter. Fourth quarter
noninterest expense included higher employee benefits expense driven by $263 million of deferred compensation
expense (largely offset by net gains from equity securities) and higher equipment expense driven by higher
capitalized software impairment expense, and higher computer software licensing and maintenance costs.
Additionally, operating losses of $1.9 billion in fourth quarter 2019 were flat compared with third quarter 2019, and
included $1.5 billion of litigation accruals in the fourth quarter for a variety of matters, including previously disclosed
retail sales practices matters.
Income Taxes
The Company’s effective income tax rate was 19.1% for fourth quarter 2019 and included net discrete income tax
expense of $303 million predominantly related to the non-tax deductible treatment of certain litigation accruals.
The effective income tax rate in third quarter 2019 was 22.1% and included net discrete income tax expense of
$443 million predominantly related to the non-tax deductible treatment of a litigation accrual. The Company's full
year 2019 effective income tax rate was 17.5% (15.7% before discrete items).
Loans
Average loans were $956.5 billion in the fourth quarter, up $6.8 billion from the third quarter. Period-end loan
balances were $962.3 billion at December 31, 2019, up $7.4 billion from September 30, 2019. Commercial loans
were up $3.4 billion compared with September 30, 2019, predominantly due to $3.3 billion of growth in commercial
and industrial loans. Consumer loans increased $4.0 billion from the prior quarter, reflecting the following:
• Real estate 1-4 family first mortgage loans increased $3.2 billion, as $17.8 billion of held-for-investment
mortgage loan originations and the purchase of $2.3 billion of loans as a result of exercising servicer cleanup calls
were partially offset by paydowns
• Real estate 1-4 family junior lien mortgage loans decreased $1.3 billion, as paydowns continued to exceed
originations
• Credit card loans increased $1.4 billion, primarily due to seasonality
• Automobile loans increased $1.1 billion, driven by $6.8 billion of originations
Period-End Loan Balances
(in millions) Dec 31,
2019 Sep 30,
2019 Jun 30,
2019 Mar 31,
2019 Dec 31,
2018
Consumer 446,546 442,583 437,633 436,023 439,705
Change from prior quarter $ 7,350 5,037 1,629 (4,861) 10,810
The allowance for credit losses, including the allowance for unfunded commitments, totaled $10.5 billion at
December 31, 2019, down $157 million from September 30, 2019, and included a $125 million reserve release1 in
fourth quarter 2019, primarily due to improved credit performance in the consumer loan portfolio and a higher
probability of slightly more favorable economic conditions. The allowance coverage for total loans was 1.09%,
compared with 1.11% in third quarter 2019. The allowance covered 3.4 times annualized fourth quarter net charge-
offs, compared with 4.1 times in the prior quarter. The allowance coverage for nonaccrual loans was 196% at
December 31, 2019, compared with 191% at September 30, 2019.
- 8 -
Business Segment Performance Wells Fargo defines its operating segments by product type and customer segment. Segment net income for each of the three business segments was:
Quarter ended
(in millions) Dec 31,
2019 Sep 30,
2019 Dec 31,
2018
Community Banking
Wholesale Banking
Wealth and Investment Management
$ 429
2,493 254
999
2,644
1,280
3,169
2,671
689
Community Banking offers a complete line of diversif ied f inancial products and services for consumers and small businesses including checking and savings accounts, credit and debit cards, and automobile, student, mortgage, home equity and small business lending, as well as referrals to Wholesale Banking and Wealth and Investment Management business partners. The Community Banking segment also includes the results of our Corporate Treasury activities net of allocations (including funds transfer pricing, capital, liquidity and certain corporate expenses) in support of the other operating segments and results of investments in our aff iliated venture capital and private equity partnerships.
Selected Financial Information
Quarter ended
(in millions) Dec 31,
2019 Sep 30,
2019 Dec 31,
2018
Total revenue
Provision for credit losses
$ 10,522
522
11,239
608
11,461
534
Noninterest expense
Segment net income
9,029 429
8,766
999
7,032
3,169
(in billions)
Average loans
Average assets
Average deposits
462.5 1,039.3
794.6
459.0
1,033.9
789.7
459.7
1,015.9
759.4
Fourth Quarter 2019 vs. Third Quarter 2019
• Net income of $429 million, down $570 million, or 57%
• Revenue of $10.5 billion, down $717 million, or 6%, driven by lower net interest income, net gains from equity securities, and gains from the sale of purchased credit-impaired (PCI) residential mortgage loans, partially offset by higher mortgage banking income
• Noninterest expense of $9.0 billion increased $263 million, or 3%, predominantly driven by higher personnel expense
• Provision for credit losses decreased $86 million, reflecting a reserve release1 in fourth quarter 2019, compared with a reserve build1 in third quarter 2019, partially offset by seasonally higher net charge-offs mostly in the credit card and automobile portfolios
Fourth Quarter 2019 vs. Fourth Quarter 2018
• Net income down $2.7 billion, or 86%
• Revenue down $939 million, or 8%, driven by lower net interest income and gains from the sale of PCI residential mortgage loans, partially offset by higher mortgage banking income, net gains from equity securities, and service charges on deposit accounts
• Noninterest expense increased $2.0 billion, or 28%, predominantly due to higher operating losses reflecting litigation accruals for a variety of matters, as well as higher personnel expense, partially offset by lower other expense and core deposit and other intangibles amortization expense
- 9 -
Business Metrics and Highlights
• Primary consumer checking customers7,8 of 24.4 million, up 2.0% from a year ago
• Branch customer experience surveys completed during fourth quarter 2019 reflected higher year-over-year scores for both ‘Customer Loyalty’ and ‘Overall Satisfaction with Most Recent Visit’
• Debit card point-of-sale purchase volume9 of $95.2 billion in the fourth quarter, up 6% year-over-year
• General purpose credit card point-of-sale purchase volume of $21.0 billion in the fourth quarter, up 4% year-over-year
• 30.3 million digital (online and mobile) active customers, including 24.4 million mobile active customers8,10
• 5,352 retail bank branches as of the end of fourth quarter 2019, reflecting 174 branch consolidations in 2019
• Home Lending
Originations of $60 billion, up from $58 billion in the prior quarter, driven by lower mortgage loan interest rates
Originations of loans held-for-sale and loans held-for-investment were $42 billion and $18 billion, respectively
Production margin on residential held-for-sale mortgage loan originations5 of 1.21%, flat compared with the prior quarter
Applications of $72 billion, down from $85 billion in the prior quarter, driven primarily by seasonality
Unclosed application pipeline of $33 billion at quarter end, down from $44 billion in the prior quarter, driven primarily by seasonality
• Automobile originations of $6.8 billion in the fourth quarter, up 45% from the prior year, reflecting our renewed emphasis on growing auto loans following the restructuring of the business
• For the 17th consecutive year, America's #1 small business lender and #1 lender to small businesses in low-and moderate-income areas (loans under $1 million; 2018 Community Reinvestment Act data, released December 2019)
7 Customers who actively use their checking account with transactions such as debit card purchases, online bill payments, and direct deposit. 8 Data as of November 2019, comparisons with November 2018. 9 Combined consumer and business debit card purchase volume dollars. 10 Digital and mobile active customers is the number of consumer and small business customers who have logged on via a digital or mobile device
in the prior 90 days.
- 10 -
Wholesale Banking provides f inancial solutions to businesses across the United States and globally with annual sales generally in excess of $5 million. Products and businesses include Commercial Banking, Commercial Real Estate, Corporate and Investment Banking, Credit Investment Portfolio, Treasury Management, and Commercial Capital.
Selected Financial Information
Quarter ended
(in millions) Dec 31,
2019 Sep 30,
2019 Dec 31,
2018
Total revenue $ 6,559 6,942 6,926
Provision (reversal of provision) for credit losses 124 92 (28)
Noninterest expense 3,743 3,889 4,025
Segment net income 2,493 2,644 2,671
(in billions)
Average loans 476.5 474.3 470.2
Average assets 877.6 869.2 839.1
Average deposits 447.4 422.0 421.6
Fourth Quarter 2019 vs. Third Quarter 2019
• Net income of $2.5 billion, down $151 million, or 6%
• Revenue of $6.6 billion, down $383 million, or 6%, driven by lower net interest income and lower commercial real estate brokerage fees due to the sale of Eastdil, as well as declines in market sensitive revenue4, lease income, and investment banking fees. These decreases were partially offset by higher other income, which included a $362 million gain from the sale of Eastdil
• Noninterest expense of $3.7 billion decreased $146 million, or 4%, reflecting the sale of Eastdil
Fourth Quarter 2019 vs. Fourth Quarter 2018
• Net income down $178 million, or 7%
• Revenue down $367 million, or 5%, predominantly due to lower net interest income, commercial real estate brokerage fees due to the sale of Eastdil, and lease income. These decreases were partially offset by higher other income, which included a $362 million gain from the sale of Eastdil, as well as higher market sensitive revenue4, investment banking fees, and mortgage banking income
• Noninterest expense decreased $282 million, or 7%, reflecting the sale of Eastdil, as well as lower lease expense and core deposit and other intangibles amortization expense, partially offset by higher regulatory and risk related expense
• Provision for credit losses increased $152 million, reflecting lower recoveries, a lower reserve release1, and higher lease financing losses
Business Metrics and Highlights
• Commercial card spend volume11 of $8.8 billion, up 1% from the prior year on increased transaction volumes
• 2.0 billion of ACH payment transactions originated12, up 13% from the prior year, and up 6% from third quarter 2019
• U.S. investment banking market share of 3.7% in 201913, compared with 3.2% in 201813
• #1 Treasury Management provider14
11 Includes commercial card volume for the entire company. 12 Includes ACH payment transactions originated by the entire company. 13 Source: Dealogic U.S. investment banking fee market share. 14 2019 Ernst & Young Annual Cash Management Services survey (November 2019); measured by "fee-equivalent revenue".
- 11 -
Wealth and Investment Management (WIM) provides a full range of personalized wealth management, investment and retirement products and services to clients across U.S. based businesses including Wells Fargo Advisors, The Private Bank, Abbot Downing, and Wells Fargo Asset Management. We deliver f inancial planning, private banking, credit, investment management and f iduciary services to high-net worth and ultra-high-net worth individuals and families. We also serve clients’ brokerage needs and provide investment management capabilities delivered to global institutional clients through separate accounts and the Wells Fargo Funds.
Selected Financial Information
Quarter ended
(in millions) Dec 31,
2019 Sep 30,
2019 Dec 31,
2018
Total revenue $ 4,071 5,141 3,957
Provision (reversal of provision) for credit losses
Noninterest expense
(1)
3,729
3
3,431
(3)
3,044
Segment net income 254 1,280 689
(in billions)
Average loans
Average assets 85.5 84.7 83.6
77.1 75.9 75.2
Average deposits 145.0 142.4 155.5
Fourth Quarter 2019 vs. Third Quarter 2019
• Net income of $254 million, down $1.0 billion, or 80%
• Revenue of $4.1 billion, down $1.1 billion, or 21%, predominantly due to a $1.1 billion gain from the sale of ourIRT business in third quarter 2019 and lower net interest income in fourth quarter 2019, partially offset byhigher net gains from equity securities on increased deferred compensation plan investment results (largelyoffset by employee benefits expense) in fourth quarter 2019
• Noninterest expense of $3.7 billion increased $298 million, or 9%, primarily due to higher operating losses,higher employee benefits expense from increased deferred compensation plan expense (largely offset by netgains from equity securities), and higher equipment expense related to the strategic reassessment oftechnology projects
Fourth Quarter 2019 vs. Fourth Quarter 2018
• Net income down $435 million, or 63%
• Revenue increased $114 million, or 3%, primarily driven by higher net gains from equity securities on increaseddeferred compensation plan investment results (largely offset by employee benefits expense) and higher retailbrokerage advisory fees, partially offset by lower net interest income
• Noninterest expense increased $685 million, or 23%, primarily driven by higher employee benefits expense fromincreased deferred compensation plan expense (largely offset by net gains from equity securities), higheroperating losses, higher equipment expense related to the strategic reassessment of technology projects, andhigher regulatory, risk and technology expense, partially offset by lower core deposit and other intangiblesamortization expense
- 12 -
Business Metrics and Highlights
Total WIM Segment
• WIM total client assets of $1.9 trillion, up 10% from a year ago, primarily due to higher market valuations, partially offset by net outflows in the Correspondent Clearing business
• Average loan balances up 3% compared with a year ago
• Fourth quarter 2019 closed referred investment assets (referrals resulting from the WIM/Community Banking partnership) up 18% compared with fourth quarter 2018
Retail Brokerage
• Client assets of $1.6 trillion, up 11% from the prior year, primarily due to higher market valuations, partially offset by net outflows in the Correspondent Clearing business
• Advisory assets of $590 billion, up 18% from the prior year, primarily due to higher market valuations, partially offset by net outflows in the Correspondent Clearing business
• IRA assets of $435 billion, up 16% from the prior year
Wealth Management
• Client assets of $240 billion, up 7% from the prior year
Asset Management
• Total assets under management of $509 billion, up 9% from the prior year, primarily driven by higher market valuations and money market fund net inflows, partially offset by equity and fixed income net outflows
Conference Call
The Company will host a live conference call on Tuesday, January 14, at 7:00 a.m. PT (10:00 a.m. ET). You may listen
to the call by dialing 866-872-5161 (U.S. and Canada) or 440-424-4922 (International). The call will also be available
online at https://www.wellsfargo.com/about/investor-relations/quarterly-earnings/ and
Forward-Looking Statements This document contains “forward-looking statements” within the meaning of the Private Securities Litigation Reform Act of 1995. In addition, we may make forward-looking statements in our other documents filed or furnished with the SEC, and our management may make forward-looking statements orally to analysts, investors, representatives of the media and others. Forward-looking statements can be identified by words such as “anticipates,” “intends,” “plans,” “seeks,” “believes,” “estimates,” “expects,” “target,” “projects,” “outlook,” “forecast,” “will,” “may,” “could,” “should,” “can” and similar references to future periods. In particular, forward-looking statements include, but are not limited to, statements we make about: (i) the future operating or financial performance of the Company, including our outlook for future growth; (ii) our noninterest expense and efficiency ratio; (iii) future credit quality and performance, including our expectations regarding future loan losses and allowance levels; (iv) the appropriateness of the allowance for credit losses; (v) our expectations regarding net interest income and net interest margin; (vi) loan growth or the reduction or mitigation of risk in our loan portfolios; (vii) future capital or liquidity levels or targets and our estimated Common Equity Tier 1 ratio under Basel III capital standards; (viii) the performance of our mortgage business and any related exposures; (ix) the expected outcome and impact of legal, regulatory and legislative developments, as well as our expectations regarding compliance therewith; (x) future common stock dividends, common share repurchases and other uses of capital; (xi) our targeted range for return on assets, return on equity, and return on tangible common equity; (xii) the outcome of contingencies, such as legal proceedings; and (xiii) the Company’s plans, objectives and strategies.
Forward-looking statements are not based on historical facts but instead represent our current expectations and assumptions regarding our business, the economy and other future conditions. Because forward-looking statements relate to the future, they are subject to inherent uncertainties, risks and changes in circumstances that are difficult to predict. Our actual results may differ materially from those contemplated by the forward-looking statements. We caution you, therefore, against relying on any of these forward-looking statements. They are neither statements of historical fact nor guarantees or assurances of future performance. While there is no assurance that any list of risks and uncertainties or risk factors is complete, important factors that could cause actual results to differ materially from those in the forward-looking statements include the following, without limitation:
• current and future economic and market conditions, including the effects of declines in housing prices, high unemployment rates, U.S. fiscal debt, budget and tax matters, geopolitical matters, and any slowdown in global economic growth;
• our capital and liquidity requirements (including under regulatory capital standards, such as the Basel III capital standards) and our ability to generate capital internally or raise capital on favorable terms;
• financial services reform and other current, pending or future legislation or regulation that could have a negative effect on our revenue and businesses, including the Dodd-Frank Act and other legislation and regulation relating to bank products and services;
• developments in our mortgage banking business, including the extent of the success of our mortgage loan modification efforts, the amount of mortgage loan repurchase demands that we receive, any negative effects relating to our mortgage servicing, loan modification or foreclosure practices, and the effects of regulatory or judicial requirements or guidance impacting our mortgage banking business and any changes in industry standards;
• our ability to realize any efficiency ratio or expense target as part of our expense management initiatives, including as a result of business and economic cyclicality, seasonality, changes in our business composition and operating environment, growth in our businesses and/or acquisitions, and unexpected expenses relating to, among other things, litigation and regulatory matters;
• the effect of the current interest rate environment or changes in interest rates on our net interest income, net interest margin and our mortgage originations, mortgage servicing rights and mortgage loans held for sale;
• significant turbulence or a disruption in the capital or financial markets, which could result in, among other things, reduced investor demand for mortgage loans, a reduction in the availability of funding or increased funding costs, and declines in asset values and/or recognition of other-than-temporary impairment on securities held in our debt securities and equity securities portfolios;
• the effect of a fall in stock market prices on our investment banking business and our fee income from our brokerage, asset and wealth management businesses;
- 14 -
• negative effects from the retail banking sales practices matter and from other instances where customers may have experienced financial harm, including on our legal, operational and compliance costs, our ability to engage in certain business activities or offer certain products or services, our ability to keep and attract customers, our ability to attract and retain qualified team members, and our reputation;
• resolution of regulatory matters, litigation, or other legal actions, which may result in, among other things, additional costs, fines, penalties, restrictions on our business activities, reputational harm, or other adverse consequences;
• a failure in or breach of our operational or security systems or infrastructure, or those of our third-party vendors or other service providers, including as a result of cyber attacks;
• the effect of changes in the level of checking or savings account deposits on our funding costs and net interest margin;
• fiscal and monetary policies of the Federal Reserve Board; and
• the other risk factors and uncertainties described under “Risk Factors” in our Annual Report on Form 10-K for the year ended December 31, 2018.
In addition to the above factors, we also caution that the amount and timing of any future common stock dividends or repurchases will depend on the earnings, cash requirements and financial condition of the Company, market conditions, capital requirements (including under Basel capital standards), common stock issuance requirements, applicable law and regulations (including federal securities laws and federal banking regulations), and other factors deemed relevant by the Company’s Board of Directors, and may be subject to regulatory approval or conditions.
For more information about factors that could cause actual results to differ materially from our expectations, refer to our reports filed with the Securities and Exchange Commission, including the discussion under “Risk Factors” in our Annual Report on Form 10-K for the year ended December 31, 2018, as filed with the Securities and Exchange Commission and available on its website at www.sec.gov.
Any forward-looking statement made by us speaks only as of the date on which it is made. Factors or events that could cause our actual results to differ may emerge from time to time, and it is not possible for us to predict all of them. We undertake no obligation to publicly update any forward-looking statement, whether as a result of new information, future developments or otherwise, except as may be required by law.
Forward-looking Non-GAAP Financial Measures. From time to time management may discuss forward-looking non-GAAP financial measures, such as forward-looking estimates or targets for return on average tangible common equity. We are unable to provide a reconciliation of forward-looking non-GAAP financial measures to their most directly comparable GAAP financial measures because we are unable to provide, without unreasonable effort, a meaningful or accurate calculation or estimation of amounts that would be necessary for the reconciliation due to the complexity and inherent difficulty in forecasting and quantifying future amounts or when they may occur. Such unavailable information could be significant to future results.
About Wells Fargo Wells Fargo & Company (NYSE: WFC) is a diversified, community-based financial services company with $1.9 trillion in assets. Wells Fargo’s vision is to satisfy our customers’ financial needs and help them succeed financially. Founded in 1852 and headquartered in San Francisco, Wells Fargo provides banking, investment and mortgage products and services, as well as consumer and commercial finance, through 7,400 locations, more than 13,000 ATMs, the internet (wellsfargo.com) and mobile banking, and has offices in 32 countries and territories to support customers who conduct business in the global economy. With approximately 260,000 team members, Wells Fargo serves one in three households in the United States. Wells Fargo & Company was ranked No. 29 on Fortune’s 2019 rankings of America’s largest corporations.
Book value per common share (5) $ 40.31 40.48 38.06 — 6 $ 40.31 38.06
Tangible book value per common share (1)(5) 33.50 33.84 31.86 (1) 5 33.50 31.86
Team members (active, full-time equivalent) 259,800 261,400 258,700 (1) — 259,800 258,700 —
(1) Tangible common equity, return on average tangible common equity, and tangible book value per common share are non-GAAP financial measures. For additional information, including a corresponding reconciliation to GAAP financial measures, see the “Tangible Common Equity” tables on page 36.
(2) The efficiency ratio is noninterest expense divided by total revenue (net interest income and noninterest income). (3) Pre-tax pre-provision profit (PTPP) is total revenue less noninterest expense. Management believes that PTPP is a useful financial measure because it enables investors and others to assess the
Company’s ability to generate capital to cover credit losses through a credit cycle. (4) Consumer and small business banking deposits are total deposits excluding mortgage escrow and wholesale deposits. (5) Book value per common share is common stockholders' equity divided by common shares outstanding. Tangible book value per common share is tangible common equity divided by common shares
outstanding.
5
17
1
1
1
3
1
24
2
3
6
5
- 18 -
Wells Fargo & Company and Subsidiaries FIVE QUARTER SUMMARY FINANCIAL DATA
Quarter ended
Dec 31, Sep 30, Jun 30, Mar 31, Dec 31, ($ in millions, except per share amounts) 2019 2019 2019 2019 2018
For the Quarter
Wells Fargo net income $ 2,873 4,610 6,206 5,860 6,064
Wells Fargo net income applicable to common stock 2,546 4,037 5,848 5,507 5,711
Diluted earnings per common share 0.60 0.92 1.30 1.20 1.21
Profitability ratios (annualized):
Wells Fargo net income to average assets (ROA) 0.59% 0.95 1.31 1.26 1.28
Wells Fargo net income applicable to common stock to average Wells Fargo common stockholders’ equity (ROE) 5.91 9.00 13.26 12.71 12.89
Return on average tangible common equity (ROTCE)(1) 7.08 10.70 15.78 15.16 15.39
Efficiency ratio (2) 78.6 69.1 62.3 64.4 63.6
Total revenue $ 19,860 22,010 21,584 21,609 20,980
Total equity 187,984 194,416 200,037 198,733 197,066
Tangible common equity (1) 138,506 144,481 148,864 147,723 145,980
Common shares outstanding 4,134.4 4,269.1 4,419.6 4,511.9 4,581.3
Book value per common share (5) $ 40.31 40.48 40.10 39.01 38.06
Tangible book value per common share (1)(5) 33.50 33.84 33.68 32.74 31.86
Team members (active, full-time equivalent) 259,800 261,400 262,800 262,100 258,700
(1) Tangible common equity, return on average tangible common equity, and tangible book value per common share are non-GAAP financial measures. For additional information, including a corresponding reconciliation to GAAP financial measures, see the “Tangible Common Equity” tables on page 36.
(2) The efficiency ratio is noninterest expense divided by total revenue (net interest income and noninterest income). (3) Pre-tax pre-provision profit (PTPP) is total revenue less noninterest expense. Management believes that PTPP is a useful financial measure because it enables investors and others to assess the
Company’s ability to generate capital to cover credit losses through a credit cycle. (4) Consumer and small business banking deposits are total deposits excluding mortgage escrow and wholesale deposits. (5) Book value per common share is common stockholders' equity divided by common shares outstanding. Tangible book value per common share is tangible common equity divided by common shares
outstanding.
5
2
- 19 -
Wells Fargo & Company and Subsidiaries CONSOLIDATED STATEMENT OF INCOME
Net change in deferred compensation and related plans (42) (34) (22) (812) (28)
Balance, end of period $ 187,984 194,416 200,037 198,733 197,066
(1) Effective January 1, 2019, we adopted ASU 2016-02 – Leases (Topic 842) and subsequent related Updates and ASU 2017-08 – Receivables – Nonrefundable Fees and Other Costs (Subtopic 310-20): Premium Amortization on Purchased Callable Debt Securities.
(2) Represents the impact of the partial redemption of preferred stock, Series K, in third quarter 2019.
2
268
- 22 -
Wells Fargo & Company and Subsidiaries AVERAGE BALANCES, YIELDS AND RATES PAID (TAXABLE-EQUIVALENT BASIS) (1)(2)
Quarter ended December 31, 2019 2018
(in millions) Averagebalance
Yields/ rates
Interest income/ expense
Average balance
Yields/ rates
Interest income/ expense
Earning assets Interest-earning deposits with banks $ 127,287 1.63% $ 523 150,091 2.18% $ 825 Federal funds sold and securities purchased under resale agreements 109,201 1.72 472 76,108 2.22 426 Debt securities (3):
Securities of U.S. Treasury and federal agencies 15,636 1.79 70 7,195 1.80 32 Securities of U.S. states and political subdivisions 39,502 3.58 354 47,618 4.05 483 Mortgage-backed securities:
Federal agencies 161,146 2.58 1,038 155,322 2.91 1,128 Residential and commercial 4,745 4.40 53 6,666 4.87 81
Total mortgage-backed securities 165,891 2.63 1,091 161,988 2.99 1,209 Other debt securities 40,497 3.88 395 46,072 4.46 518
Securities of U.S. Treasury and federal agencies 45,109 2.19 248 44,747 2.19 247 Securities of U.S. states and political subdivisions 12,701 3.88 123 6,247 4.34 67 Federal agency and other mortgage-backed securities 95,303 2.49 593 95,748 2.46 589 Other debt securities 39 3.28 1 68 3.65 1
Total held-to-maturity debt securities 153,152 2.51 965 146,810 2.46 904 Total debt securities 518,496 2.84 3,686 499,793 3.15 3,940
Mortgage loans held for sale (4) 23,985 3.90 234 17,044 4.46 190 Loans held for sale (4) 1,365 4.13 15 1,992 6.69 33 Loans:
Commercial loans: Commercial and industrial - U.S. 283,650 3.84 2,747 281,431 4.40 3,115 Commercial and industrial - Non-U.S. 67,307 3.40 577 62,035 3.73 584 Real estate mortgage 122,136 4.07 1,255 120,404 4.51 1,369 Real estate construction 20,076 4.71 239 23,090 5.32 310 Lease financing 19,421 4.41 214 19,519 4.48 219
Total interest-bearing liabilities 1,343,833 1.30 4,395 1,274,269 1.34 4,277 Portion of noninterest-bearing funding sources 437,793 — — 458,581 — —
Total funding sources $ 1,781,626 0.98 4,395 1,732,850 0.99 4,277 Net interest margin and net interest income on a taxable-equivalent basis (5) 2.53% $ 11,343 2.94% $ 12,812 Noninterest-earning assets Cash and due from banks $ 19,943 19,288 Goodwill 26,389 26,423 Other 113,885 100,486
Total noninterest-earning assets $ 160,217 146,197 Noninterest-bearing funding sources Deposits $ 351,738 354,597 Other liabilities 53,879 51,739 Total equity 192,393 198,442 Noninterest-bearing funding sources used to fund earning assets (437,793) (458,581)
Net noninterest-bearing funding sources $ 160,217 146,197 Total assets $ 1,941,843 1,879,047
(1) Our average prime rate was 4.83% and 5.28% for the quarters ended December 31, 2019 and 2018, respectively. The average three-month London Interbank Offered Rate (LIBOR) was 1.93% and 2.62% for the same quarters, respectively.
(2) Yields/rates and amounts include the effects of hedge and risk management activities associated with the respective asset and liability categories. (3) Yields and rates are based on interest income/expense amounts for the period, annualized based on the accrual basis for the respective accounts. The average balance amounts represent amortized
cost for the periods presented. (4) Nonaccrual loans and related income are included in their respective loan categories. (5) Includes taxable-equivalent adjustments of $143 million and $168 million for the quarters ended December 31, 2019 and 2018, respectively, predominantly related to tax-exempt income on certain
loans and securities. The federal statutory tax rate utilized was 21% for the periods presented.
- 23 -
Wells Fargo & Company and Subsidiaries AVERAGE BALANCES, YIELDS AND RATES PAID (TAXABLE-EQUIVALENT BASIS) (1)(2)
2019
Year ended December 31,
2018
(in millions) Average balance
Yields/ rates
Interest income/ expense
Average balance
Yields/ rates
Interest income/ expense
Earning assets Interest-earning deposits with banks $ 135,741 2.12% $ 2,875 156,366 1.82% $ 2,854 Federal funds sold and securities purchased under resale agreements 99,286 2.18 2,164 78,547 1.82 1,431 Debt securities (3):
Securities of U.S. Treasury and federal agencies 15,293 2.07 316 6,618 1.70 112 Securities of U.S. states and political subdivisions 44,203 3.87 1,709 47,884 3.77 1,806 Mortgage-backed securities:
Federal agencies 154,160 2.85 4,397 156,052 2.79 4,348 Residential and commercial 5,363 4.19 225 7,769 4.62 358
Total mortgage-backed securities 159,523 2.90 4,622 163,821 2.87 4,706 Other debt securities 43,675 4.23 1,846 46,875 4.22 1,980
Securities of U.S. Treasury and federal agencies 44,850 2.19 982 44,735 2.19 980 Securities of U.S. states and political subdivisions 8,644 3.97 343 6,253 4.34 271 Federal agency and other mortgage-backed securities 95,559 2.60 2,487 94,216 2.36 2,221 Other debt securities 52 3.71 2 361 4.00 15
Total held-to-maturity debt securities 149,105 2.56 3,814 145,565 2.40 3,487 Total debt securities 505,454 3.06 15,456 494,289 3.02 14,947
Mortgage loans held for sale (4) 19,808 4.10 813 18,394 4.22 777 Loans held for sale (4) 1,708 4.60 79 2,526 5.56 140 Loans:
Commercial loans: Commercial and industrial - U.S. 284,888 4.25 12,107 275,656 4.16 11,465 Commercial and industrial - Non-U.S. 64,274 3.71 2,385 60,718 3.53 2,143 Real estate mortgage 121,813 4.40 5,356 122,947 4.29 5,279 Real estate construction 21,183 5.17 1,095 23,609 4.94 1,167 Lease financing 19,302 4.52 873 19,392 4.74 919
Total interest-bearing liabilities 1,315,749 1.43 18,853 1,273,728 1.15 14,654 Portion of noninterest-bearing funding sources 438,713 — — 464,754 — —
Total funding sources $ 1,754,462 1.07 18,853 1,738,482 0.85 14,654
Net interest margin and net interest income on a taxable-equivalent basis (5) 2.73% $ 47,843 2.91% $ 50,654 Noninterest-earning assets Cash and due from banks $ 19,558 18,777 Goodwill 26,409 26,453 Other 113,015 105,180
Total noninterest-earning assets $ 158,982 150,410 Noninterest-bearing funding sources Deposits $ 344,111 358,312 Other liabilities 55,963 53,496 Total equity 197,621 203,356 Noninterest-bearing funding sources used to fund earning assets (438,713) (464,754)
Total assets $ 1,913,444 Net noninterest-bearing funding sources $ 158,982 150,410
1,888,892
(1) Our average prime rate was 5.28% and 4.91% for 2019 and 2018, respectively. The average three-month London Interbank Offered Rate (LIBOR) was 2.33% and 2.31% for the same periods, respectively.
(2) Yields/rates and amounts include the effects of hedge and risk management activities associated with the respective asset and liability categories. (3) Yields and rates are based on interest income/expense amounts for the period. The average balance amounts represent amortized cost for the periods presented. (4) Nonaccrual loans and related income are included in their respective loan categories. (5) Includes taxable-equivalent adjustments of $612 million and $659 million for the 2019 and 2018, respectively, predominantly related to tax-exempt income on certain loans and securities. The
federal statutory tax rate utilized was 21% for the periods presented.
- 24 -
Wells Fargo & Company and Subsidiaries FIVE QUARTER AVERAGE BALANCES, YIELDS AND RATES PAID (TAXABLE-EQUIVALENT BASIS) (1)(2)
Quarter ended
Dec 31, 2019 Sep 30, 2019 Jun 30, 2019 Mar 31, 2019 Dec 31, 2018
($ in billions) Average balance
Yields/ rates
Average balance
Yields/ rates
Average balance
Yields/ rates
Average balance
Yields/ rates
Average balance
Yields/ rates
Earning assets
Interest-earning deposits with banks $ 127.3 1.63% $ 134.0 2.14% $ 141.0 2.33% $ 140.8 2.33% $ 150.1 2.18% Federal funds sold and securities purchased under resale
Securities of U.S. Treasury and federal agencies Securities of U.S. states and political subdivisions Federal agency and other mortgage-backed securities Other debt securities
Total held-to-maturity debt securities
45.1 12.8 95.3
— 153.2
2.19 3.88 2.49 3.28 2.51
44.8 8.7
95.4 0.1
149.0
2.18 4.01 2.54 3.58 2.52
44.8 7.0
95.4 0.1
147.3
2.19 4.06 2.64 3.86 2.57
44.7 6.2
95.9 0.1
146.9
2.20 4.03 2.74 3.96 2.63
44.7 6.2
95.8 0.1
146.8
2.19 4.34 2.46 3.65 2.46
Total debt securities 518.5 2.84 504.8 3.00 495.4 3.16 503.0 3.25 499.8 3.15 Mortgage loans held for sale Loans held for sale
24.0 1.4
3.90 4.13
22.7 2.0
4.08 4.17
18.5 1.6
4.22 4.80
13.9 1.9
4.37 5.25
17.0 2.0
4.46 6.69
Loans: Commercial loans:
Commercial and industrial - U.S. 283.7 3.84 284.3 4.21 285.1 4.47 286.6 4.48 281.4 4.40 Commercial and industrial - Non-U.S. 67.3 3.40 64.0 3.67 62.9 3.90 62.8 3.90 62.0 3.73 Real estate mortgage 122.1 4.07 121.8 4.36 121.9 4.58 121.4 4.58 120.4 4.51 Real estate construction 20.1 4.71 20.7 5.13 21.6 5.36 22.4 5.43 23.1 5.32 Lease financing
Noninterest-bearing funding sources used to fund earning assets (437.8) (438.3) (438.6) (440.2) (458.6)
Net noninterest-bearing funding sources $ 160.2 164.5 158.6 152.5 146.1
Total assets $ 1,941.8 1,927.4 1,900.6 1,883.1 1,879.0
(1) Our average prime rate was 4.83% for the quarter ended December 31, 2019, 5.31% for the quarter ended September 30, 2019, 5.50% for the quarters ended June 30 and March 31, 2019, and 5.28% for the quarter ended December 31, 2018. The average three-month London Interbank Offered Rate (LIBOR) was 1.93%, 2.20%, 2.51%, 2.69% and 2.62% for the same quarters, respectively.
(2) Yields/rates include the effects of hedge and risk management activities associated with the respective asset and liability categories. (3) Yields and rates are based on interest income/expense amounts for the period, annualized based on the accrual basis for the respective accounts. The average balance amounts represent amortized
cost for the periods presented.
- 25 -
Wells Fargo & Company and Subsidiaries NONINTEREST INCOME
(in millions)
Quarter ended December 31,
2019 2018
%
Change
Year ended December 31,
2019 2018
%
Change
Service charges on deposit accounts $ 1,279 1,176 9% $ 4,798 4,716 2%
Trust and investment fees:
Brokerage advisory, commissions and other fees 2,380 2,345 1 9,237 9,436 (2)
Trust and investment management 728 796 (9) 3,038 3,316 (8)
Investment banking 464 379 22 1,797 1,757 2
Total trust and investment fees 3,572 3,520 1 14,072 14,509 (3)
Card fees 1,020 981 4 4,016 3,907 3
Other fees:
Lending related charges and fees 334 400 (17) 1,379 1,526 (10)
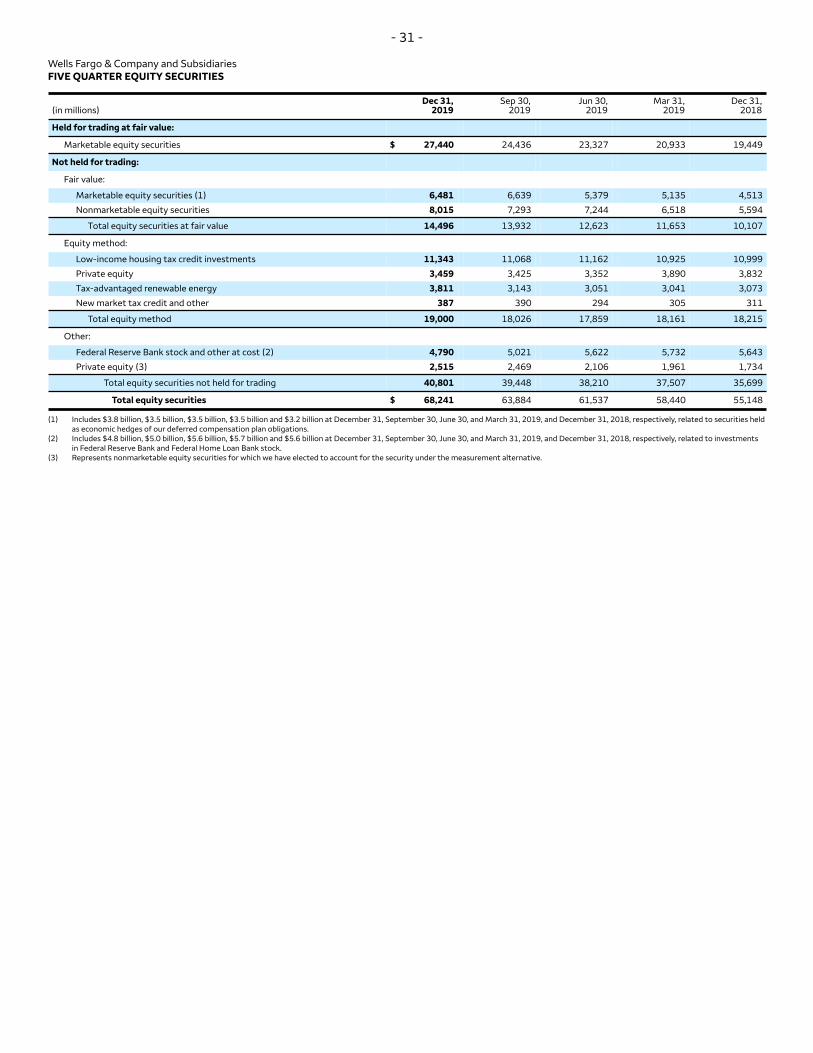
Tax-advantaged renewable energy 3,811 3,143 3,051 3,041 3,073
New market tax credit and other 387 390 294 305 311
Total equity method 19,000 18,026 17,859 18,161 18,215
Other:
Federal Reserve Bank stock and other at cost (2) 4,790 5,021 5,622 5,732 5,643
Private equity (3) 2,515 2,469 2,106 1,961 1,734
Total equity securities not held for trading 40,801 39,448 38,210 37,507 35,699
Total equity securities $ 68,241 63,884 61,537 58,440 55,148
(1) Includes $3.8 billion, $3.5 billion, $3.5 billion, $3.5 billion and $3.2 billion at December 31, September 30, June 30, and March 31, 2019, and December 31, 2018, respectively, related to securities held as economic hedges of our deferred compensation plan obligations.
(2) Includes $4.8 billion, $5.0 billion, $5.6 billion, $5.7 billion and $5.6 billion at December 31, September 30, June 30, and March 31, 2019, and December 31, 2018, respectively, related to investments in Federal Reserve Bank and Federal Home Loan Bank stock.
(3) Represents nonmarketable equity securities for which we have elected to account for the security under the measurement alternative.
- 32 -
Wells Fargo & Company and Subsidiaries FIVE QUARTER LOANS
(in millions) Dec 31,
2019 Sep 30,
2019 Jun 30,
2019 Mar 31,
2019 Dec 31,
2018
Commercial:
Commercial and industrial $ 354,125 350,875 348,846 349,134 350,199
Real estate mortgage 121,824 121,936 123,008 122,113 121,014
Real estate construction 19,939 19,921 21,067 21,857 22,496
Total commercial 515,719 512,332 512,245 512,226 513,405
Consumer:
Real estate 1-4 family first mortgage 293,847 290,604 286,427 284,545 285,065
Real estate 1-4 family junior lien mortgage 29,509 30,838 32,068 33,099 34,398
Credit card 41,013 39,629 38,820 38,279 39,025
Automobile 47,873 46,738 45,664 44,913 45,069
Other revolving credit and installment 34,304 34,774 34,654 35,187 36,148
Total consumer 446,546 442,583 437,633 436,023 439,705
Total loans (1) $ 962,265 954,915 949,878 948,249 953,110
(1) Includes $568 million, $607 million, $1.2 billion, $3.2 billion, and $5.0 billion of purchased credit-impaired (PCI) loans at December 31, September 30, June 30, and March 31, 2019, and December 31, 2018, respectively.
Our non-U.S. loans are reported by respective class of financing receivable in the table above. Substantially all of our non-U.S. loan portfolio is commercial loans. The following table presents total non-U.S. commercial loans outstanding by class of financing receivable.
(in millions) Dec 31,
2019 Sep 30,
2019 Jun 30,
2019 Mar 31,
2019 Dec 31,
2018
Non-U.S. commercial loans:
Commercial and industrial
Real estate mortgage
Real estate construction
Lease financing
$ 70,494 7,004 1,434 1,220
64,418
7,056
1,262
1,197
63,296
6,801
1,287
1,215
63,158
7,049
1,138
1,167
62,564
6,731
1,011
1,159
Total non-U.S. commercial loans $ 80,152 73,933 72,599 72,512 71,465
- 33 -
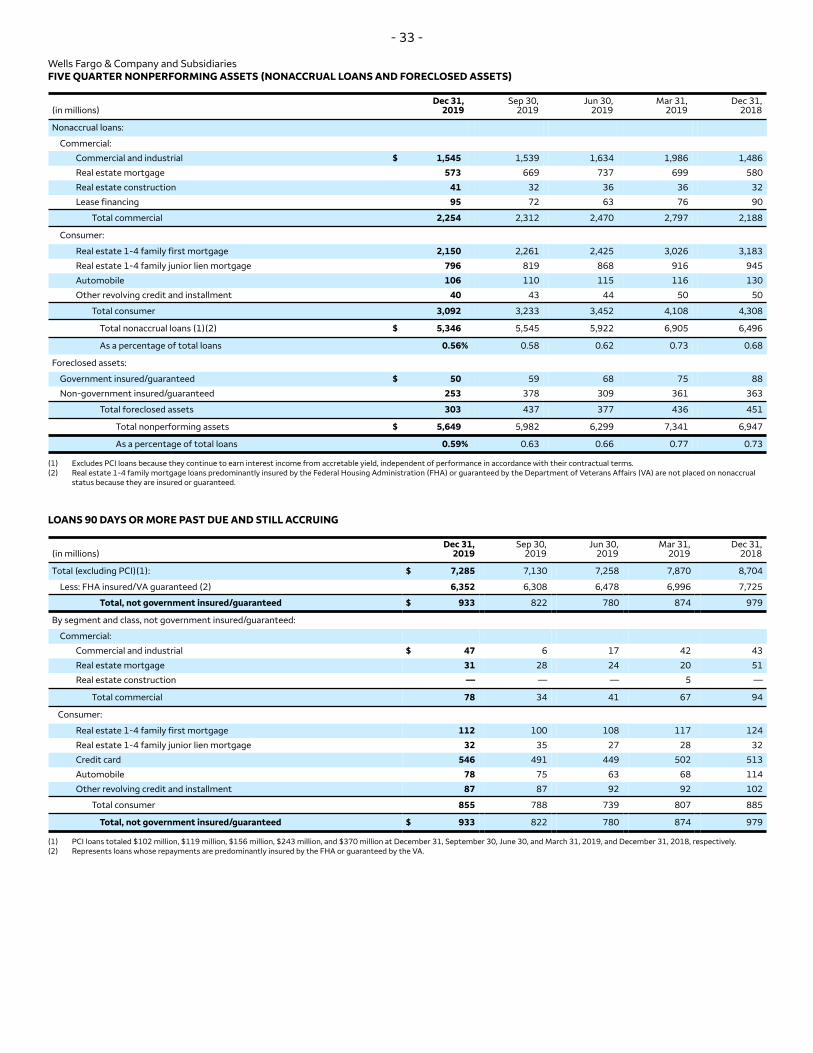
Wells Fargo & Company and Subsidiaries FIVE QUARTER NONPERFORMING ASSETS (NONACCRUAL LOANS AND FORECLOSED ASSETS)
Dec 31, Sep 30, Jun 30, Mar 31, Dec 31, (in millions) 2019 2019 2019 2019 2018
Nonaccrual loans:
Commercial:
Commercial and industrial $ 1,545 1,539 1,634 1,986 1,486
Real estate mortgage 573 669 737 699 580
Real estate construction 41 32 36 36 32
Lease financing 95 72 63 76 90
Total commercial 2,254 2,312 2,470 2,797 2,188
Consumer:
Real estate 1-4 family first mortgage 2,150 2,261 2,425 3,026 3,183
Real estate 1-4 family junior lien mortgage 796 819 868 916 945
Automobile 106 110 115 116
Other revolving credit and installment 40 43 44 50 50
Total consumer 3,092 3,233 3,452 4,108 4,308
Total nonaccrual loans (1)(2) $ 5,346 5,545 5,922 6,905 6,496
As a percentage of total loans 0.56% 0.58 0.62 0.73 0.68
Total nonperforming assets $ 5,649 5,982 6,299 7,341 6,947
As a percentage of total loans 0.59% 0.63 0.66 0.77 0.73
(1) Excludes PCI loans because they continue to earn interest income from accretable yield, independent of performance in accordance with their contractual terms. (2) Real estate 1-4 family mortgage loans predominantly insured by the Federal Housing Administration (FHA) or guaranteed by the Department of Veterans Affairs (VA) are not placed on nonaccrual
status because they are insured or guaranteed.
LOANS 90 DAYS OR MORE PAST DUE AND STILL ACCRUING
Dec 31, Sep 30, Jun 30, Mar 31, Dec 31, (in millions) 2019 2019 2019 2019 2018
Total (excluding PCI)(1): $ 7,285 7,130 7,258 7,870 8,704
Total, not government insured/guaranteed $ 933 822 780 874 979
By segment and class, not government insured/guaranteed:
Commercial:
Commercial and industrial $ 47 6 17 42 43
Real estate mortgage 31 28 24 20
Real estate construction — — — 5 —
Total commercial 78 34 41 67 94
Consumer:
Real estate 1-4 family first mortgage 112 100 108 117
Real estate 1-4 family junior lien mortgage 32 35 27 28 32
Credit card 546 491 449 502
Automobile 78 75 63 68 114
Other revolving credit and installment 87 87 92 92 102
Total consumer 855 788 739 807 885
Total, not government insured/guaranteed $ 933 822 780 874 979
(1) PCI loans totaled $102 million, $119 million, $156 million, $243 million, and $370 million at December 31, September 30, June 30, and March 31, 2019, and December 31, 2018, respectively. (2) Represents loans whose repayments are predominantly insured by the FHA or guaranteed by the VA.
130
88
51
124
513
Balance, beginning of period $ 10,613 10,956 10,707 11,960
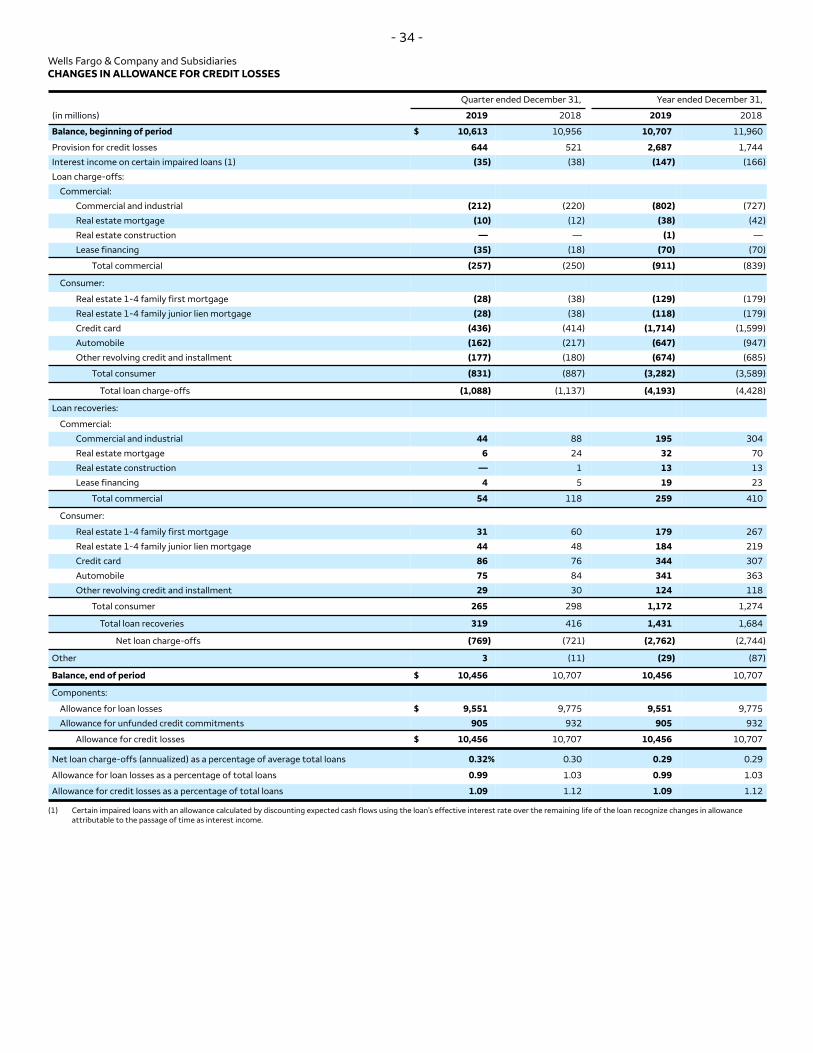
Wells Fargo & Company and Subsidiaries CHANGES IN ALLOWANCE FOR CREDIT LOSSES
- 34 -
(in millions)
Quarter ended December 31,
2019 2018
Year ended December 31,
2019 2018
Provision for credit losses 644 521 2,687 1,744
Interest income on certain impaired loans (1) (35) (38) (147) (166)
Loan charge-offs:
Commercial:
Commercial and industrial (212) (220) (802) (727)
Real estate mortgage (10) (12) (38) (42)
Real estate construction — — (1) —
Lease financing (35) (18) (70) (70)
Total commercial (257) (250) (911) (839)
Real estate 1-4 family first mortgage (28) (38) (129) (179)
Consumer:
Real estate 1-4 family junior lien mortgage (28) (38) (118) (179)
Credit card (436) (414) (1,714) (1,599)
Automobile (162) (217) (647) (947)
Other revolving credit and installment (177) (180) (674) (685)
Total loan charge-offs (1,088) (1,137) (4,193) (4,428)
Total consumer (831) (887) (3,282) (3,589)
Loan recoveries:
Commercial:
Commercial and industrial 44 88 195
Real estate mortgage 6 24 32 70
Real estate construction — 1 13
Lease financing 4 5 19 23
Total commercial 54 118 259 410
Consumer:
Real estate 1-4 family first mortgage 31 60 179
Real estate 1-4 family junior lien mortgage 44 48 184 219
Credit card 86 76 344
Automobile 75 84 341 363
Other revolving credit and installment 29 30 124 118
Total consumer 265 298 1,172 1,274
Total loan recoveries 319 416 1,431 1,684
Net loan charge-offs (769) (721) (2,762) (2,744)
Other 3 (11) (29) (87)
Balance, end of period $ 10,456 10,707 10,456 10,707
Components:
Allowance for loan losses $ 9,551 9,775 9,551 9,775
Allowance for unfunded credit commitments 905 932 905 932
Allowance for credit losses $ 10,456 10,707 10,456 10,707
Net loan charge-offs (annualized) as a percentage of average total loans 0.32% 0.30 0.29 0.29
Allowance for loan losses as a percentage of total loans 0.99 1.03 0.99 1.03
Allowance for credit losses as a percentage of total loans 1.09 1.12 1.09 1.12
(1) Certain impaired loans with an allowance calculated by discounting expected cash flows using the loan’s effective interest rate over the remaining life of the loan recognize changes in allowance attributable to the passage of time as interest income.
304
13
267
307
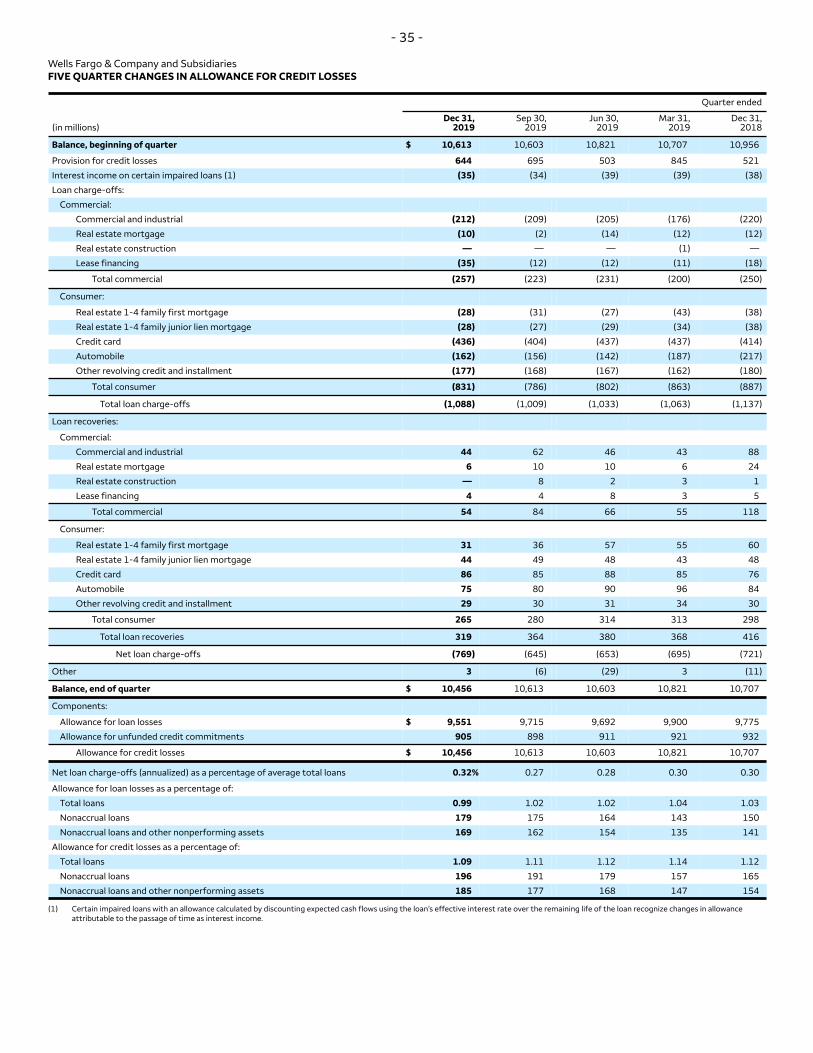
Wells Fargo & Company and Subsidiaries FIVE QUARTER CHANGES IN ALLOWANCE FOR CREDIT LOSSES
(in millions)
- 35 -
Dec 31, 2019
Sep 30, 2019
Jun 30, 2019
Mar 31, 2019
Quarter ended
Dec 31, 2018
Provision for credit losses 644 695 503 845 521
Balance, beginning of quarter $ 10,613 10,603 10,821 10,707 10,956
Interest income on certain impaired loans (1) (35) (34) (39) (39) (38)
Loan charge-offs:
Commercial:
Commercial and industrial (212) (209) (205) (176) (220)
Real estate mortgage (10) (2) (14) (12) (12)
Real estate construction — — — (1) —
Lease financing (35) (12) (12) (11) (18)
Total commercial (257) (223) (231) (200) (250)
Real estate 1-4 family first mortgage (28) (31) (27) (43) (38)
Consumer:
Real estate 1-4 family junior lien mortgage (28) (27) (29) (34) (38)
Credit card (436) (404) (437) (437) (414)
Automobile (162) (156) (142) (187) (217)
Other revolving credit and installment (177) (168) (167) (162) (180)
Total loan charge-offs (1,088) (1,009) (1,033) (1,063) (1,137)
Total consumer (831) (786) (802) (863) (887)
Loan recoveries:
Commercial:
Commercial and industrial 44 62 46 43
Real estate mortgage 6 10 10 6 24
Real estate construction — 8 2 3
Lease financing 4 4 8 3 5
Total commercial 54 84 66 55 118
Consumer:
Real estate 1-4 family first mortgage 31 36 57 55
Real estate 1-4 family junior lien mortgage 44 49 48 43 48
Credit card 86 85 88 85
Automobile 75 80 90 96 84
Other revolving credit and installment 29 30 31 34 30
Total consumer 265 280 314 313 298
Total loan recoveries 319 364 380 368 416
Net loan charge-offs (769) (645) (653) (695) (721)
Other 3 (6) (29) 3 (11)
Balance, end of quarter $ 10,456 10,613 10,603 10,821 10,707
Components:
Allowance for loan losses $ 9,551 9,715 9,692 9,900 9,775
Allowance for unfunded credit commitments 905 898 911 921 932
Allowance for credit losses $ 10,456 10,613 10,603 10,821 10,707
Net loan charge-offs (annualized) as a percentage of average total loans 0.32% 0.27 0.28 0.30 0.30
Allowance for loan losses as a percentage of:
Total loans 0.99 1.02 1.02 1.04 1.03
Nonaccrual loans 179 175 164 143 150
Nonaccrual loans and other nonperforming assets 169 162 154 135 141
Allowance for credit losses as a percentage of:
Total loans 1.09 1.11 1.12 1.14 1.12
Nonaccrual loans 196 191 179 157 165
Nonaccrual loans and other nonperforming assets 185 177 168 147 154
(1) Certain impaired loans with an allowance calculated by discounting expected cash flows using the loan’s effective interest rate over the remaining life of the loan recognize changes in allowance attributable to the passage of time as interest income.
88
1
60
76
- 36 -
Wells Fargo & Company and Subsidiaries TANGIBLE COMMON EQUITY
We also evaluate our business based on certain ratios that utilize tangible common equity. Tangible common equity is a non-GAAP financial measure and represents total equity less preferred equity, noncontrolling interests, goodwill, certain identifiable intangible assets (other than mortgage servicing rights) and goodwill and other intangibles on nonmarketable equity securities, net of applicable deferred taxes. These tangible common equity ratios are as follows:
• Tangible book value per common share, which represents tangible common equity divided by common shares outstanding; and • Return on average tangible common equity (ROTCE), which represents our annualized earnings contribution as a percentage of tangible
common equity.
The methodology of determining tangible common equity may differ among companies. Management believes that tangible book value per common share and return on average tangible common equity, which utilize tangible common equity, are useful financial measures because they enable investors and others to assess the Company’s use of equity.
The tables below provide a reconciliation of these non-GAAP financial measures to GAAP financial measures.
Dec 31, Sep 30, Jun 30, Mar 31, Dec 31, (in millions, except ratios) 2019 2019 2019 2019 2018
Tangible book value per common share:
Total equity $ 187,984 194,416 200,037 198,733 197,066
Certain identifiable intangible assets (other than MSRs) (449) (477) (505) (543) (693) (493) (1,088)
Goodwill and other intangibles on nonmarketable equity securities (included in other assets) (2,223) (2,159) (2,155) (2,159) (2,204) (2,174) (2,197)
Applicable deferred taxes related to goodwill and other intangible assets (1) 807 797 780 784 800 792 866
Average tangible common equity (C) $ 142,717 149,665 148,644 147,305 147,205 147,078 150,633
Return on average common stockholders' equity (ROE) (annualized) (A)/(B) 5.91 9.00 13.26 12.71 12.89 10.23 11.53
Return on average tangible common equity (ROTCE) (annualized) (A)/(C) 7.08 10.70 15.78 15.16 15.39 12.20 13.73
(1) Determined by applying the combined federal statutory rate and composite state income tax rates to the difference between book and tax basis of the respective goodwill and intangible assets at period end.
- 37 -
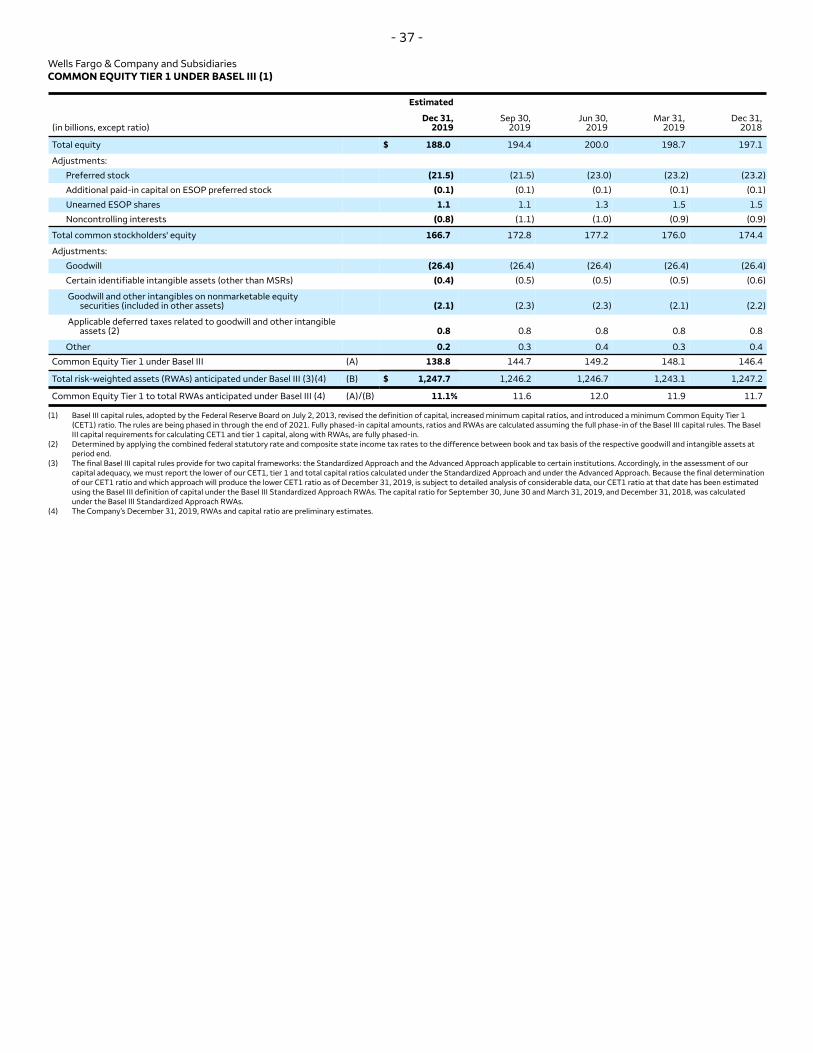
Wells Fargo & Company and Subsidiaries COMMON EQUITY TIER 1 UNDER BASEL III (1)
Total common stockholders' equity 166.7 172.8 177.2 176.0 174.4
Adjustments:
Goodwill (26.4) (26.4) (26.4) (26.4) (26.4)
Certain identifiable intangible assets (other than MSRs) (0.4) (0.5) (0.5) (0.5) (0.6)
Goodwill and other intangibles on nonmarketable equity securities (included in other assets) (2.1) (2.3) (2.3) (2.1) (2.2)
Applicable deferred taxes related to goodwill and other intangible assets (2) 0.8 0.8 0.8 0.8 0.8
Other 0.2 0.3 0.4 0.3 0.4
Common Equity Tier 1 under Basel III (A) 138.8 144.7 149.2 148.1
Total risk-weighted assets (RWAs) anticipated under Basel III (3)(4) (B) $ 1,247.7 1,246.2 1,246.7 1,243.1 1,247.2
Common Equity Tier 1 to total RWAs anticipated under Basel III (4) (A)/(B) 11.1% 11.6 12.0 11.9
(1) Basel III capital rules, adopted by the Federal Reserve Board on July 2, 2013, revised the definition of capital, increased minimum capital ratios, and introduced a minimum Common Equity Tier 1 (CET1) ratio. The rules are being phased in through the end of 2021. Fully phased-in capital amounts, ratios and RWAs are calculated assuming the full phase-in of the Basel III capital rules. The Basel III capital requirements for calculating CET1 and tier 1 capital, along with RWAs, are fully phased-in.
(2) Determined by applying the combined federal statutory rate and composite state income tax rates to the difference between book and tax basis of the respective goodwill and intangible assets at period end.
(3) The final Basel III capital rules provide for two capital frameworks: the Standardized Approach and the Advanced Approach applicable to certain institutions. Accordingly, in the assessment of our capital adequacy, we must report the lower of our CET1, tier 1 and total capital ratios calculated under the Standardized Approach and under the Advanced Approach. Because the final determination of our CET1 ratio and which approach will produce the lower CET1 ratio as of December 31, 2019, is subject to detailed analysis of considerable data, our CET1 ratio at that date has been estimated using the Basel III definition of capital under the Basel III Standardized Approach RWAs. The capital ratio for September 30, June 30 and March 31, 2019, and December 31, 2018, was calculated under the Basel III Standardized Approach RWAs.
(4) The Company’s December 31, 2019, RWAs and capital ratio are preliminary estimates.
146.4
11.7
- 38 -
Wells Fargo & Company and Subsidiaries OPERATING SEGMENT RESULTS (1)
(income/expense in millions, average balances in billions)
2019
Community Banking
2018 2019
Wholesale Banking
2018
Wealth and Investment
Management
2019 2018 2019
Other (2)
2018
Consolidated Company
2019 2018
Quarter ended Dec 31,
Net interest income (3) $ 6,527 7,340 4,248 4,739 910 1,116 (485) (551) 11,200 12,644
Provision (reversal of provision) for credit losses 522 534 124 (28) (1) (3) (1) 18 644 521
Noninterest income
Noninterest expense
Income (loss) before income tax expense (benefit)
Income tax expense (benefit) (4)
Net income (loss) before noncontrolling interests
3,995
9,029
971
497
474
4,121
7,032
3,895
637
3,258
2,311
3,743
2,692
197
2,495
2,187
4,025
2,929
253
2,676
3,161
3,729
343
85
258
2,841
3,044
916
231
685
(807)
(887)
(404)
(101)
(303)
(813)
(762)
(620)
(155)
(465)
8,660
15,614
3,602
678
2,924
8,336
13,339
7,120
966
6,154
Net income (loss)
Average loans
$
$
429
462.5
3,169
459.7
2,493
476.5
2,671
470.2
254
77.1
689
75.2
(303)
(59.6)
(465)
(58.8)
2,873
956.5
6,064
946.3
Less: Net income (loss) from noncontrolling interests 45 89 2 5 4 (4) — — 51 90
(1) The management accounting process measures the performance of the operating segments based on our management structure and is not necessarily comparable with other similar information for other financial services companies. We define our operating segments by product type and customer segment.
(2) Includes the elimination of certain items that are included in more than one business segment, most of which represents products and services for Wealth and Investment Management customers served through Community Banking distribution channels.
(3) Net interest income is the difference between interest earned on assets and the cost of liabilities to fund those assets. Interest earned includes actual interest earned on segment assets as well as interest credits for any funding of a segment available to be provided to other segments. The cost of liabilities includes actual interest expense on segment liabilities as well as funding charges for any funding provided from other segments.
(4) Income tax expense (benefit) for our Wholesale Banking operating segment included income tax credits related to low-income housing and renewable energy investments of $478 million and $486 million for the quarters ended December 31, 2019 and 2018, respectively, and $1.8 billion and $1.6 billion for the years ended December 31, 2019 and 2018, respectively.
483
- 39 -
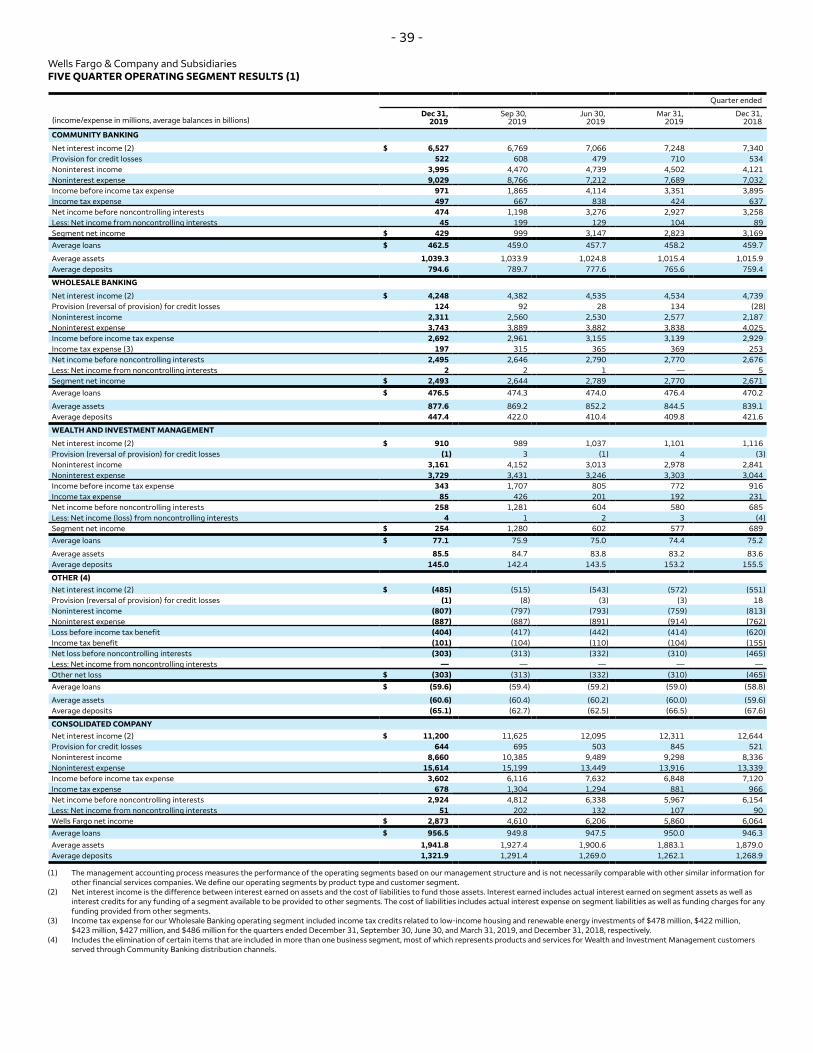
Wells Fargo & Company and Subsidiaries FIVE QUARTER OPERATING SEGMENT RESULTS (1)
Quarter ended
Dec 31, Sep 30, Jun 30, Mar 31, Dec 31,(income/expense in millions, average balances in billions) 2019 2019 2019 2019 2018
COMMUNITY BANKING
Net interest income (2) $ 6,527 6,769 7,066 7,248 7,340 Provision for credit losses 522 608 479 710 534 Noninterest income 3,995 4,470 4,739 4,502 4,121 Noninterest expense 9,029 8,766 7,212 7,689 7,032 Income before income tax expense 971 1,865 4,114 3,351 3,895 Income tax expense 497 667 838 424 637 Net income before noncontrolling interests 474 1,198 3,276 2,927 3,258 Less: Net income from noncontrolling interests 45 199 129 104 89 Segment net income $ 429 999 3,147 2,823 3,169 Average loans $ 462.5 459.0 457.7 458.2 459.7
Average assets 1,039.3 1,033.9 1,024.8 1,015.4 1,015.9 Average deposits 794.6 789.7 777.6 765.6 759.4
WHOLESALE BANKING
Net interest income (2) $ 4,248 4,382 4,535 4,534 4,739 Provision (reversal of provision) for credit losses 124 92 28 134 (28) Noninterest income 2,311 2,560 2,530 2,577 2,187 Noninterest expense 3,743 3,889 3,882 3,838 4,025 Income before income tax expense 2,692 2,961 3,155 3,139 2,929 Income tax expense (3) 197 315 365 369 253 Net income before noncontrolling interests 2,495 2,646 2,790 2,770 2,676 Less: Net income from noncontrolling interests 2 2 1 — 5 Segment net income $ 2,493 2,644 2,789 2,770 2,671 Average loans $ 476.5 474.3 474.0 476.4 470.2
Average assets 877.6 869.2 852.2 844.5 839.1 Average deposits 447.4 422.0 410.4 409.8 421.6
WEALTH AND INVESTMENT MANAGEMENT
Net interest income (2) $ 910 989 1,037 1,101 1,116 Provision (reversal of provision) for credit losses (1) 3 (1) 4 (3)Noninterest income 3,161 4,152 3,013 2,978 2,841 Noninterest expense 3,729 3,431 3,246 3,303 3,044 Income before income tax expense 343 1,707 805 772 916 Income tax expense 85 426 201 192 231 Net income before noncontrolling interests 258 1,281 604 580 685 Less: Net income (loss) from noncontrolling interests 4 1 2 3 (4)Segment net income $ 254 1,280 602 577 689 Average loans $ 77.1 75.9 75.0 74.4 75.2
Average assets 85.5 84.7 83.8 83.2 83.6 Average deposits 145.0 142.4 143.5 153.2 155.5
OTHER (4) Net interest income (2) $ (485) (515) (543) (572) (551) Provision (reversal of provision) for credit losses (1) (8) (3) (3) 18 Noninterest income (807) (797) (793) (759) (813) Noninterest expense (887) (887) (891) (914) (762) Loss before income tax benefit (404) (417) (442) (414) (620) Income tax benefit (101) (104) (110) (104) (155) Net loss before noncontrolling interests (303) (313) (332) (310) (465) Less: Net income from noncontrolling interests — — — — — Other net loss $ (303) (313) (332) (310) (465) Average loans $ (59.6) (59.4) (59.2) (59.0) (58.8)
Average assets (60.6) (60.4) (60.2) (60.0) (59.6) Average deposits (65.1) (62.7) (62.5) (66.5) (67.6)
CONSOLIDATED COMPANY Net interest income (2) $ 11,200 11,625 12,095 12,311 12,644 Provision for credit losses 644 695 503 845 521 Noninterest income 8,660 10,385 9,489 9,298 8,336 Noninterest expense 15,614 15,199 13,449 13,916 13,339 Income before income tax expense 3,602 6,116 7,632 6,848 7,120 Income tax expense 678 1,304 1,294 881 966 Net income before noncontrolling interests 2,924 4,812 6,338 5,967 6,154 Less: Net income from noncontrolling interests 51 202 132 107 90 Wells Fargo net income $ 2,873 4,610 6,206 5,860 6,064 Average loans $ 956.5 949.8 947.5 950.0 946.3 Average assets 1,941.8 1,927.4 1,900.6 1,883.1 1,879.0 Average deposits 1,321.9 1,291.4 1,269.0 1,262.1 1,268.9
(1) The management accounting process measures the performance of the operating segments based on our management structure and is not necessarily comparable with other similar information for other financial services companies. We define our operating segments by product type and customer segment.
(2) Net interest income is the difference between interest earned on assets and the cost of liabilities to fund those assets. Interest earned includes actual interest earned on segment assets as well as interest credits for any funding of a segment available to be provided to other segments. The cost of liabilities includes actual interest expense on segment liabilities as well as funding charges for any funding provided from other segments.
(3) Income tax expense for our Wholesale Banking operating segment included income tax credits related to low-income housing and renewable energy investments of $478 million, $422 million, $423 million, $427 million, and $486 million for the quarters ended December 31, September 30, June 30, and March 31, 2019, and December 31, 2018, respectively.
(4) Includes the elimination of certain items that are included in more than one business segment, most of which represents products and services for Wealth and Investment Management customers served through Community Banking distribution channels.
449
Wells Fargo & Company and Subsidiaries FIVE QUARTER CONSOLIDATED MORTGAGE SERVICING
Servicing and foreclosure costs (4) 45 13 (22) 12 763
Discount rates (5) (34) 188 (109) 100 (821)
Prepayment estimates and other (6) (54) (445) 206 (63) (314)
Net changes in valuation model inputs or assumptions 362 (962) (1,078) (891) (1,246)
Changes due to collection/realization of expected cash flows over time (571) (596) (561) (482) (470)
Total changes in fair value (209) (1,558) (1,639) (1,373) (1,716)
Fair value, end of quarter $ 11,517 11,072 12,096 13,336 14,649
(1) Includes impacts associated with exercising cleanup calls on securitizations as well as our right to repurchase delinquent loans from Government National Mortgage Association (GNMA) loan securitization pools. Total reported MSRs may increase upon repurchase due to servicing liabilities associated with these delinquent GNMA loans.
(2) Includes sales and transfers of MSRs, which can result in an increase of total reported MSRs if the sales or transfers are related to nonperforming loan portfolios or portfolios with servicing liabilities. (3) Includes prepayment speed changes as well as other valuation changes due to changes in mortgage interest rates (such as changes in estimated interest earned on custodial deposit balances). (4) Includes costs to service and unreimbursed foreclosure costs. (5) Reflects discount rate assumption change, excluding portion attributable to changes in mortgage interest rates. (6) Represents changes driven by other valuation model inputs or assumptions including prepayment speed estimation changes and other assumption updates. Prepayment speed estimation changes
are influenced by observed changes in borrower behavior and other external factors that occur independent of interest rate changes.
Quarter ended
Dec 31, Sep 30, Jun 30, Mar 31, Dec 31, (in millions) 2019 2019 2019 2019 2018
Amortized MSRs:
Balance, beginning of quarter $ 1,397 1,407 1,427 1,443 1,414
Purchases 35 25 16 24 45
Servicing from securitizations or asset transfers 69 33 33 26 52
Amortization (71) (68) (69) (66) (68)
Balance, end of quarter (1) $ 1,430 1,397 1,407 1,427 1,443
Fair value of amortized MSRs:
Beginning of quarter $ 1,813 1,897 2,149 2,288 2,389
End of quarter 1,872 1,813 1,897 2,149 2,288
(1) Commercial amortized MSRs are evaluated for impairment purposes by the following risk strata: agency (GSEs) for multi-family properties and non-agency. There was no valuation allowance recorded for the periods presented on the commercial amortized MSRs.
925
968
- 41 -
Wells Fargo & Company and Subsidiaries FIVE QUARTER CONSOLIDATED MORTGAGE SERVICING (CONTINUED)
Quarter ended
Dec 31, Sep 30, Jun 30, Mar 31, Dec 31, (in millions) 2019 2019 2019 2019 2018
Servicing income, net:
Servicing fees (1) $ 806 841780 830
Changes in fair value of MSRs carried at fair value:
Due to changes in valuation model inputs or assumptions (2) (A) 362 (962) (1,078) (891) (1,246)
Changes due to collection/realization of expected cash flows over time (571) (596) (561) (482) (470)
Total changes in fair value of MSRs carried at fair value (209) (1,558) (1,639) (1,373) (1,716)
Amortization (71) (68) (69) (66) (68)
Net derivative gains (losses) from economic hedges (3) (B) (477) 678 1,155 962
Total servicing income, net $ 23 (142) 277 364
Market-related valuation changes to MSRs, net of hedge results (2)(3) (A)+(B) $ (115) (284) 77 71 (278)
(1) Includes contractually specified servicing fees, late charges and other ancillary revenues, net of unreimbursed direct servicing costs. (2) Refer to the changes in fair value MSRs table on the previous page for more detail. (3) Represents results from economic hedges used to hedge the risk of changes in fair value of MSRs.
Dec 31, Sep 30, Jun 30, Mar 31, Dec 31, (in billions) 2019 2019 2019 2019 2018
Managed servicing portfolio (1):
Residential mortgage servicing:
Serviced for others $ 1,063 1,083 1,107 1,125 1,164
Owned loans serviced (2) 343 346 340 331 334
Subserviced for others 2 3 5 26 4
Total residential servicing 1,408 1,432 1,452 1,482 1,502
Commercial mortgage servicing:
Serviced for others 566 551 548 552 543
Owned loans serviced 124 122 123 122 121
Subserviced for others 9 9 9 9 9
Total commercial servicing 699 682 680 683 673
Total managed servicing portfolio $ 2,107 2,114 2,132 2,165 2,175
Total serviced for others $ 1,629 1,634 1,655 1,677 1,707
Ratio of MSRs to related loans serviced for others 0.79% 0.76 0.82 0.88 0.94
(1) The components of our managed servicing portfolio are presented at unpaid principal balance for loans serviced and subserviced for others and at book value for owned loans serviced. (2) Excludes loans serviced by third parties.
109
- 42 -
Wells Fargo & Company and Subsidiaries SELECTED FIVE QUARTER RESIDENTIAL MORTGAGE PRODUCTION DATA
Quarter ended Dec 31,
2019 Sep 30,
2019 Jun 30,
2019 Mar 31,
2019 Dec 31,
2018
Net gains on mortgage loan origination/sales activities (in millions):
Refinances as a percentage of applications 51% 50 44 44 30
Wells Fargo first mortgage unclosed pipeline, at quarter end $ 33 44 44 32 18
Residential real estate originations:
Purchases as a percentage of originations 50% 60 68 70
Refinances as a percentage of originations 50 40 32 30 22
Total 100% 100 100 100 100
Wells Fargo first mortgage loans (in billions):
Retail $ 27 27 26 14
Correspondent 33 30 27 18 21
Other (2) — 1 — 1 1
Total quarter-to-date $ 60 58 53 33 38
Held-for-investment 18 20 20 11 10
Total year-to-date $ 204 144 86 33 177
(1) Primarily includes the results of sales of modified GNMA loans, interest rate management activities and changes in estimate to the liability for mortgage loan repurchase losses. (2) Consists of home equity loans and lines.
Held-for-sale (B) $ 42 38 33 22 28
Total quarter-to-date $ 60 58 53 33 38
Production margin on residential held-for-sale mortgage originations (A)/(B) 1.21% 1.21 0.98 1.05 0.89