48
MURPHY OIL CORPORATION 0 www.murphyoilcorp.com NYSE: MUR WELLS FARGO WEST COAST ENERGY CONFERENCE JUNE 12, 2019 DAVID R. LOONEY EXECUTIVE VICE PRESIDENT & CHIEF FINANCIAL OFFICER

MURPHY OIL CORPORATION 0www.murphyoi lcorp.com NYSE: MUR
WELLS FARGO WEST COAST ENERGY CONFERENCEJUNE 12, 2019
DAVID R. LOONEYEXECUTIVE VICE PRESIDENT & CHIEF FINANCIAL OFFICER

MURPHY OIL CORPORATION 1www.murphyoi lcorp.com NYSE: MUR
Cautionary Note to U.S. Investors – The United States Securities and Exchange Commission (SEC) requires oil and natural gas companies, in their filings with the SEC, to disclose proved reserves that a company has demonstrated by actual production or conclusive formation tests to be economically and legally producible under existing economic and operating conditions. We may use certain terms in this presentation, such as “resource”, “gross resource”, “recoverable resource”, “net risked PMEAN resource”, “recoverable oil”, “resource base”, “EUR” or “estimated ultimate recovery” and similar terms that the SEC’s rules prohibit us from including in filings with the SEC. The SEC permits the optional disclosure of probable and possible reserves in our filings with the SEC. Investors are urged to consider closely the disclosures and risk factors in our most recent Annual Report on Form 10-K filed with the SEC and any subsequent Quarterly Report on Form 10-Q or Current Report on Form 8-K that we file, available from the SEC’s website.
Forward-Looking Statements – This presentation contains forward-looking statements within the meaning of the Private Securities Litigation Reform Act of 1995. Forward-looking statements are generally identified through the inclusion of words such as “aim”, “anticipate”, “believe”, “drive”, “estimate”, “expect”, “expressed confidence”, “forecast”, “future”, “goal”, “guidance”, “intend”, “may”, “objective”, “outlook”, “plan”, “position”, “potential”, “project”, “seek”, “should”, “strategy”, “target”, “will” or variations of such words and other similar expressions. These statements, which express management’s current views concerning future events or results, are subject to inherent risks and uncertainties. Factors that could cause one or more of these future events or results not to occur as implied by any forward-looking statement include, but are not limited to: our ability to complete the Malaysia divestiture due to the failure to obtain regulatory approvals, the failure of the respective counterparties to perform their obligations under the relevant transaction agreements, the failure to satisfy all closing conditions, or otherwise, increased volatility or deterioration in the success rate of our exploration programs or in our ability to maintain production rates and replace reserves; reduced customer demand for our products due to environmental, regulatory, technological or other reasons; adverse foreign exchange movements; political and regulatory instability in the markets where we do business; natural hazards impacting our operations; any other deterioration in our business, markets or prospects; any failure to obtain necessary regulatory approvals; any inability to service or refinance our outstanding debt or to access debt markets at acceptable prices; and adverse developments in the U.S. or global capital markets, credit markets or economies in general. For further discussion of factors that could cause one or more of these future events or results not to occur as implied by any forward-looking statement, see “Risk Factors” in our most recent Annual Report on Form 10-K filed with the U.S. Securities and Exchange Commission (SEC) and any subsequent Quarterly Report on Form 10-Q or Current Report on Form 8-K that we file, available from the SEC’s website and from Murphy Oil Corporation’s website at http://ir.murphyoilcorp.com. Murphy Oil Corporation undertakes no duty to publicly update or revise any forward-looking statements.
Non-GAAP Financial Measures – This presentation refers to certain forward looking non-GAAP measures such as future “Free Cash Flow” and future “EBITDA”. Definitions of these measures are included in the appendix.
Cautionary Statement & Investor Relations Contacts
Kelly WhitleyVP, Investor Relations & Communications281-675-9107Email: [email protected]
Investor Relations ContactsBryan ArcieroSr. Investor Relations Advisor832-319-5374Email: [email protected]
Megan LarsonSr. Investor Relations Analyst281-675-9470Email: [email protected]

MURPHY OIL CORPORATION 2www.murphyoi lcorp.com NYSE: MUR
Murphy at a Glance2018 Proved Reserves
68%
32%
Onshore Offshore
816 MMBOE 50%
7%
43%
Oil NGL Natural Gas
57% Liquids-
Weighted
NOTE: Includes 129 MMBOE from Malaysia; Excludes 73 MMBOE from LLOG Acquisition
26%
30%
28%
16%US Onshore
Canada Onshore
SE Asia
171 MBOEPD
6% NGL
41% Natural Gas
53% Oil
FY 18 Production
NOTE: Includes 48 MBOEPD from Malaysia
ExplorationOffice Production
MURPHY OIL CORPORATION 3www.murphyoi lcorp.com NYSE: MUR
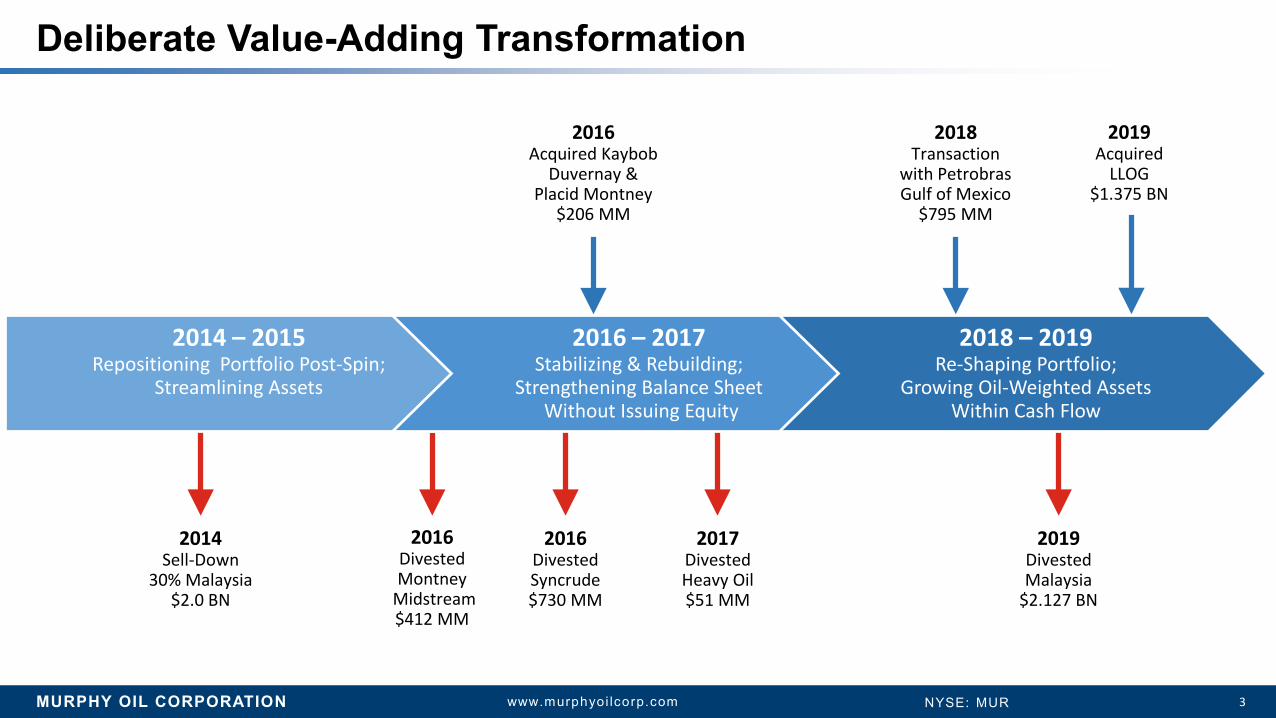
Deliberate Value-Adding Transformation
2014Sell-Down
30% Malaysia$2.0 BN
2016Divested Syncrude$730 MM
2016Divested Montney
Midstream$412 MM
2017Divested Heavy Oil$51 MM
2019Divested Malaysia
$2.127 BN
2014 – 2015Repositioning Portfolio Post-Spin;
Streamlining Assets
2016 – 2017Stabilizing & Rebuilding;
Strengthening Balance SheetWithout Issuing Equity
2018 – 2019Re-Shaping Portfolio;
Growing Oil-Weighted Assets Within Cash Flow
2016Acquired Kaybob
Duvernay & Placid Montney
$206 MM
2018Transaction
with Petrobras Gulf of Mexico
$795 MM
2019Acquired
LLOG$1.375 BN
MURPHY OIL CORPORATION 4www.murphyoi lcorp.com NYSE: MUR
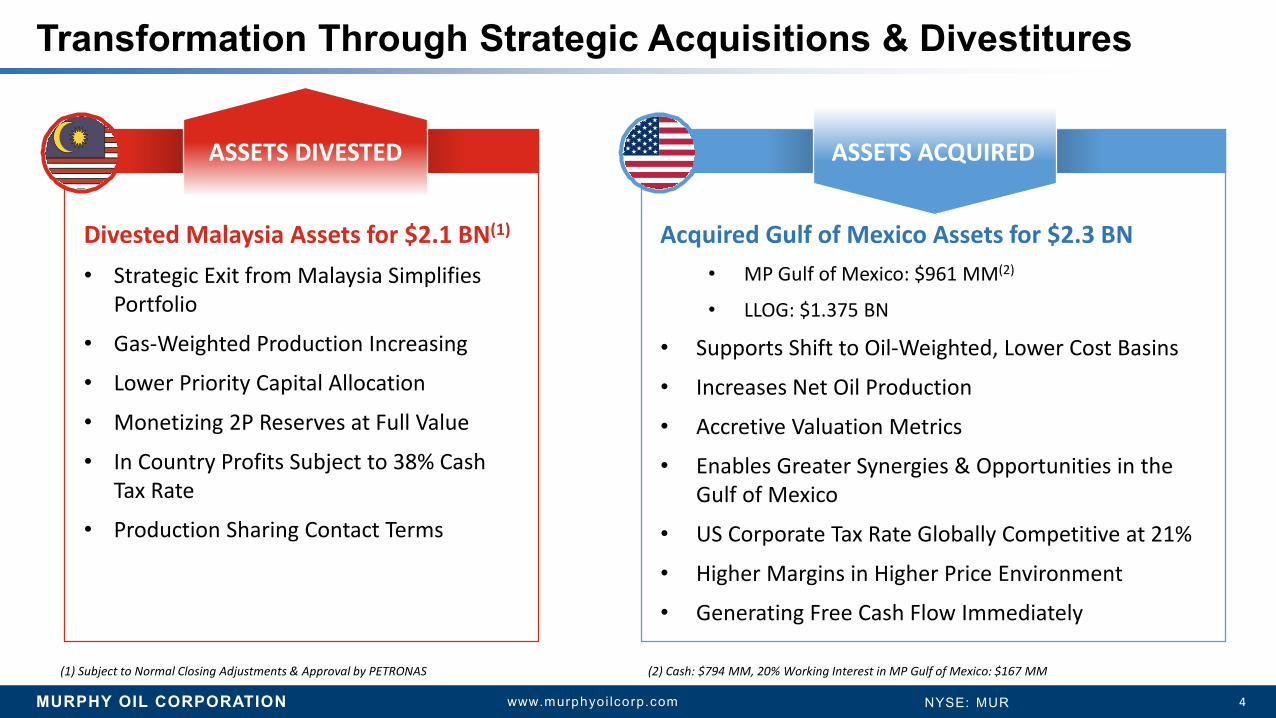
Transformation Through Strategic Acquisitions & Divestitures
Acquired Gulf of Mexico Assets for $2.3 BN• MP Gulf of Mexico: $961 MM(2)
• LLOG: $1.375 BN
• Supports Shift to Oil-Weighted, Lower Cost Basins
• Increases Net Oil Production
• Accretive Valuation Metrics
• Enables Greater Synergies & Opportunities in the Gulf of Mexico
• US Corporate Tax Rate Globally Competitive at 21%
• Higher Margins in Higher Price Environment
• Generating Free Cash Flow Immediately
(2) Cash: $794 MM, 20% Working Interest in MP Gulf of Mexico: $167 MM(1) Subject to Normal Closing Adjustments & Approval by PETRONAS
ASSETS ACQUIRED
Divested Malaysia Assets for $2.1 BN(1)
• Strategic Exit from Malaysia Simplifies Portfolio
• Gas-Weighted Production Increasing
• Lower Priority Capital Allocation
• Monetizing 2P Reserves at Full Value
• In Country Profits Subject to 38% Cash Tax Rate
• Production Sharing Contact Terms
ASSETS DIVESTED

MURPHY OIL CORPORATION 5www.murphyoi lcorp.com NYSE: MUR
Increasing Margins with Oil-Weighted, Gulf of Mexico Production & Reserves
Repositioning Murphy’s Portfolio
Acquisition & Divestiture of Assets2019E Prod
MBOEPD
2019 – 2023Avg Prod MBOEPD
2019 – 2023 Avg Oil Prod
MBOPDReserves (1P)
MMBOE % Oil (1P) % Oil (2P)
Malaysia – Divestiture 46 – 48 50 25 129 39% 40%
Combined GOM – Acquisitions 67 54 44 144(3) 82% 82%
Acquisition & Divestiture of Assets2019E
EBITDA/BOE 2019E EBITDA
Multiple(4)
2019E Free Cash Flow Multiple(4)
$ / Flowing BOE $ / BOE (1P) $ / BOE (2P)
Malaysia – Divestiture $29 4.4x 6.8x ~$45,000 $16.49 $11.13
Combined GOM – Acquisitions $35 2.6x 4.2x ~$28,000 $16.22 $10.59
2019
E EB
ITDA
/ B
OE
2019E Production, MBOEPD
SCALEQUALITY
GOM EBITDA / BOE vs Oil Reserves (2P)
Malaysia
LLOG (+) MP GOM
Oil Reserves (2P)Malaysia
DivestitureGulf of Mexico
Acquisitions
67 MBOEPD
46 - 48 MBOEPD
34(1)
MBOEPD
33(2)
MBOEPD MP GOM
LLOG
2019
Pro
duct
ion
Rate
UPSIDE
2019 – 2023 FCF vs Oil Reserves (2P)$3 BN
$1 BN
$2 BN
2019
E –
2023
E FC
F
Oil Reserves (2P)
Total MurphyPre-Transactions
Total MurphyPost-Transactions
$27
$37
$32
See Footnotes for this Slide in Appendix

MURPHY OIL CORPORATION 6www.murphyoi lcorp.com NYSE: MUR
38%
35%
27%US Onshore
Canada Onshore
NA Offshore
760 MMBOE
8% NGL
38% Natural Gas
54% Oil
35%
33%
16%
16%
US Onshore
Canada Onshore
NA Offshore
Malaysia
816MMBOE
7% NGL
43% Natural Gas
50% Oil
Value-Adding Oil-Weighted Reserve AcquisitionsFY 18 Reserves
Post-Transactions Reserves
• Increasing Liquid-Weighting by 5%
• Maintaining Total Oil Reserves Post-Transactions• > 400 MMBO 1P Reserves with GOM Asset Acquisitions
• Maintaining 1:1 PDP to PUD Ratio
• Realizing Gulf Coast-Focused Premium Pricing on 65% of Reserves
NOTE: Transactions include MP GOM (Excluding Noncontrolling Interest), Malaysia Divestiture, & LLOG Assets Acquisition
$0
$5
$10
$15
$20
$25
$30
2014 2015 2016 2017 2018
$/BO
E
Lowering 3-Year Average F&D Costs

MURPHY OIL CORPORATION 7www.murphyoi lcorp.com NYSE: MUR
Achieving Premium Oil-Weighted Realizations
$5.10/BBLMars
$8.23/BBLBrent
$5.92/BBLMEH
$7.06/BBLLLS
1Q 19 WTI Differentials vs $54.90 WTI
Oil-Weighted Realizations in 1Q 19
• > 90% of Volumes Sold at Premium to $54.90 WTI
• Eagle Ford Shale Realized $57.36/BBL
• NA Offshore Realized $56.31/BBL
30%
26%
29%
8%7%
Mars Brent MEH LLS Other
NOTE: Realized Prices Are Net of Transportation Costs
1Q 19 Sales Volumes of Total CompanyTEXAS
LOUISIANA
GULF OF MEXICO
EAGLE FORD SHALE
HOUMA CLOVELLYHOUSTON
CORPUSCHRISTI
Sales Volumes Exclude Malaysia
MURPHY OIL CORPORATION 8www.murphyoi lcorp.com NYSE: MUR
$0
$200
$400
$600
$800
$1,000
Dividends Special Dividends Repurchases
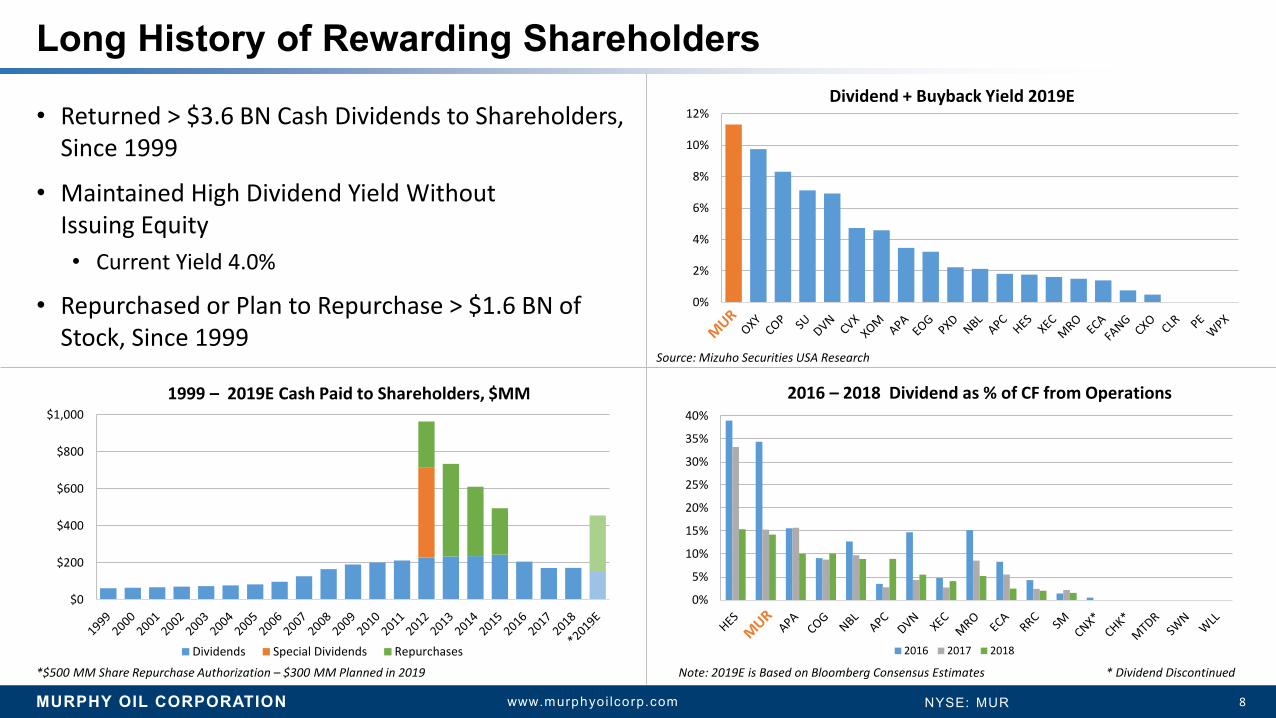
Long History of Rewarding Shareholders
Source: Mizuho Securities USA Research
0%
2%
4%
6%
8%
10%
12%Dividend + Buyback Yield 2019E
1999 – 2019E Cash Paid to Shareholders, $MM
• Returned > $3.6 BN Cash Dividends to Shareholders, Since 1999
• Maintained High Dividend Yield Without Issuing Equity• Current Yield 4.0%
• Repurchased or Plan to Repurchase > $1.6 BN of Stock, Since 1999
*$500 MM Share Repurchase Authorization – $300 MM Planned in 2019
0%
5%
10%
15%
20%
25%
30%
35%
40%
2016 2017 2018
2016 – 2018 Dividend as % of CF from Operations
Note: 2019E is Based on Bloomberg Consensus Estimates * Dividend Discontinued

MURPHY OIL CORPORATION 9www.murphyoi lcorp.com NYSE: MUR
OFFSHORE PORTFOLIO UPDATE
MURPHY OIL CORPORATION 10www.murphyoi lcorp.com NYSE: MUR
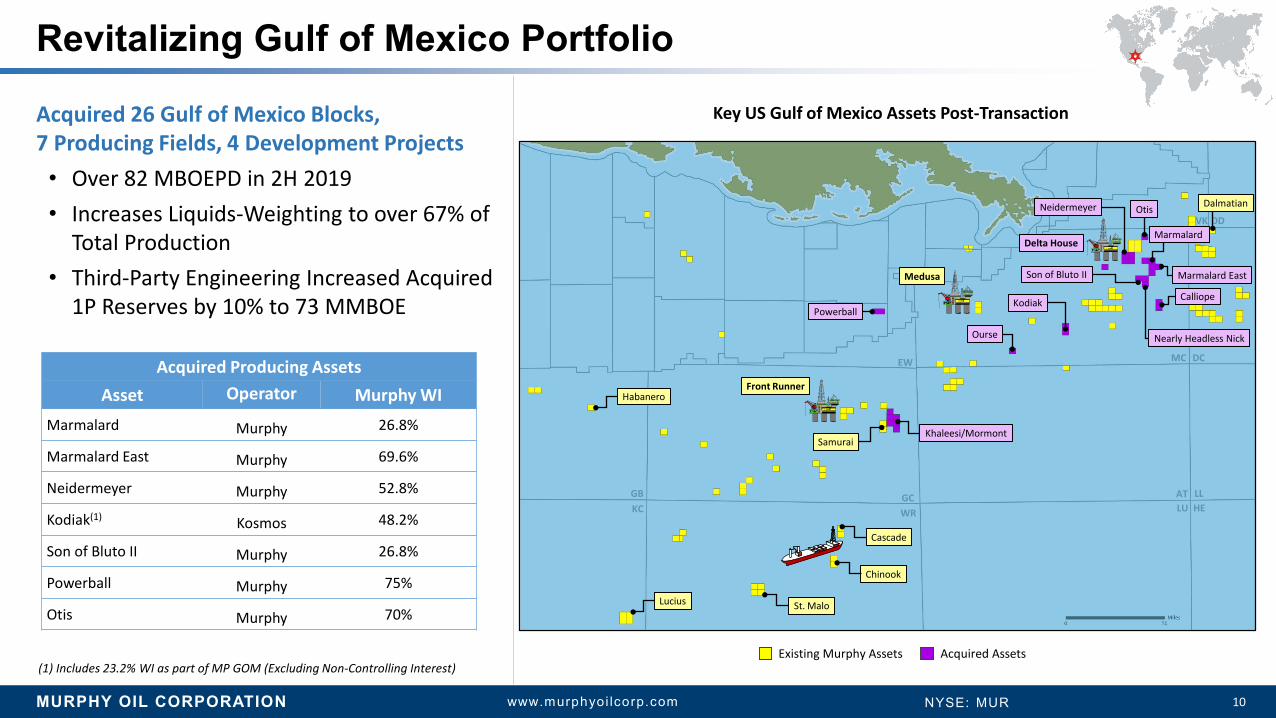
Revitalizing Gulf of Mexico Portfolio
Acquired Producing AssetsAsset Operator Murphy WI
Marmalard Murphy 26.8%
Marmalard East Murphy 69.6%
Neidermeyer Murphy 52.8%
Kodiak(1) Kosmos 48.2%
Son of Bluto II Murphy 26.8%
Powerball Murphy 75%
Otis Murphy 70%
Key US Gulf of Mexico Assets Post-Transaction
(1) Includes 23.2% WI as part of MP GOM (Excluding Non-Controlling Interest)Existing Murphy Assets Acquired Assets
GCWR
EW
KCGB
MC DC
LUAT LL
HE
VK DD
Front Runner
Cascade
Medusa
SamuraiKhaleesi/Mormont
Powerball
Ourse
Kodiak Calliope
OtisNeidermeyer
Son of Bluto II
Nearly Headless Nick
Marmalard East
Marmalard
St. MaloLucius
Habanero
Dalmatian
Chinook
Delta House
Acquired 26 Gulf of Mexico Blocks, 7 Producing Fields, 4 Development Projects• Over 82 MBOEPD in 2H 2019• Increases Liquids-Weighting to over 67% of
Total Production• Third-Party Engineering Increased Acquired
1P Reserves by 10% to 73 MMBOE

MURPHY OIL CORPORATION 11www.murphyoi lcorp.com NYSE: MUR
Efficient Capital Spending Driving Free Cash Flow • Generates ~$1.0 BN Annual Average EBITDA
Per Year• Requires ~$325 MM of Annual Average
Capital Spending• Results in Annual Average Free Cash
Flow ~$675 MM• Achieves Average EBITDA/BOE ~$35
Delivering Free Cash Flow From Gulf of Mexico Assets
WTI $55/BBL, Assuming Full Year Impact of LLOG Transaction Production Volumes, Sales Volumes, Reserves & Financial Amounts Exclude Non-Controlling Interest, Unless Otherwise Stated
(1) Includes Medusa, Front Runner, Dalmatian, Habanero & Kodiak(2) Includes All Development Project Capital (3) LLOG Production on Annualized Basis
MurphyGulf ofMexico2019E
LLOG
MurphyGulf ofMexico
0
10
20
30
40
50
60
70
80
90
2019E BaseProduction
SamuraiDevelopment
Rig Program Multiple Fields
LLOGDevelopment
2023E
MBO
EPD
85
(42)
11
14
8315
$35 MM $65 MM $105 MM $120 MMAnnual Avg
CAPEX ~$325 MM
2019 – 2023 AvgAnnual CAPEX
2019 – 2023 Estimated Gulf of Mexico Production
(2)(1)
(3)

MURPHY OIL CORPORATION 12www.murphyoi lcorp.com NYSE: MUR
Gulf of Mexico• Obtained Regulatory Approval to Operate Assets Acquired from
Petrobras America Inc.• Dalmatian
• 1 Well Program in 2Q 19 – Online 4Q 19
• Medusa• Platform Rig Workover 2Q 19 – Online 3Q 19
• Front Runner• 3 Well Program Commencing in 3Q 19 – Online 1Q 20
• Samurai• Commenced Pre-FEED Activities & Preparing Development Plan 3Q 19
• Non-Operated Projects • Commenced St. Malo Waterflood FEED Activities
Executing in Global Offshore
Front Runner SPAR
Vietnam• Block 15-01/05
• Progressing LDV Field Development Plan, LDV Development Team in Place
• Received Declaration of Commerciality 1Q 19
Net CAPEX Excludes Abandonment Cost
MURPHY OIL CORPORATION 13www.murphyoi lcorp.com NYSE: MUR
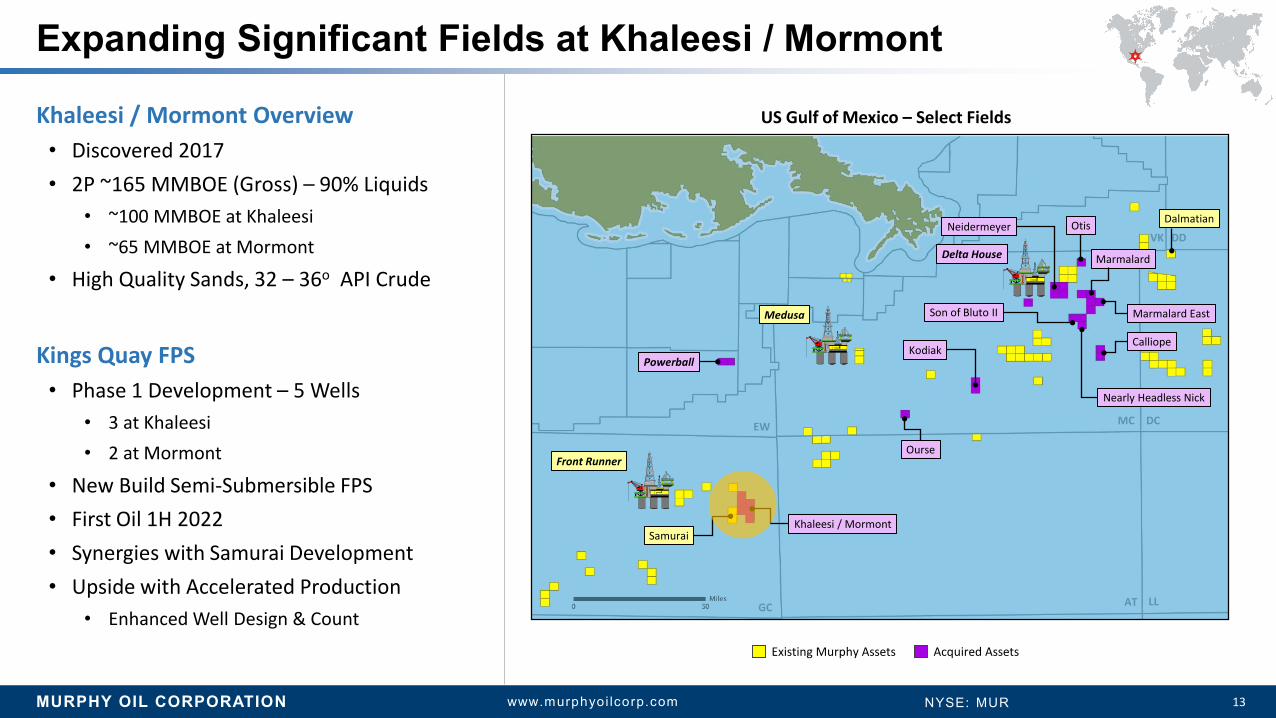
Khaleesi / Mormont Overview• Discovered 2017 • 2P ~165 MMBOE (Gross) – 90% Liquids
• ~100 MMBOE at Khaleesi• ~65 MMBOE at Mormont
• High Quality Sands, 32 – 36o API Crude
Kings Quay FPS• Phase 1 Development – 5 Wells
• 3 at Khaleesi• 2 at Mormont
• New Build Semi-Submersible FPS • First Oil 1H 2022• Synergies with Samurai Development• Upside with Accelerated Production
• Enhanced Well Design & Count
Expanding Significant Fields at Khaleesi / Mormont
US Gulf of Mexico – Select Fields
GC
EW MC DC
AT LL
VK DD
Front Runner
Medusa
SamuraiKhaleesi / Mormont
Powerball
Ourse
KodiakCalliope
OtisNeidermeyer
Son of Bluto II
Nearly Headless Nick
Marmalard East
Marmalard
Dalmatian
Delta House
Existing Murphy Assets Acquired Assets

MURPHY OIL CORPORATION 14www.murphyoi lcorp.com NYSE: MUR
Nearly Headless Nick – Mississippi Canyon 387• ~3.5 Mile Subsea Tie-Back in to Existing Subsea
Manifold – 1 Well Drilled • First Oil 4Q 19
Calliope – Mississippi Canyon 609• 4 Mile Tie-Back to Third Party Platform – 1 Well Drilled • First Oil 4Q 20
Ourse – Mississippi Canyon 895• 4 Mile Tie-Back to Third Party Platform – 1 Well Drilled • Tie-Back to Third Party Platform• First Oil 1Q 21
Acquiring & Developing Low Cost De-Risked Tie-Backs
Medusa
Ourse
KodiakCalliope
OtisNeidermeyer
Son of Bluto II Marmalard East
Marmalard
Dalmatian
Delta House
EWMC DC
VK DD
Nearly Headless Nick
US Gulf of Mexico – Mississippi Canyon Area
Existing Murphy Assets Acquired Assets
Net CAPEX excludes Abandonment Cost
MURPHY OIL CORPORATION 15www.murphyoi lcorp.com NYSE: MUR
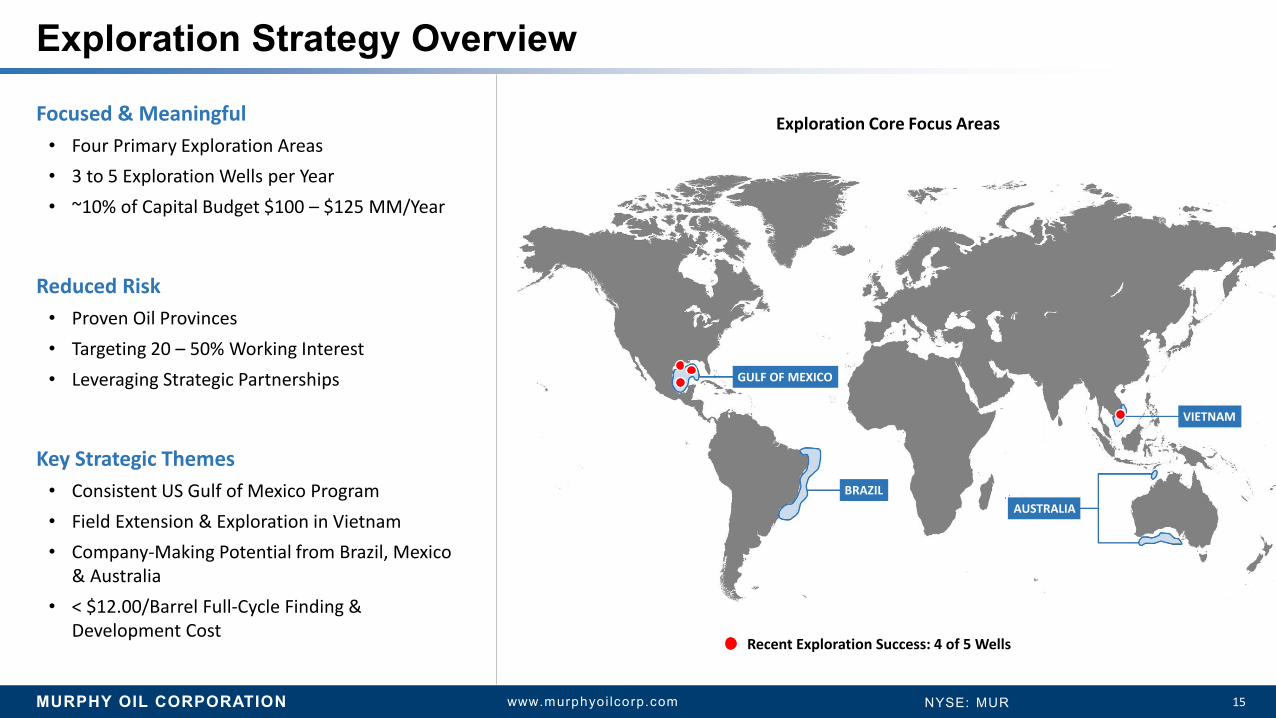
Focused & Meaningful• Four Primary Exploration Areas• 3 to 5 Exploration Wells per Year• ~10% of Capital Budget $100 – $125 MM/Year
Reduced Risk• Proven Oil Provinces• Targeting 20 – 50% Working Interest• Leveraging Strategic Partnerships
Key Strategic Themes• Consistent US Gulf of Mexico Program• Field Extension & Exploration in Vietnam• Company-Making Potential from Brazil, Mexico
& Australia• < $12.00/Barrel Full-Cycle Finding &
Development Cost
Exploration Strategy Overview
Exploration Core Focus Areas
GULF OF MEXICO
BRAZILAUSTRALIA
VIETNAM
Recent Exploration Success: 4 of 5 Wells
MURPHY OIL CORPORATION 16www.murphyoi lcorp.com NYSE: MUR
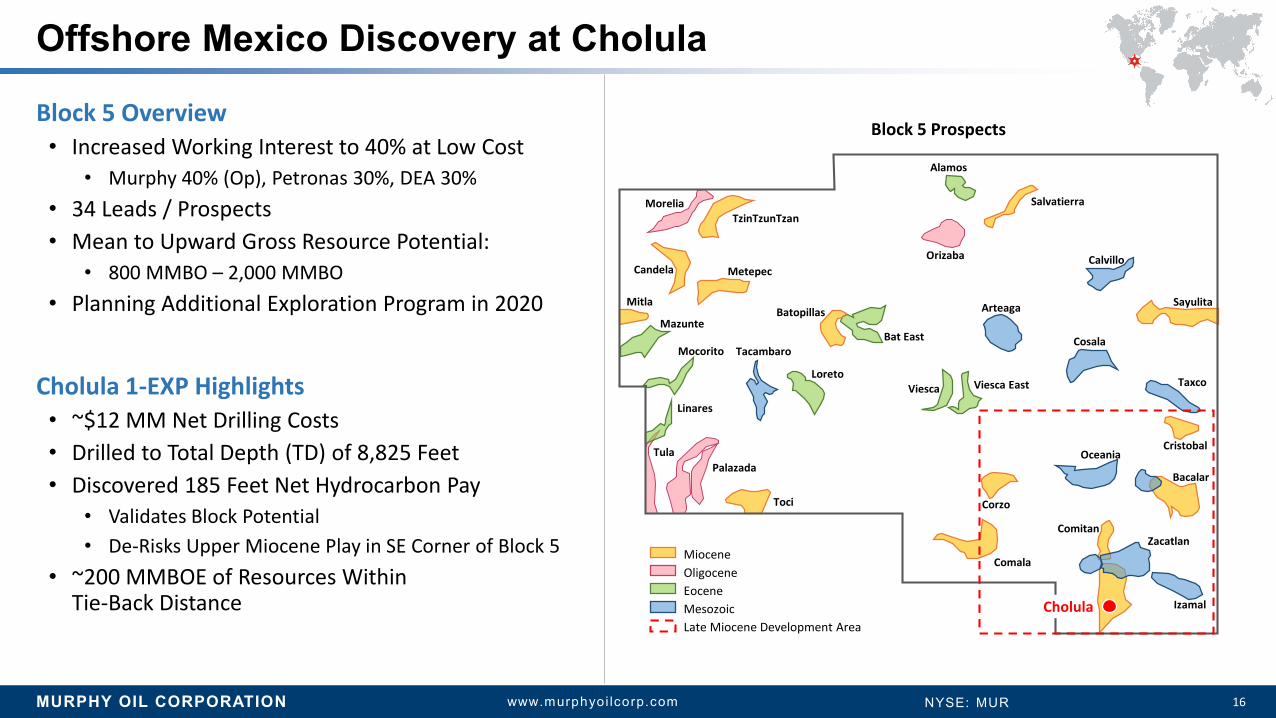
Block 5 Overview• Increased Working Interest to 40% at Low Cost
• Murphy 40% (Op), Petronas 30%, DEA 30%• 34 Leads / Prospects• Mean to Upward Gross Resource Potential:
• 800 MMBO – 2,000 MMBO• Planning Additional Exploration Program in 2020
Cholula 1-EXP Highlights• ~$12 MM Net Drilling Costs• Drilled to Total Depth (TD) of 8,825 Feet• Discovered 185 Feet Net Hydrocarbon Pay
• Validates Block Potential • De-Risks Upper Miocene Play in SE Corner of Block 5
• ~200 MMBOE of Resources WithinTie-Back Distance
Offshore Mexico Discovery at Cholula
Block 5 Prospects
MioceneOligoceneEoceneMesozoicLate Miocene Development Area
MoreliaTzinTzunTzan
Candela
Batopillas
Bat East
Corzo
OceaniaCristobal
Bacalar
Comitan
Toci
PalazadaTula
Linares
Mitla
Mazunte
Mocorito Tacambaro
LoretoViesca Viesca East
Alamos
Salvatierra
Orizaba
Arteaga
Calvillo
Sayulita
Cosala
Taxco
Zacatlan
Izamal
Metepec
Cholula
Comala

MURPHY OIL CORPORATION 17www.murphyoi lcorp.com NYSE: MUR
BLOCK 15-1/05
LDV-4X
LDV-2X
GRANITE
5km
LDN-3X
LDV-1X
Additional LDV Near-Field Potential
Note: Volumes Refer to Gross Mean Resources
LDV-3X
LDT-1XLDV FieldAdditional “G” ProspectsAdditional “D” Prospects
LDT-1X39 MMBO
LDT North18 MMBOE
LDC South15 MMBOE
LDV FieldUp To 100 MMBOE
First Oil 2021
LDV South16 MMBOE
LDH “D”240 MMBOE
LDT West11 MMBOE
LDC North14 MMBOE
Offshore Vietnam Discovery at LDT-1X
Cuu Long Basin Overview• Murphy 40% (Op), PVEP 35%, SKI 25%• > 400 MMBOE Remaining Resource Potential on Block
Cuu Long Basin – LDT-1X Exploration Well• ~$13 MM Net Drilling Costs• Drilled to Total Depth (TD) of 14,100 Feet
• 62 Feet of Net Pay in Secondary “D” Sequence• 318 Feet of Net Pay in Primary “G” Sequence Target
• Estimated Discovered Resources ~39 MMBO• Additional Resource Potential in “D” Sequence Pay

MURPHY OIL CORPORATION 18www.murphyoi lcorp.com NYSE: MUR
Summary of Shareholder Support
ONSHORE PORTFOLIO UPDATE
MURPHY OIL CORPORATION 19www.murphyoi lcorp.com NYSE: MUR
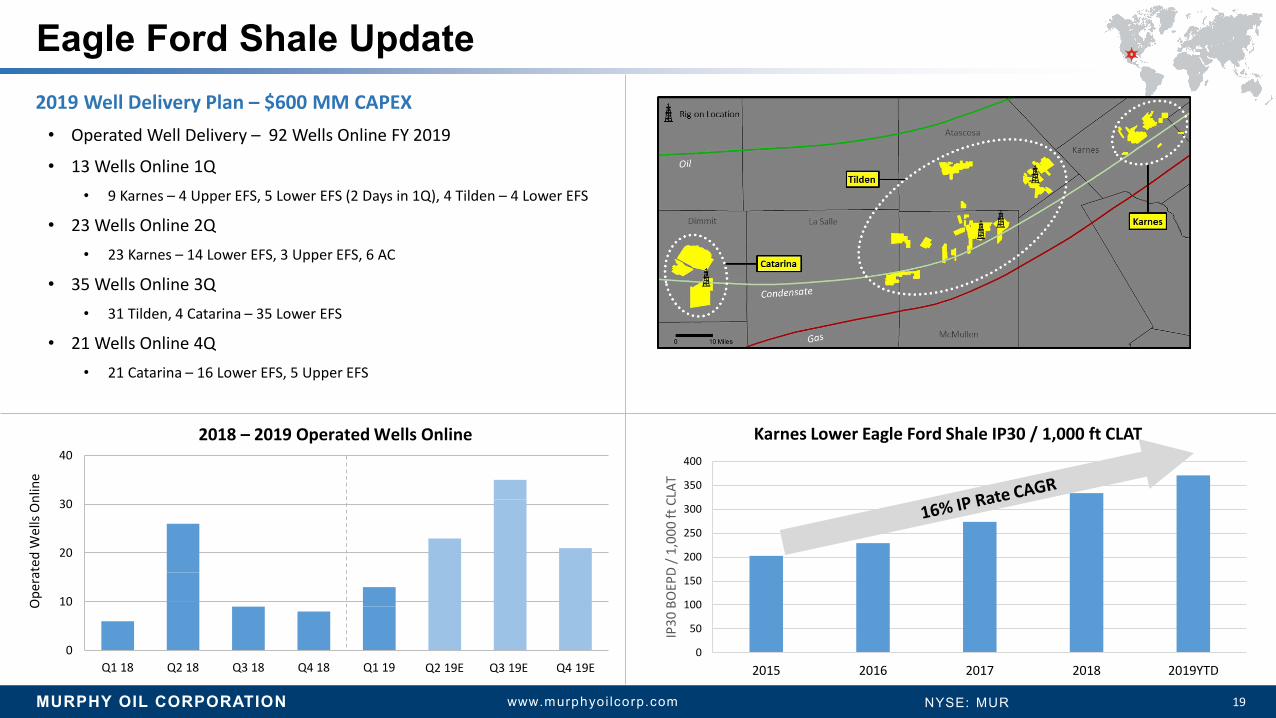
2019 Well Delivery Plan – $600 MM CAPEX• Operated Well Delivery – 92 Wells Online FY 2019
• 13 Wells Online 1Q • 9 Karnes – 4 Upper EFS, 5 Lower EFS (2 Days in 1Q), 4 Tilden – 4 Lower EFS
• 23 Wells Online 2Q • 23 Karnes – 14 Lower EFS, 3 Upper EFS, 6 AC
• 35 Wells Online 3Q • 31 Tilden, 4 Catarina – 35 Lower EFS
• 21 Wells Online 4Q• 21 Catarina – 16 Lower EFS, 5 Upper EFS
Eagle Ford Shale Update
2018 – 2019 Operated Wells Online
0
10
20
30
40
Q1 18 Q2 18 Q3 18 Q4 18 Q1 19 Q2 19 Q3 19 Q4 19
Ope
rate
d W
ells
Onl
ine
Q2 19E Q3 19E Q4 19E
Karnes Lower Eagle Ford Shale IP30 / 1,000 ft CLAT
0
50
100
150
200
250
300
350
400
2015 2016 2017 2018 2019YTDIP
30 B
OEP
D / 1
,000
ft C
LAT
MURPHY OIL CORPORATION 20www.murphyoi lcorp.com NYSE: MUR
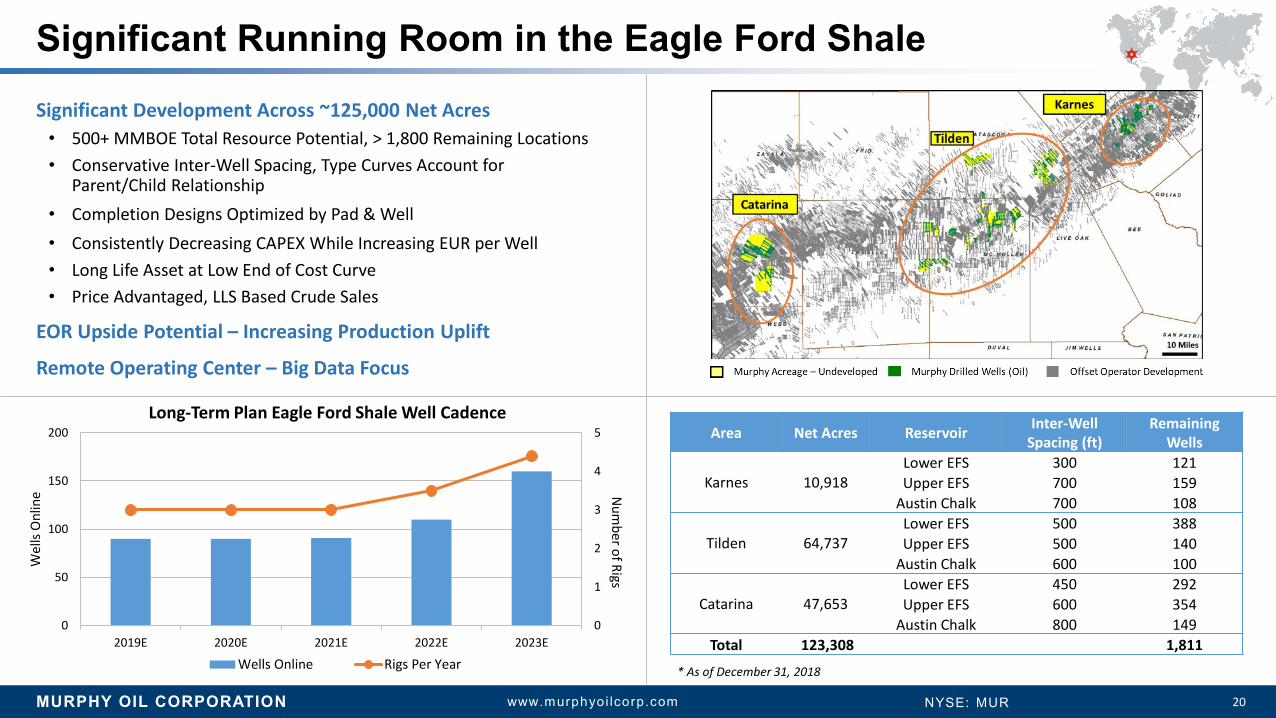
Significant Running Room in the Eagle Ford Shale
0
1
2
3
4
5
2019E 2020E 2021E 2022E 2023E0
50
100
150
200
Num
ber of Rigs
Wel
ls O
nlin
e
Wells Online Rigs Per Year
Long-Term Plan Eagle Ford Shale Well Cadence
* As of December 31, 2018
Area Net Acres Reservoir Inter-Well Spacing (ft)
Remaining Wells
Karnes 10,918Lower EFS 300 121Upper EFS 700 159
Austin Chalk 700 108
Tilden 64,737Lower EFS 500 388Upper EFS 500 140
Austin Chalk 600 100
Catarina 47,653Lower EFS 450 292Upper EFS 600 354
Austin Chalk 800 149Total 123,308 1,811
Significant Development Across ~125,000 Net Acres • 500+ MMBOE Total Resource Potential, > 1,800 Remaining Locations• Conservative Inter-Well Spacing, Type Curves Account for
Parent/Child Relationship• Completion Designs Optimized by Pad & Well• Consistently Decreasing CAPEX While Increasing EUR per Well• Long Life Asset at Low End of Cost Curve• Price Advantaged, LLS Based Crude Sales
EOR Upside Potential – Increasing Production Uplift
Remote Operating Center – Big Data Focus
MURPHY OIL CORPORATION 21www.murphyoi lcorp.com NYSE: MUR
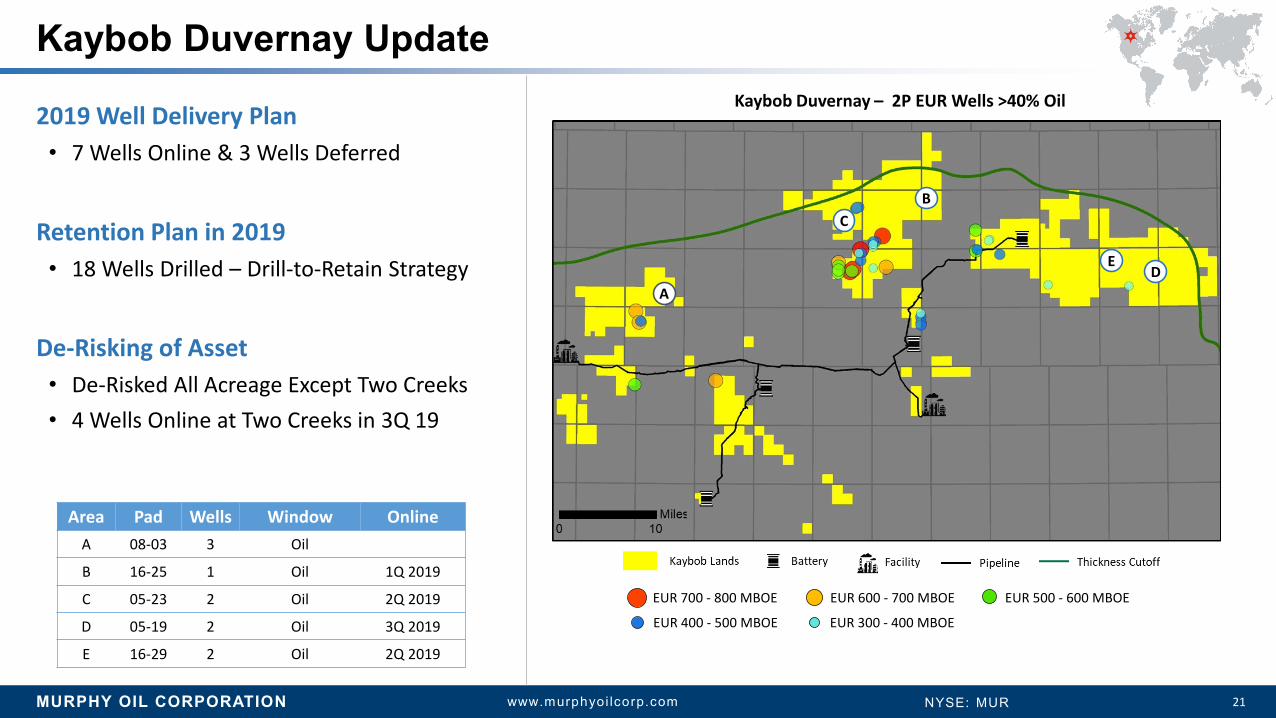
2019 Well Delivery Plan• 7 Wells Online & 3 Wells Deferred
Retention Plan in 2019 • 18 Wells Drilled – Drill-to-Retain Strategy
De-Risking of Asset• De-Risked All Acreage Except Two Creeks• 4 Wells Online at Two Creeks in 3Q 19
Kaybob Duvernay Update
Area Pad Wells Window OnlineA 08-03 3 Oil
B 16-25 1 Oil 1Q 2019
C 05-23 2 Oil 2Q 2019
D 05-19 2 Oil 3Q 2019
E 16-29 2 Oil 2Q 2019
Kaybob Duvernay – 2P EUR Wells >40% Oil
EUR 700 - 800 MBOE EUR 600 - 700 MBOE EUR 500 - 600 MBOE
EUR 400 - 500 MBOE EUR 300 - 400 MBOE
B
DE
C
A

MURPHY OIL CORPORATION 22www.murphyoi lcorp.com NYSE: MUR
Optimizing Kaybob Duvernay
Cashless Acreage Swap• Acquired 19,840 Acres in Kaybob East and Two Creeks
• Adds >50 Well Locations• High Rate, Oily Wells• Optimized Development Plan and Lateral Lengths
• Divested 5,760 Acres in Simonette• Not in Retention Plan
Well Results with Gen 5 Completions• Kaybob North
• 05-23 2-Well Pad• Average 10-Day IP > 1,400 BOEPD (89% Liq)
• Two Creeks • 16-29 2-Well Pad• Average 24-Hour IP > 2,250 BOEPD (89% Liq)
• Targeting $6.5 MM Drilling & Completions Costs per Well
100 Miles
SimonetteKaybob North BatteryNet Pay CutoffDivested Land
FacilityTwo CreeksKaybob WestAcquired LandSaxonKaybob East PipelineAcquired Land
Kaybob Duvernay – Acreage Swap

MURPHY OIL CORPORATION 23www.murphyoi lcorp.com NYSE: MUR
Mitigating AECO Exposure – 1Q 19 Montney Natural Gas Sales
44%
26%
17%
9% 4%AECO Price Exposure
Hedged
Chicago Price Exposure
Malin Price Exposure
Dawn Price Exposure
2019 Well Delivery Plan• Operated Well Delivery – 8 Wells Online FY 2019• ~$55 MM CAPEX
Long-Term Plan • Limited Spend of ~$50 MM Average per Year
Successful AECO Price Mitigation• Realized 1Q 19 C$2.98/MCF* vs AECO Realized
Avg of C$2.62/MCF• Projected FY19 C$2.13/MCF* vs AECO Realized
Avg of C$1.52/MCF
Delivering Low Cost Production in Tupper Montney
*C$0.27 of Transportation Cost Not Subtracted
$0
*C$0.27 of Transportation Cost Not Subtracted

MURPHY OIL CORPORATION 24www.murphyoi lcorp.com NYSE: MUR
LOOKING AHEAD

MURPHY OIL CORPORATION 25www.murphyoi lcorp.com NYSE: MUR
200 MBOEPDProduction Rate by 4Q 19
Executing Our Strategy In 2019
68 %Liquids-WeightedProduction in 2H 19
$300MillionShare Re-PurchaseCompleted by YE 19
95 %Sales Volumes at Premium to WTI in 2H 19>
Transforming the Company for Long-Term Success • Strengthening Balance Sheet by Lowering Debt • Increasing Oil-Weighted Production Through Several
Major Transactions• Shifting Production to Tax-Advantaged Region• Achieving Premium Gulf of Mexico Oil-Weighted
Realizations• Continuing to Deliver Steady Production Growth in the
Eagle Ford Shale• Executing Gulf of Mexico Field Development Projects
50 Wells Onlinein Eagle Ford ShaleIn 2H 19
>

MURPHY OIL CORPORATION 26www.murphyoi lcorp.com NYSE: MUR
Providing Solid Five-Year Production Growth• Total Production CAGR ~8%• Oil Production CAGR ~12%
Balancing Onshore / Offshore Portfolio• Increases US Onshore Production by 15% CAGR Through
Organic Growth• Multiple Offshore Development Projects to Maintain
High Production Levels
Increasing Free Cash Flow• Generates ~$1.4 BN in Free Cash Flow Over 5 Years After
Dividends• $1 BN Increase in Incremental FCF Compared to
Pre-Transaction Assets
Long-Term Strategy For Cash Flow Generation & Production Growth
WTI $55/BBL, Assuming Full Year Impact of LLOG Transaction Production Volumes, Sales Volumes, Reserves & Financial Amounts Exclude Non-Controlling Interest, Unless Otherwise Stated
(1) Also Includes Samurai Development(2) NA Offshore includes US Gulf of Mexico and Offshore Canada
CANOnshore
CANOnshore
USOnshore
USOnshore
USOnshore
NAOffshore
NAOffshore
Malaysia Malaysia
Other
LLOG (+) MP GOM
SE Asia
0
50
100
150
200
250
2018A MalaysiaDivestiture
Gulf of MexicoAcquisitions
OrganicGrowth
2023E
MBO
EPD
2018A – 2023E Production Growth
(1)

MURPHY OIL CORPORATION 27www.murphyoi lcorp.com NYSE: MUR
Positioning Company for Long-Term Value Creation
Transforming Company Drives Further Profitable Oil-Weighted Growth
Producing Oil-Weighted Assets that Realize Premium Pricing
Focusing on Shareholder Priorities
Ramping Eagle Ford Shale with Significant Well Additions
Executing Short Cycle Gulf of Mexico Field Development Projects
Offering Investors Exploration Upside by De-Risking Acreage

MURPHY OIL CORPORATION 28www.murphyoi lcorp.com NYSE: MUR
WELLS FARGO WEST COAST ENERGY CONFERENCEJUNE 12, 2019
DAVID R. LOONEYEXECUTIVE VICE PRESIDENT & CHIEF FINANCIAL OFFICER

MURPHY OIL CORPORATION 29www.murphyoi lcorp.com NYSE: MUR
APPENDIX
MURPHY OIL CORPORATION 30www.murphyoi lcorp.com NYSE: MUR
Appendix
Non-GAAP Reconciliation
Abbreviations
Guidance
Hedging Positions
MURPHY OIL CORPORATION 31www.murphyoi lcorp.com NYSE: MUR
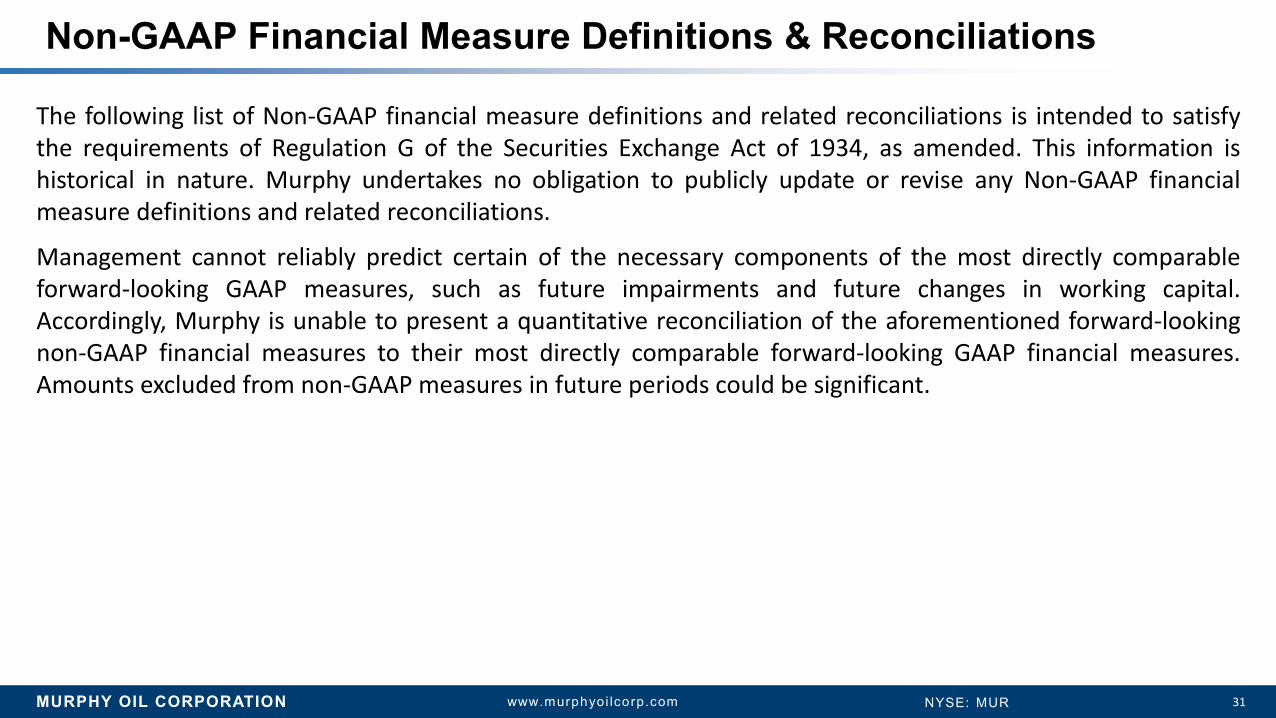
Non-GAAP Financial Measure Definitions & Reconciliations
The following list of Non-GAAP financial measure definitions and related reconciliations is intended to satisfythe requirements of Regulation G of the Securities Exchange Act of 1934, as amended. This information ishistorical in nature. Murphy undertakes no obligation to publicly update or revise any Non-GAAP financialmeasure definitions and related reconciliations.
Management cannot reliably predict certain of the necessary components of the most directly comparableforward-looking GAAP measures, such as future impairments and future changes in working capital.Accordingly, Murphy is unable to present a quantitative reconciliation of the aforementioned forward-lookingnon-GAAP financial measures to their most directly comparable forward-looking GAAP financial measures.Amounts excluded from non-GAAP measures in future periods could be significant.
MURPHY OIL CORPORATION 32www.murphyoi lcorp.com NYSE: MUR
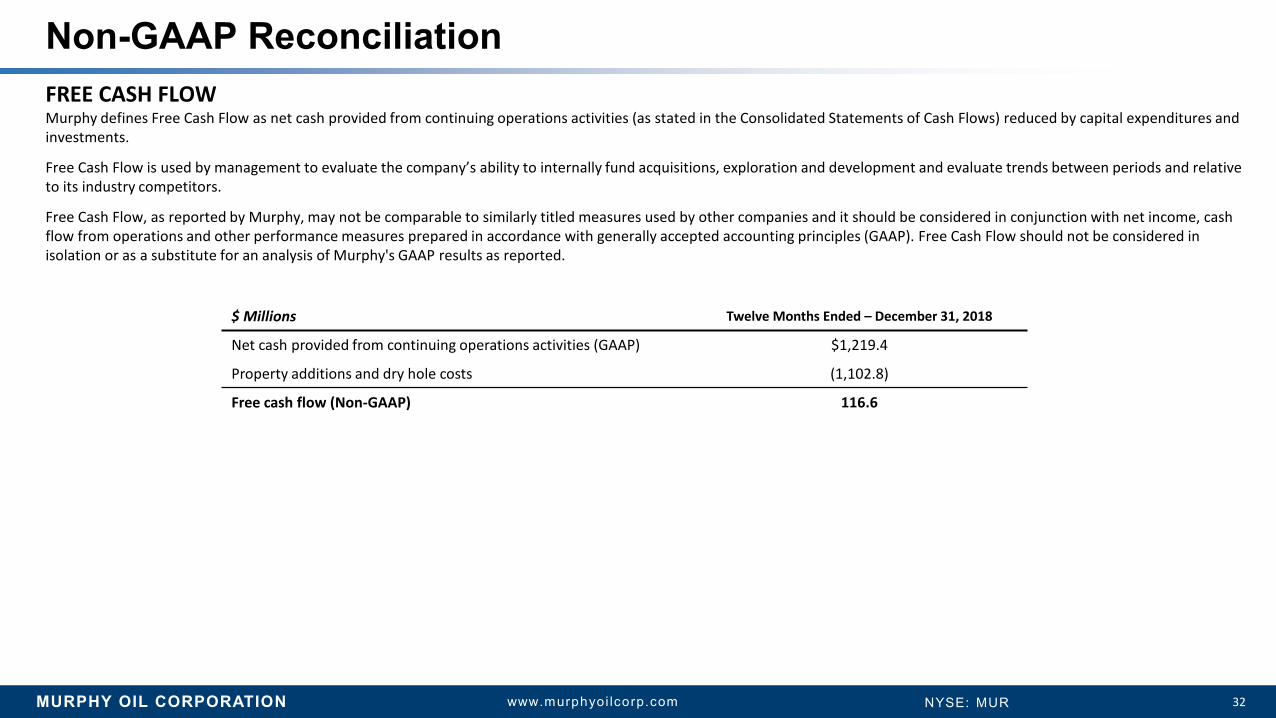
Non-GAAP ReconciliationFREE CASH FLOWMurphy defines Free Cash Flow as net cash provided from continuing operations activities (as stated in the Consolidated Statements of Cash Flows) reduced by capital expenditures and investments.
Free Cash Flow is used by management to evaluate the company’s ability to internally fund acquisitions, exploration and development and evaluate trends between periods and relative to its industry competitors.
Free Cash Flow, as reported by Murphy, may not be comparable to similarly titled measures used by other companies and it should be considered in conjunction with net income, cash flow from operations and other performance measures prepared in accordance with generally accepted accounting principles (GAAP). Free Cash Flow should not be considered in isolation or as a substitute for an analysis of Murphy's GAAP results as reported.
$ Millions Twelve Months Ended – December 31, 2018
Net cash provided from continuing operations activities (GAAP) $1,219.4
Property additions and dry hole costs (1,102.8)
Free cash flow (Non-GAAP) 116.6
MURPHY OIL CORPORATION 33www.murphyoi lcorp.com NYSE: MUR
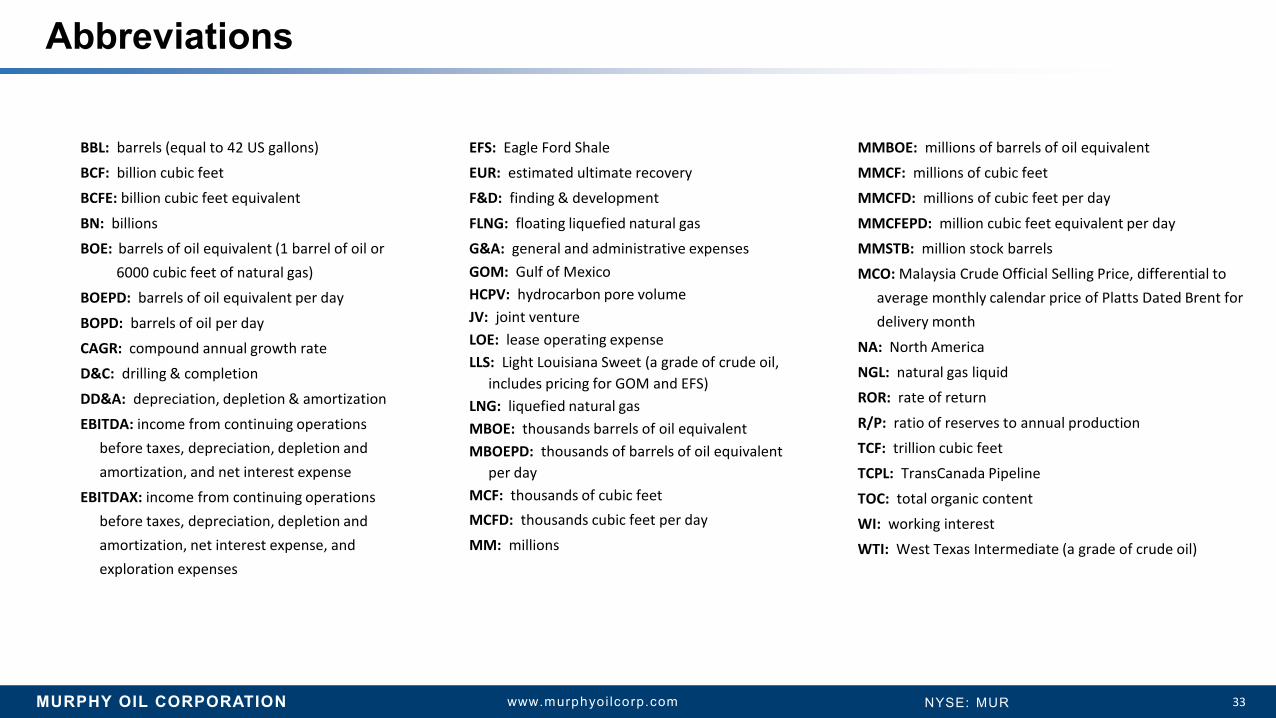
Abbreviations
BBL: barrels (equal to 42 US gallons)BCF: billion cubic feetBCFE: billion cubic feet equivalent
BN: billionsBOE: barrels of oil equivalent (1 barrel of oil or
6000 cubic feet of natural gas)BOEPD: barrels of oil equivalent per day
BOPD: barrels of oil per dayCAGR: compound annual growth rateD&C: drilling & completion
DD&A: depreciation, depletion & amortization
EBITDA: income from continuing operations before taxes, depreciation, depletion and amortization, and net interest expense
EBITDAX: income from continuing operations before taxes, depreciation, depletion and amortization, net interest expense, and exploration expenses
MMBOE: millions of barrels of oil equivalentMMCF: millions of cubic feetMMCFD: millions of cubic feet per day
MMCFEPD: million cubic feet equivalent per dayMMSTB: million stock barrelsMCO: Malaysia Crude Official Selling Price, differential to
average monthly calendar price of Platts Dated Brent for delivery month
NA: North AmericaNGL: natural gas liquid
ROR: rate of return
R/P: ratio of reserves to annual productionTCF: trillion cubic feet
TCPL: TransCanada Pipeline
TOC: total organic contentWI: working interestWTI: West Texas Intermediate (a grade of crude oil)
EFS: Eagle Ford ShaleEUR: estimated ultimate recoveryF&D: finding & development
FLNG: floating liquefied natural gasG&A: general and administrative expensesGOM: Gulf of MexicoHCPV: hydrocarbon pore volume JV: joint ventureLOE: lease operating expenseLLS: Light Louisiana Sweet (a grade of crude oil,
includes pricing for GOM and EFS)LNG: liquefied natural gasMBOE: thousands barrels of oil equivalentMBOEPD: thousands of barrels of oil equivalent
per dayMCF: thousands of cubic feetMCFD: thousands cubic feet per day
MM: millions

MURPHY OIL CORPORATION 34www.murphyoi lcorp.com NYSE: MUR
Guidance – 2Q 19
Guidance 2Q 2Q 2019Liquids (BOPD)
2Q 2019Gas (MCFD)
2Q 2019Total (BOEPD)
1Q Production:
US – Eagle Ford Shale 38,800 35,000 44,600
Gulf of Mexico 1 44,700 19,300 47,900
Canada – Tupper Montney – 206,700 34,500
Kaybob Duvernay & Placid Montney 5,700 25,900 10,000
Offshore 7,500 – 7,500
Other 500 – 500
2Q Production Volume (BOEPD) Excluding NCI 3 143,000 – 147,000
2Q Sales Volume (BOEPD) Excluding NCI 142,500 – 146,500
2Q Exploration Expense ($MM) $34.0
Full Year 2019 CAPEX ($BN) Excluding NCI 2 $1.15 to $1.35
1 Excludes Noncontrolling Interest of MP GOM of 11,175 BOPD Liquids & 4,825 MCFD Gas.2 Excludes Noncontrolling Interest of MP GOM of $48 MM.3 Excludes Noncontrolling Interest of MP GOM of 12,000 BOEPD.
MURPHY OIL CORPORATION 35www.murphyoi lcorp.com NYSE: MUR
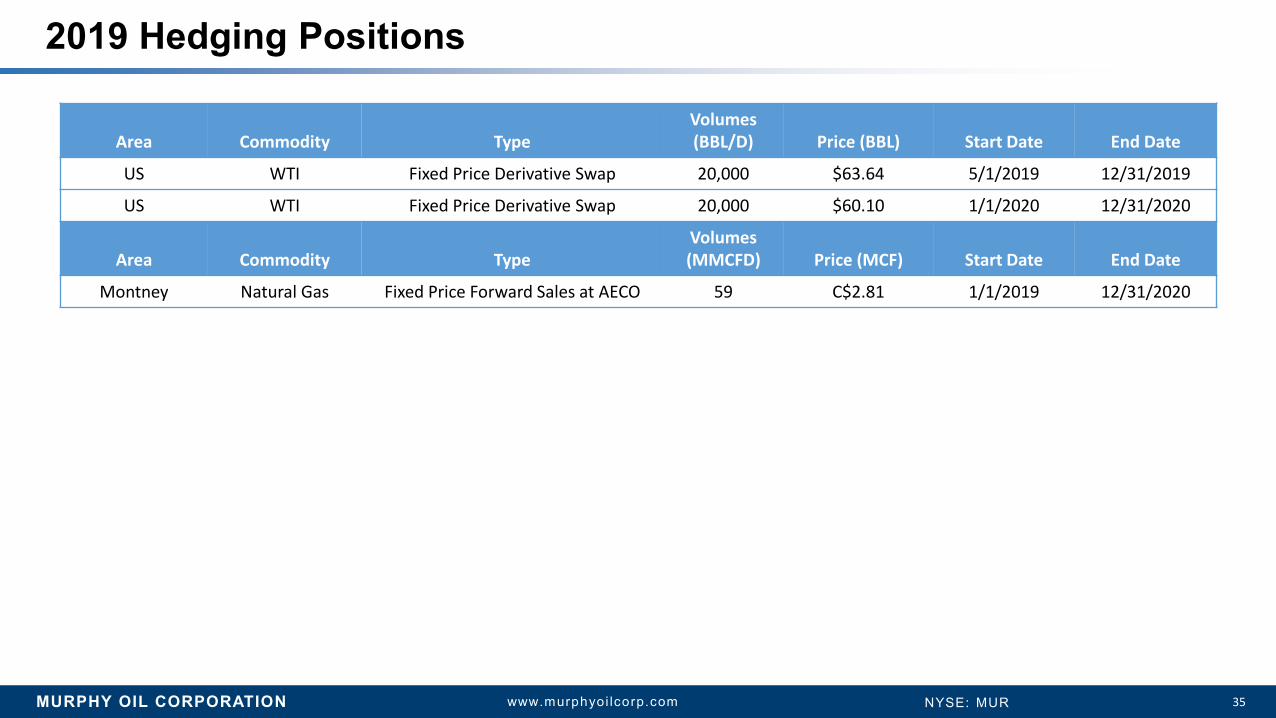
2019 Hedging Positions
Area Commodity TypeVolumes(BBL/D) Price (BBL) Start Date End Date
US WTI Fixed Price Derivative Swap 20,000 $63.64 5/1/2019 12/31/2019
US WTI Fixed Price Derivative Swap 20,000 $60.10 1/1/2020 12/31/2020
Area Commodity TypeVolumes(MMCFD) Price (MCF) Start Date End Date
Montney Natural Gas Fixed Price Forward Sales at AECO 59 C$2.81 1/1/2019 12/31/2020

MURPHY OIL CORPORATION 36www.murphyoi lcorp.com NYSE: MUR
$-
$500
$1,000
$1,500
$2,000
2019
2020
2021
2022
2023
2024
2025
2026
2027
2028
2029
2030
2031
2032
2033
2034
2035
2036
2037
2038
2039
2040
2041
2042
2043
2044
2045
2046
>204
6
$MM
Notes Drawn RCF Undrawn RCF
Financial Position as of March 31, 2019
Note Maturity Profile
• $2.8 BN Total Debt (Excluding Capital Lease)
• Total Liquidity $1.4 BN
• ~$286 MM of Cash & Cash Equivalents
• $325 MM of Borrowings on $1.6 BN Unsecured Senior Credit Facility
• 39% Total Debt to Cap
• 36% Net Debt to Cap
Maturity Profile*
Total Bonds Outstanding $BN $2.8
Weighted Avg Fixed Coupon 5.5%
Weighted Avg Years to Maturity 7.5
*As of March 31, 2019
10 YEAR
20 YEAR 30 YEAR
MURPHY OIL CORPORATION 37www.murphyoi lcorp.com NYSE: MUR
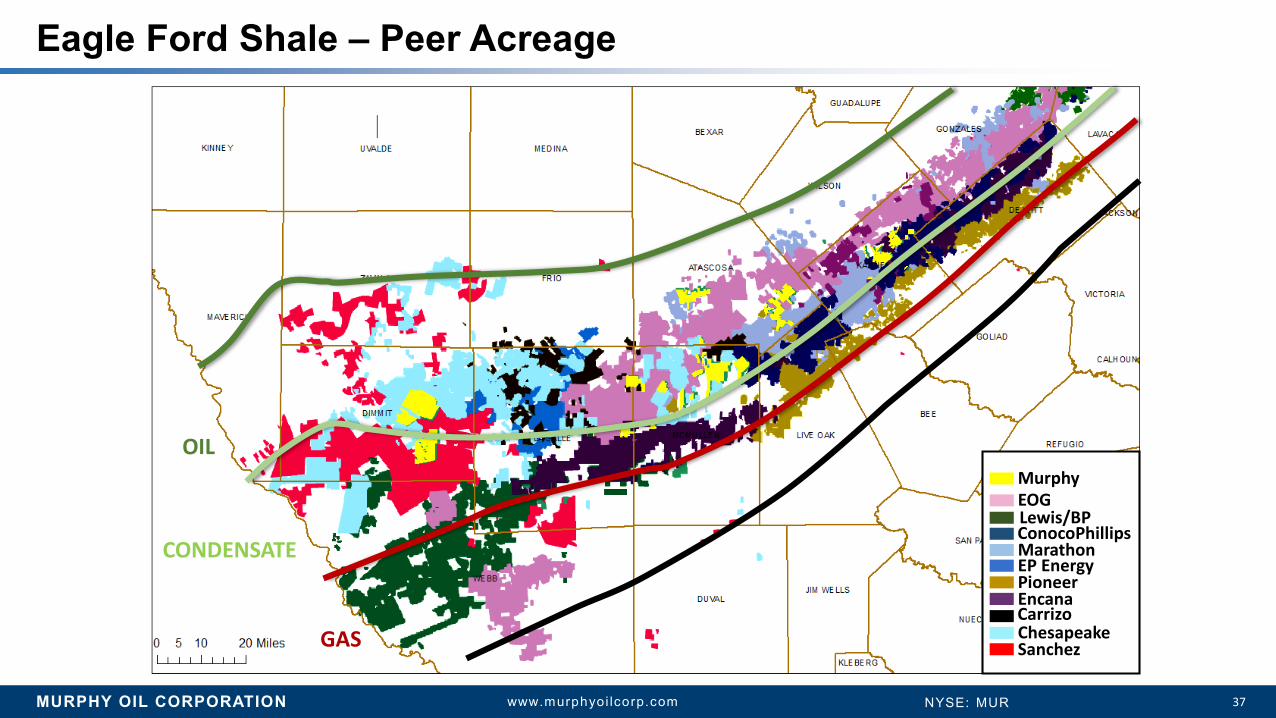
Eagle Ford Shale – Peer Acreage
Pioneer
EOG
EP Energy
Murphy
PioneerEncana
MarathonConocoPhillipsLewis/BP
ChesapeakeSanchez
Carrizo
OIL
CONDENSATE
GAS
MURPHY OIL CORPORATION 38www.murphyoi lcorp.com NYSE: MUR
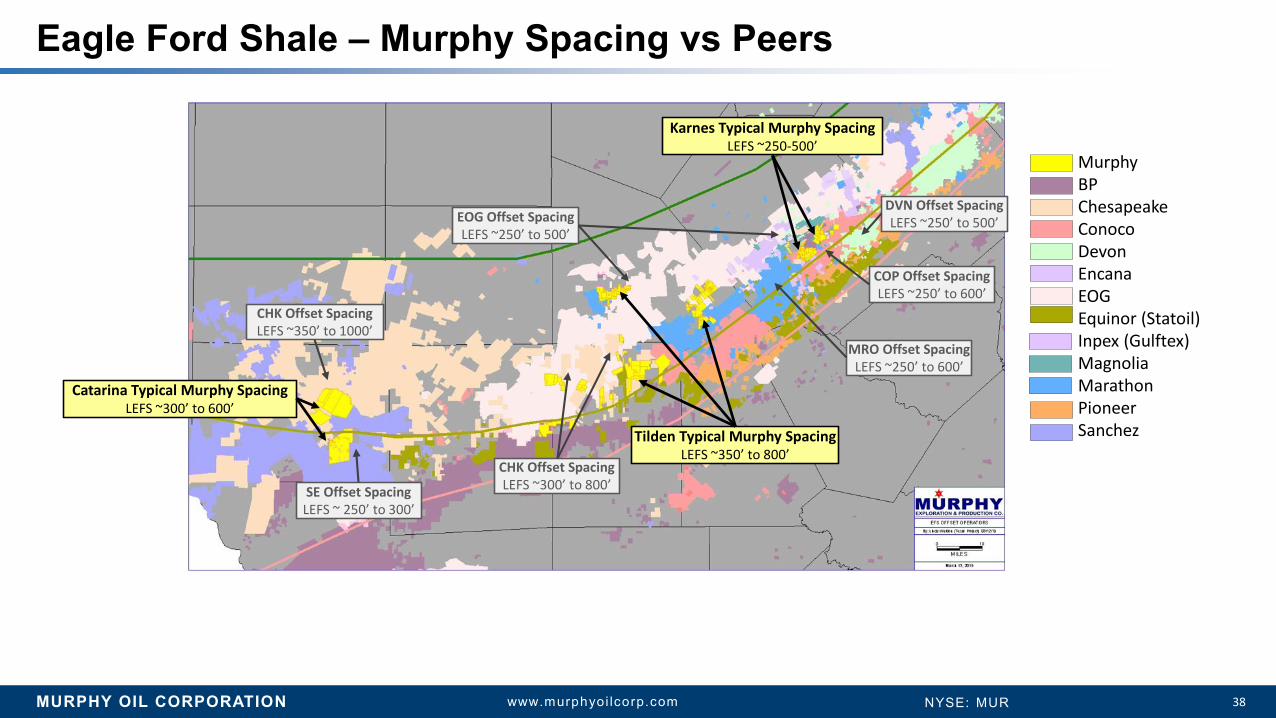
Eagle Ford Shale – Murphy Spacing vs Peers
Murphy BPChesapeakeConocoDevonEncanaEOGEquinor (Statoil)Inpex (Gulftex)MagnoliaMarathonPioneerSanchez
Catarina Typical Murphy SpacingLEFS ~300’ to 600’
Karnes Typical Murphy SpacingLEFS ~250-500’
Tilden Typical Murphy SpacingLEFS ~350’ to 800’
SE Offset SpacingLEFS ~ 250’ to 300’
CHK Offset SpacingLEFS ~350’ to 1000’
CHK Offset SpacingLEFS ~300’ to 800’
EOG Offset SpacingLEFS ~250’ to 500’
MRO Offset SpacingLEFS ~250’ to 600’
COP Offset SpacingLEFS ~250’ to 600’
DVN Offset SpacingLEFS ~250’ to 500’
MURPHY OIL CORPORATION 39www.murphyoi lcorp.com NYSE: MUR
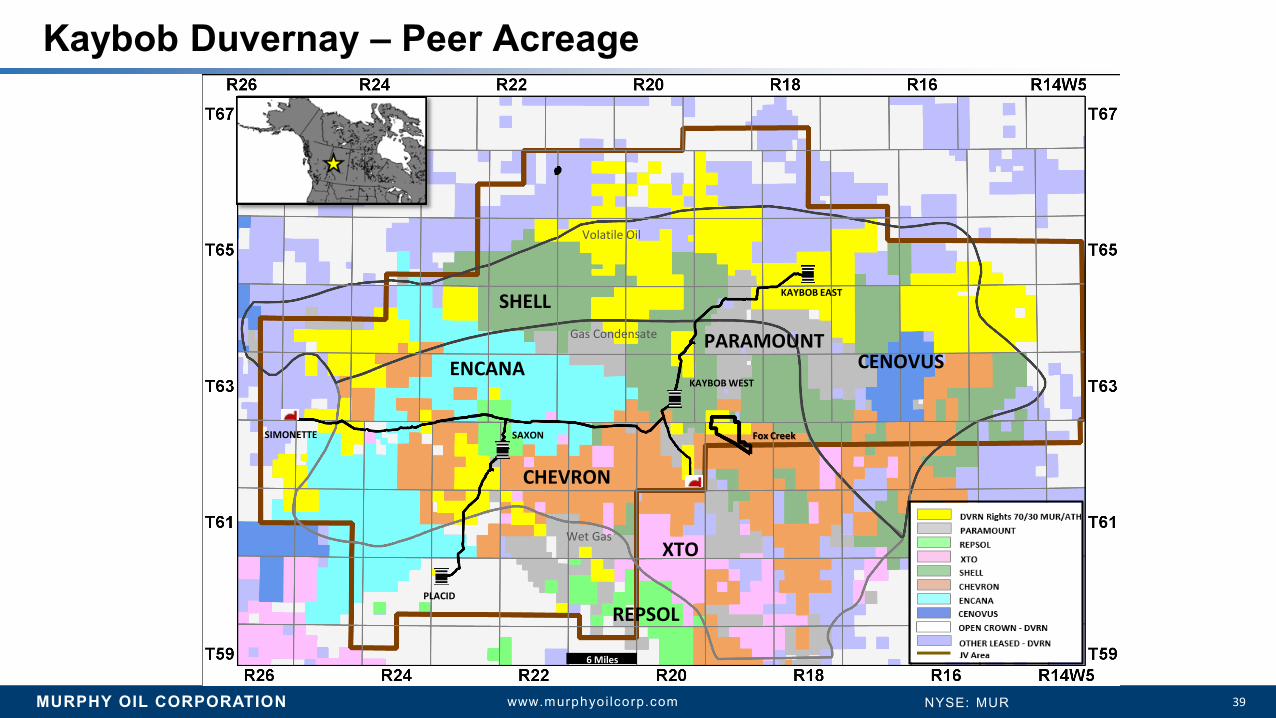
Kaybob Duvernay – Peer Acreage
Fox CreekSAXON
KAYBOB WEST
KAYBOB EAST
ENCANA
SHELL
CHEVRON
PARAMOUNT
XTO
REPSOLPLACID
CENOVUS
6 Miles
Volatile Oil
Gas Condensate
Wet Gas
SIMONETTE

MURPHY OIL CORPORATION 40www.murphyoi lcorp.com NYSE: MUR
Tupper Montney – Peer Acreage

MURPHY OIL CORPORATION 41www.murphyoi lcorp.com NYSE: MUR
Placid Montney – Peer Acreage
Fox Creek
SAXON
KAYBOB WEST
KAYBOB EAST
ENCANA
CHEVRON
PARAMOUNT
XTODELPHIPLACID
CENOVUS
6 Miles
RMP CNRLCIOC
Condensate Limit
SIMONETTE
Dry Gas Limit
MURPHY OIL CORPORATION 42www.murphyoi lcorp.com NYSE: MUR
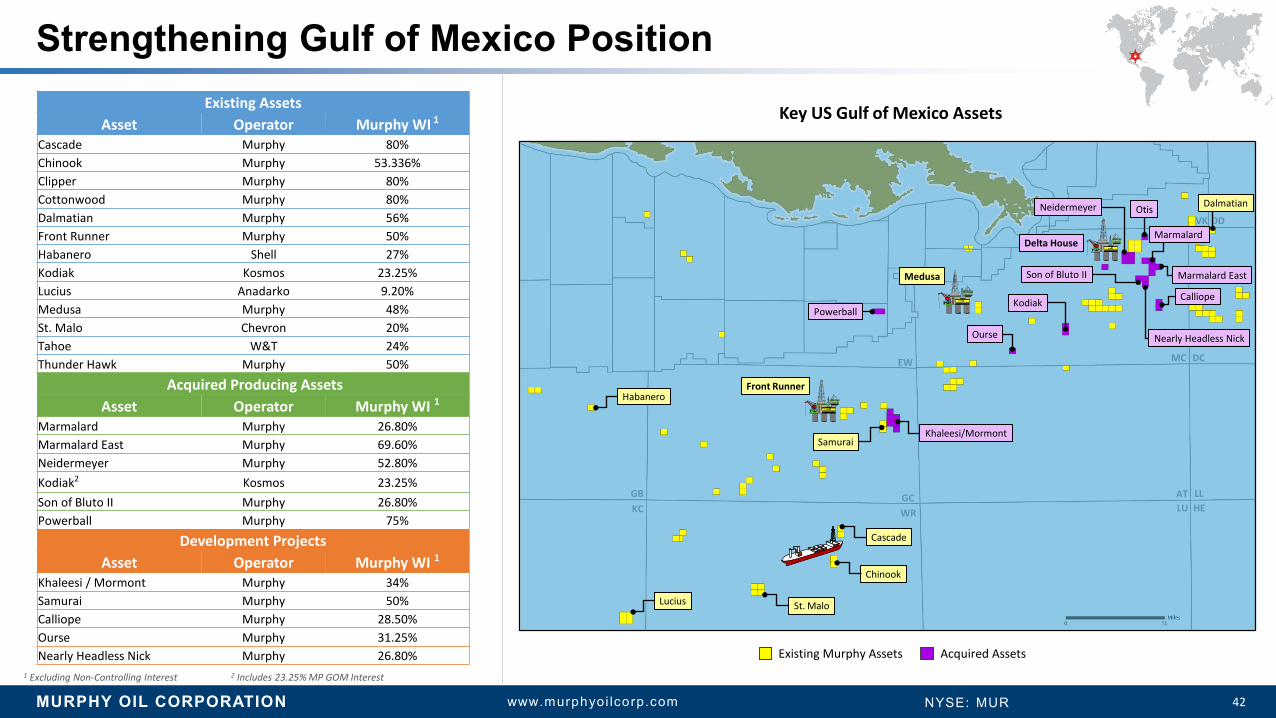
Strengthening Gulf of Mexico Position
1 Excluding Non-Controlling Interest 2 Includes 23.25% MP GOM Interest
Existing AssetsAsset Operator Murphy WI 1
Cascade Murphy 80%Chinook Murphy 53.336%Clipper Murphy 80%Cottonwood Murphy 80%Dalmatian Murphy 56%Front Runner Murphy 50%Habanero Shell 27%Kodiak Kosmos 23.25%Lucius Anadarko 9.20%Medusa Murphy 48%St. Malo Chevron 20%Tahoe W&T 24%Thunder Hawk Murphy 50%
Acquired Producing AssetsAsset Operator Murphy WI 1
Marmalard Murphy 26.80%Marmalard East Murphy 69.60%Neidermeyer Murphy 52.80%Kodiak2 Kosmos 23.25%Son of Bluto II Murphy 26.80%Powerball Murphy 75%
Development ProjectsAsset Operator Murphy WI 1
Khaleesi / Mormont Murphy 34%Samurai Murphy 50%Calliope Murphy 28.50%Ourse Murphy 31.25%Nearly Headless Nick Murphy 26.80%
Key US Gulf of Mexico Assets
Existing Murphy Assets Acquired Assets
GCWR
EW
KCGB
MC DC
LUAT LL
HE
VK DD
Front Runner
Cascade
Medusa
SamuraiKhaleesi/Mormont
Powerball
Ourse
Kodiak Calliope
OtisNeidermeyer
Son of Bluto II
Nearly Headless Nick
Marmalard East
Marmalard
St. MaloLucius
Habanero
Dalmatian
Chinook
Delta House

MURPHY OIL CORPORATION 43www.murphyoi lcorp.com NYSE: MUR
US Gulf of Mexico Exploration Update
Niedermeyer FieldHoffe Park #2
Hoffe Park #1
Salt
Cretaceous
Miocene
~7 Miles
Gulf of Mexico Murphy Lease Map
MC DCAT LL
VK DD
EW
Medusa
Ourse
KodiakCalliope
Otis
Neidermeyer
Son of Bluto II
Nearly Headless Nick
Marmalard East
Marmalard
Dalmatian
AT 95 / 137 / 138
MC 554 / 555
Hoffe Park
GC
Existing Murphy AssetsAcquired Assets1Q Lease Sale
Hoffe Park ProspectHoffe Park – MC 122• Murphy 60% WI, Operator
• Middle Miocene
• Expected Spud 3Q 19
• Gross Resource Potential – 75 MMBOE to 120 MMBOE
• Tieback Synergies With Newly Acquired Assets
• Net Well Cost ~$23 MM
• F&D < $10/BBL
• Break-Even Price $28/BBL
Gulf of Mexico Lease Sale 1Q 19• Captured 5 Blocks
• Mississippi Canyon 554/555 – 70% WI
• Atwater Valley 95/137/138 – 50% WI
• Net Cost $4.7 MM
• ~250 MMBOE Gross Resource

MURPHY OIL CORPORATION 44www.murphyoi lcorp.com NYSE: MUR
Brazil Exploration Update
Renewed Exploration Portfolio with Low-Cost Entry & Long-Term Opportunities in Sergipe-Alagoas Basin
• Murphy 20% (Non-Op), ExxonMobil 50% (Op), QGEP 30%
• 6 Blocks, ~1.1 MM Acres
• Progressing In-House Seismic Program
Cumbe50 MMBOE
Moita Bonita400 MMBOE
Poco Verde80 MMBOE
Muriú320 MMBOE
Barra400 MMBOE
351
428
503501
Farfan400 MMBOE
573
430
MUR Block
Petrobras Block
Discovered FieldField Data Source: IHS
MURPHY OIL CORPORATION 45www.murphyoi lcorp.com NYSE: MUR
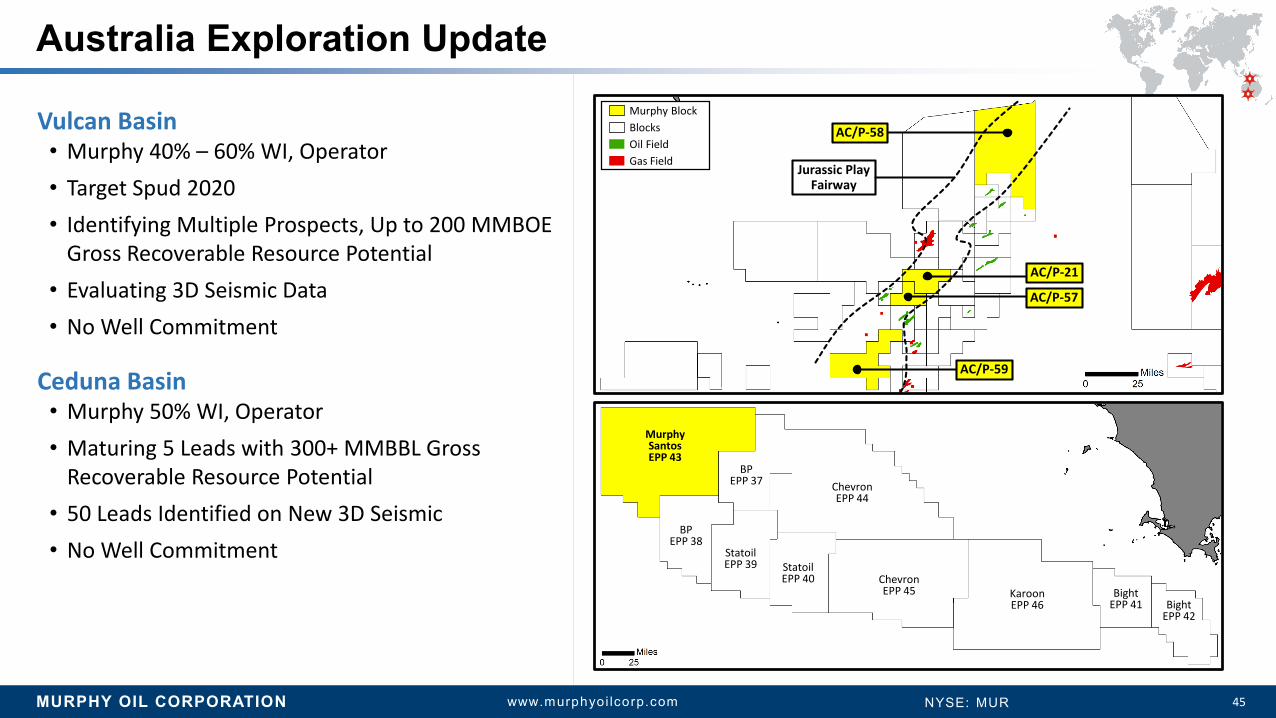
Australia Exploration Update
Vulcan Basin• Murphy 40% – 60% WI, Operator• Target Spud 2020• Identifying Multiple Prospects, Up to 200 MMBOE
Gross Recoverable Resource Potential• Evaluating 3D Seismic Data• No Well Commitment
Ceduna Basin• Murphy 50% WI, Operator• Maturing 5 Leads with 300+ MMBBL Gross
Recoverable Resource Potential• 50 Leads Identified on New 3D Seismic • No Well Commitment
MurphySantosEPP 43
BPEPP 38
BPEPP 37
StatoilEPP 39 Statoil
EPP 40
ChevronEPP 44
ChevronEPP 45 Karoon
EPP 46Bight
EPP 41 BightEPP 42
AC/P-21
AC/P-58
AC/P-57
AC/P-59
Jurassic Play Fairway
Gas Field
BlocksOil Field
Murphy Block
MURPHY OIL CORPORATION 46www.murphyoi lcorp.com NYSE: MUR
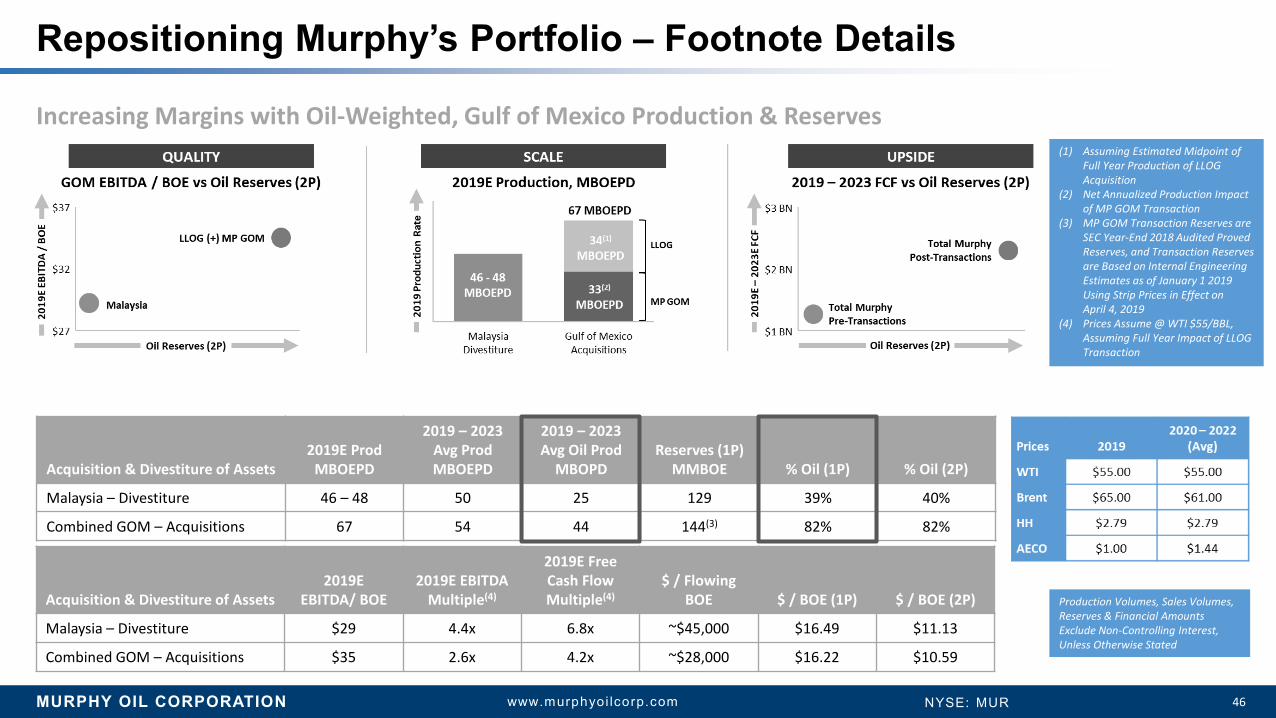
Increasing Margins with Oil-Weighted, Gulf of Mexico Production & Reserves
Repositioning Murphy’s Portfolio – Footnote Details
Acquisition & Divestiture of Assets2019E Prod
MBOEPD
2019 – 2023Avg Prod MBOEPD
2019 – 2023 Avg Oil Prod
MBOPDReserves (1P)
MMBOE % Oil (1P) % Oil (2P)
Malaysia – Divestiture 46 – 48 50 25 129 39% 40%
Combined GOM – Acquisitions 67 54 44 144(3) 82% 82%
Acquisition & Divestiture of Assets2019E
EBITDA/ BOE 2019E EBITDA
Multiple(4)
2019E Free Cash Flow Multiple(4)
$ / Flowing BOE $ / BOE (1P) $ / BOE (2P)
Malaysia – Divestiture $29 4.4x 6.8x ~$45,000 $16.49 $11.13
Combined GOM – Acquisitions $35 2.6x 4.2x ~$28,000 $16.22 $10.59
(1) Assuming Estimated Midpoint of Full Year Production of LLOG Acquisition
(2) Net Annualized Production Impact of MP GOM Transaction
(3) MP GOM Transaction Reserves are SEC Year-End 2018 Audited Proved Reserves, and Transaction Reserves are Based on Internal Engineering Estimates as of January 1 2019 Using Strip Prices in Effect onApril 4, 2019
(4) Prices Assume @ WTI $55/BBL, Assuming Full Year Impact of LLOG Transaction
Production Volumes, Sales Volumes, Reserves & Financial Amounts Exclude Non-Controlling Interest, Unless Otherwise Stated

MURPHY OIL CORPORATION 47www.murphyoi lcorp.com NYSE: MUR
WELLS FARGO WEST COAST ENERGY CONFERENCEJUNE 12, 2019
DAVID R. LOONEYEXECUTIVE VICE PRESIDENT & CHIEF FINANCIAL OFFICER


