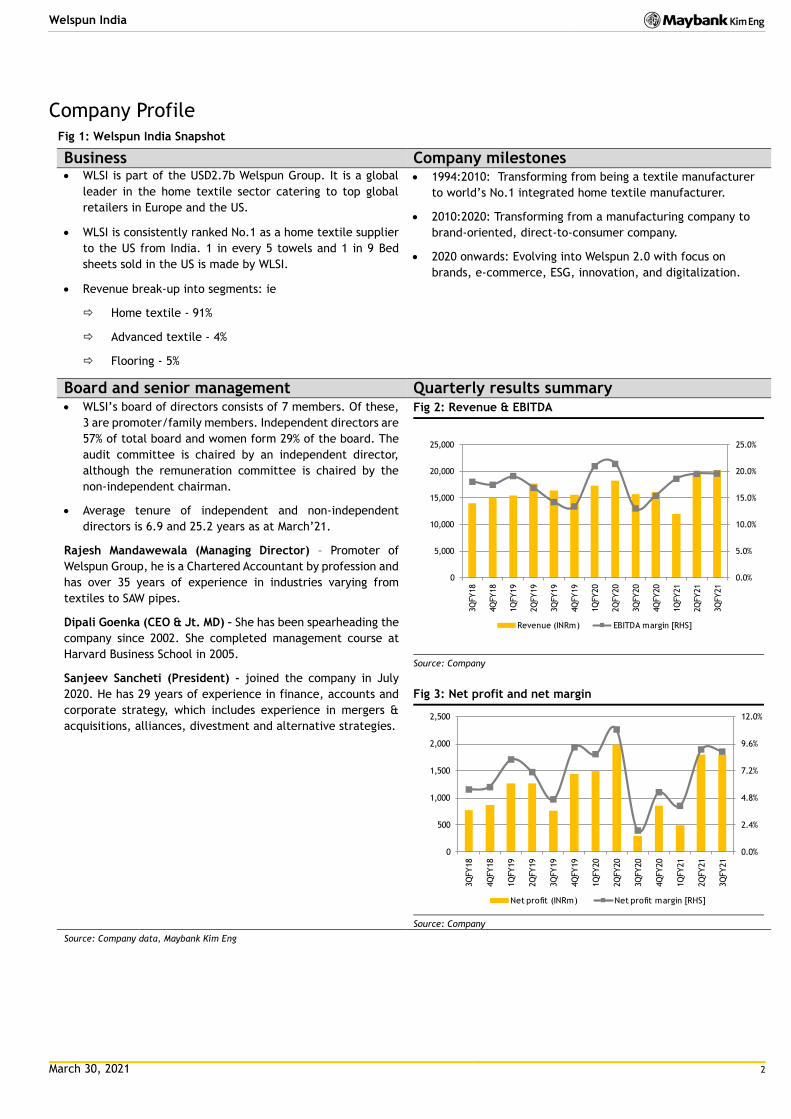
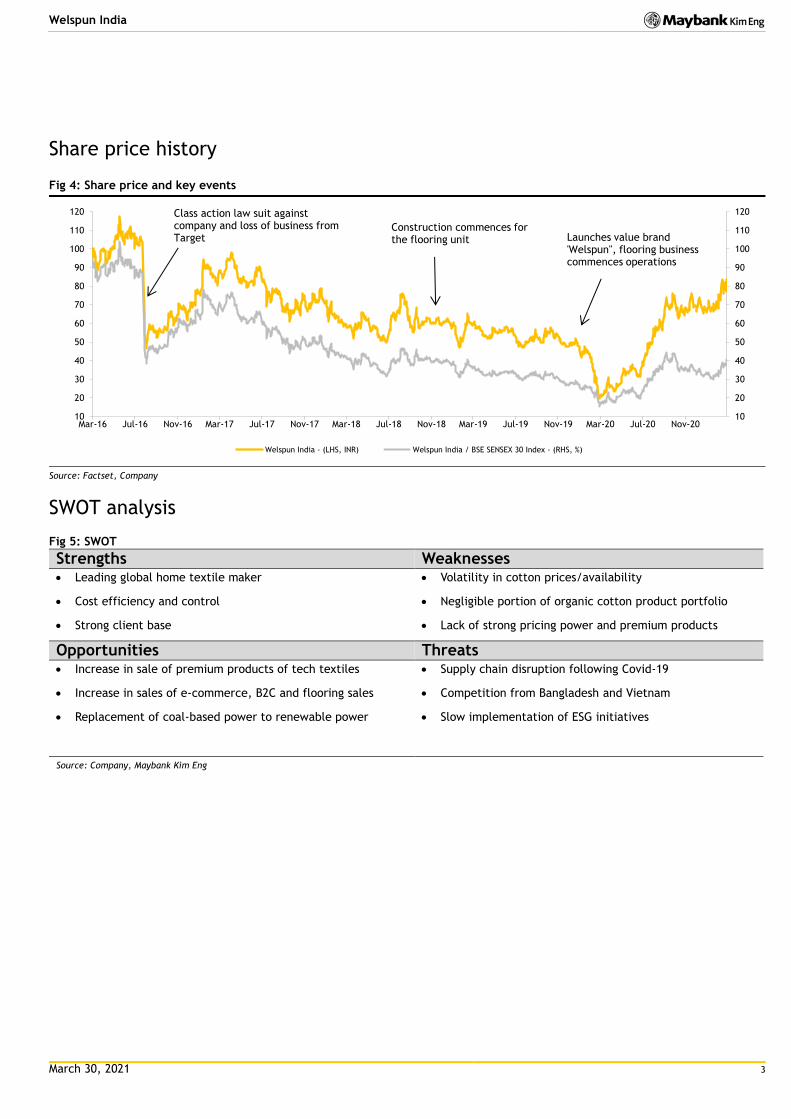
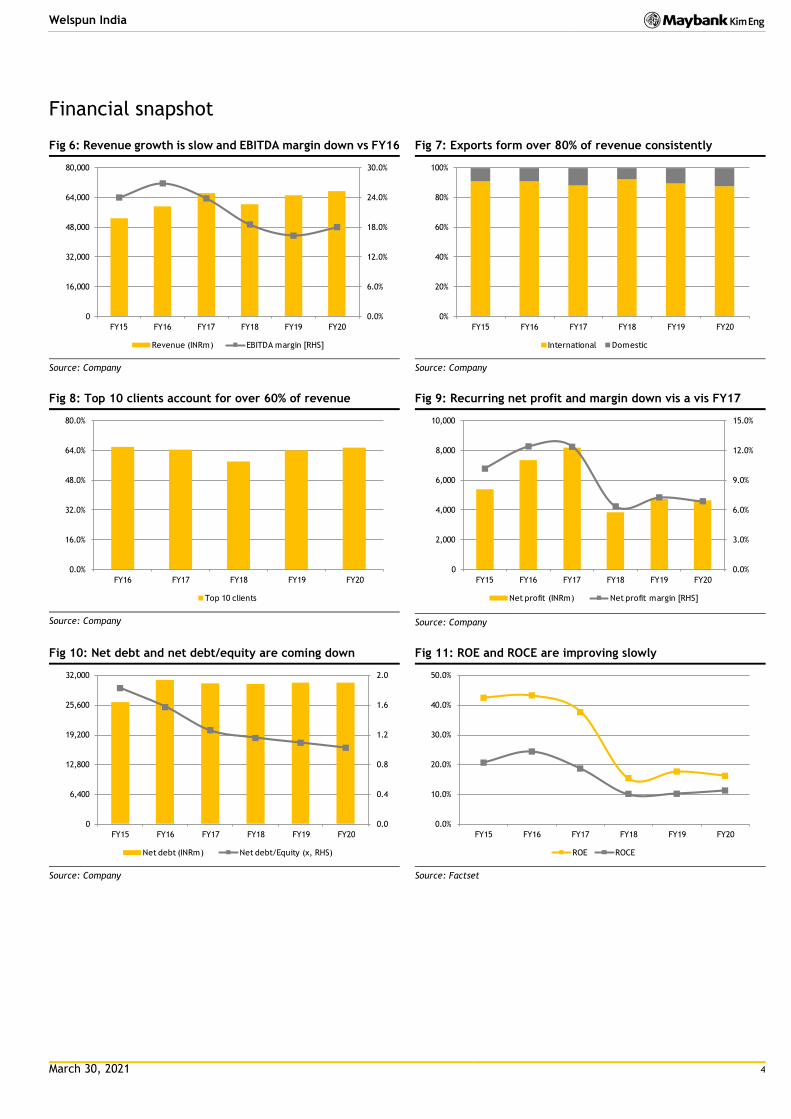
Consumer Discretionary India March 30, 2021 THIS REPORT HAS BEEN PREPARED BY KIM ENG SECURITIES INDIA PVT LTD SEE PAGE 11 FOR IMPORTANT DISCLOSURES AND ANALYST CERTIFICATIONS Jigar Shah [email protected](91) 22 4223 2632 Neerav Dalal [email protected](91) 22 4223 2606 Welspun India (WLSI IN) Clear ESG targets for 2025- 2030 Home textile major has strong ESG ambition We recently hosted WLSI’s management to discuss its ESG practices and ambitions. It is one of the largest home textile companies globally and the No.1 in India. Exports make up 88% of revenue. Despite key ESG issues in the textile sector (such as alleged human rights violation and environmental pollution), WLSI has a good track record and practices to address these. Its ambition to become ‘carbon neutral’ and ‘freshwater positive’ by 2030 is quite bold within and outside the textile sector. Clear plan and strategy for 2030 ESG roadmap WLSI has direct emissions amounting to c. 900kt CO2e pa. It aims to shift to 100% renewable energy by 2030 by replacing 40-45MW captive thermal power plant. This would be done by investing in roof-top and large- scale solar capacity and grid power purchase through third party. The company generates a cash profit of INR9b pa, which would enable it to finance this transition. The bulk of its solar capacity would come in the state of Gujarat where it has surplus land. The shift in its energy mix and cut in emissions may not be linear but would be largely through reductions. Initiatives on waste, supply chain, gender diversity WLSI is recycling 81% of its hazardous and 13% of non-hazardous waste. It aims to achieve 100% recycling of waste by 2025. It sources 31% of total as sustainable cotton by supporting 13,000 farmers. By 2030 it aims to support 500,000 farmers and source 100% sustainable cotton. Women form 25% of its workforce of 20,000 and a large number of them are engaged in making hand-crafted textile. The company is certified SA-8000 for human rights and has to undergo frequent client audits by retailers such as Walmart, Amazon, Costco, Tesco, Ikea and Sainsbury’s. WLSI’s ESG targets are clearer than peers In our comparison of ESG practices by textile and apparel companies in India we noticed WLSI has the clearest path and strategy regarding ESG targets in the medium to long term. The textile sector is the 2 nd most polluting globally and it’s responsible for 2% of global GHG emissions, which warrants urgency in sustainable practices. WLSI’s efforts to decarbonize with proactive ESG practices are in line with the global trend of decline in ‘fast fashion’ and clear preference for sustainable textile products by millennials/Gen Z. Share Price INR 84 Not Rated Company Description Statistics 52w high/low (INR) 3m avg turnover (USDm) Free float (%) Issued shares (m) Market capitalisation Major shareholders: 69.2% 3.2% 1.9% 1,005 1.8 Part of USD2.7b Welspun group, WLSI is a global leader in home textiles, supplying to top global retailers GOENKA BALKRISHAN GOPIRAM DSP Investment Managers Pvt Ltd. Life Insurance Corp of India 84/21 29.3 INR84.0B USD1.2B Price Performance 40 60 80 100 120 140 160 180 200 10 20 30 40 50 60 70 80 90 Apr-19 Jul-19 Oct-19 Jan-20 Apr-20 Jul-20 Oct-20 Jan-21 Welspun India - (LHS, INR) Welspun India / BSE SENSEX 30 Index - (RHS, %) -1M -3M -12M Absolute (%) 22 22 322 Relative to index (%) 22 19 157 Source: FactSet FYE Mar (INR m) FY16A FY17A FY18A FY19A FY20A Revenue 59,239 66,405 60,506 65,266 67,411 EBITDA 15,927 15,834 11,234 10,649 12,147 Core net profit 7,365 8,223 3,850 4,745 4,640 Core EPS (INR) 7 8 4 5 5 Core EPS growth (%) 36.4 11.7 (53.2) 23.3 (2.2) Net DPS (INR) 1 1 1 0 1 Core P/E (x) 13.6 10.7 15.1 12.6 4.7 P/BV (x) 5.1 3.7 2.2 2.2 0.7 Net dividend yield (%) 1.3 0.7 1.1 0.5 4.6 ROAE (%) 43.3 16.4 15.4 7.8 17.6 ROAA (%) 12.0 11.9 5.3 6.3 5.8 EV/EBITDA (x) 8.2 7.5 7.9 8.5 4.4 Net gearing (%) (incl perps) 154.1 124.4 113.7 106.6 99.7
Transcript
C
onsu
mer
Dis
cre
tionary
In
dia
84
March 30, 2021
THIS REPORT HAS BEEN PREPARED BY KIM ENG SECURITIES INDIA PVT LTD
SEE PAGE 11 FOR IMPORTANT DISCLOSURES AND ANALYST CERTIFICATIONS
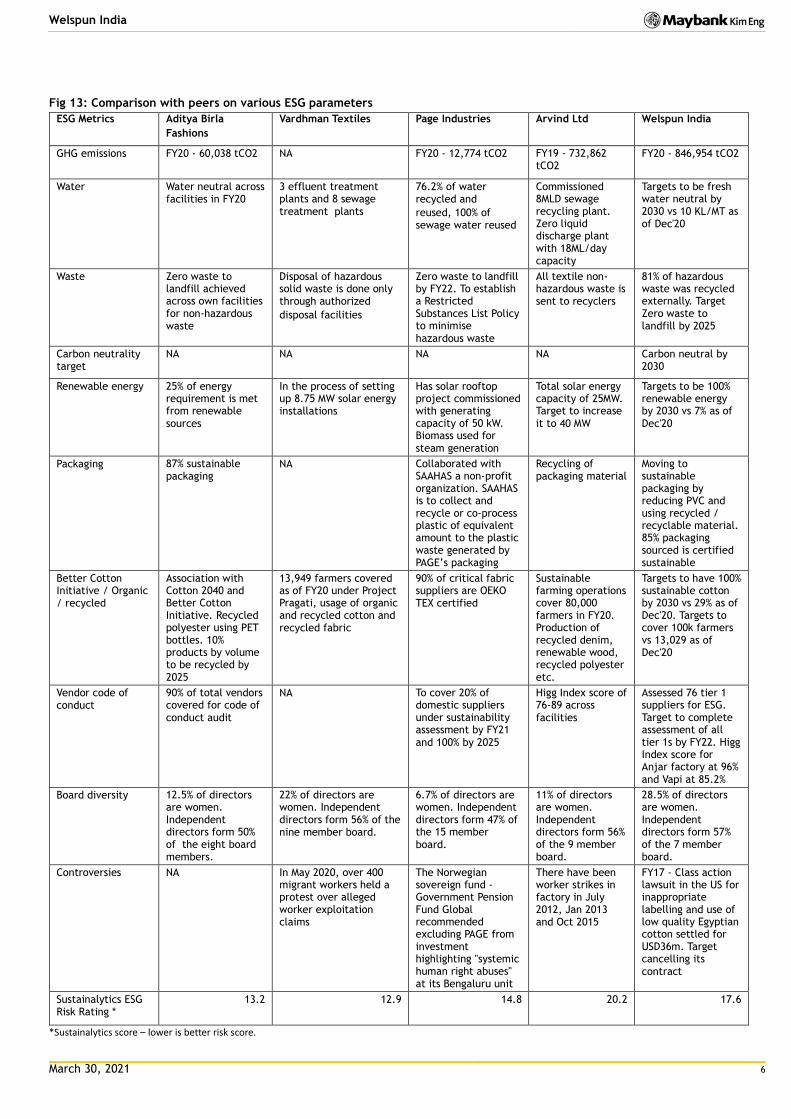
Commissioned 8MLD sewage recycling plant. Zero liquid discharge plant with 18ML/day capacity
Targets to be fresh water neutral by 2030 vs 10 KL/MT as of Dec'20
Waste Zero waste to landfill achieved across own facilities for non-hazardous waste
Disposal of hazardous solid waste is done only through authorized
disposal facilities
Zero waste to landfill by FY22. To establish a Restricted Substances List Policy to minimise
hazardous waste
All textile non-hazardous waste is sent to recyclers
81% of hazardous waste was recycled externally. Target Zero waste to landfill by 2025
Carbon neutrality target
NA NA NA NA Carbon neutral by 2030
Renewable energy 25% of energy requirement is met from renewable
sources
In the process of setting up 8.75 MW solar energy installations
Has solar rooftop project commissioned with generating capacity of 50 kW. Biomass used for
steam generation
Total solar energy capacity of 25MW. Target to increase
it to 40 MW
Targets to be 100% renewable energy by 2030 vs 7% as of
Dec'20
Packaging 87% sustainable packaging
NA Collaborated with SAAHAS a non-profit organization. SAAHAS is to collect and recycle or co-process plastic of equivalent amount to the plastic waste generated by PAGE’s packaging
Recycling of packaging material
Moving to sustainable packaging by reducing PVC and using recycled / recyclable material. 85% packaging sourced is certified sustainable
Better Cotton Initiative / Organic / recycled
Association with Cotton 2040 and Better Cotton Initiative. Recycled polyester using PET bottles. 10% products by volume to be recycled by
2025
13,949 farmers covered as of FY20 under Project Pragati, usage of organic and recycled cotton and recycled fabric
90% of critical fabric suppliers are OEKO TEX certified
Sustainable farming operations cover 80,000 farmers in FY20. Production of recycled denim, renewable wood, recycled polyester
etc.
Targets to have 100% sustainable cotton by 2030 vs 29% as of Dec'20. Targets to cover 100k farmers vs 13,029 as of Dec'20
Vendor code of conduct
90% of total vendors covered for code of
conduct audit
NA To cover 20% of domestic suppliers under sustainability assessment by FY21
and 100% by 2025
Higg Index score of 76-89 across
facilities
Assessed 76 tier 1 suppliers for ESG. Target to complete assessment of all tier 1s by FY22. Higg Index score for Anjar factory at 96%
and Vapi at 85.2%
Board diversity 12.5% of directors are women. Independent directors form 50% of the eight board members.
22% of directors are women. Independent directors form 56% of the nine member board.
6.7% of directors are women. Independent directors form 47% of the 15 member
board.
11% of directors are women. Independent directors form 56% of the 9 member board.
28.5% of directors are women. Independent directors form 57% of the 7 member board.
Controversies NA In May 2020, over 400 migrant workers held a protest over alleged worker exploitation claims
The Norwegian sovereign fund - Government Pension Fund Global recommended excluding PAGE from investment highlighting "systemic human right abuses" at its Bengaluru unit
There have been worker strikes in factory in July 2012, Jan 2013 and Oct 2015
FY17 - Class action lawsuit in the US for inappropriate labelling and use of low quality Egyptian cotton settled for USD36m. Target cancelling its
contract
Sustainalytics ESG Risk Rating *
13.2 12.9 14.8 20.2 17.6
*Sustainalytics score – lower is better risk score.
March 30, 2021 7
Welspun India
Notes:
1. OEKO-TEX certification ensures that the materials used in products are free from
harmful substances, from yarn to the finished fabric and are produced in facilities
that are in environmentally and socially sound condition.
2. WRAP certification is issued post thorough evaluation of production facilities
based on 12 principles of social compliance.
3. Higg Index is an apparel and footwear industry self-assessment standard for
assessing environmental and social sustainability throughout supply chain.
4. With regard to the recent issue about the labour practices in China’s Uighyur
province and decision of Western Brands to stop sourcing from this region, we
checked the implications with WLSI. WLSI clarified that it does not source cotton
from China and that its sales to Western brands are for their local stores only. At
this point of time, it has no impact from this issue in the textile sector.
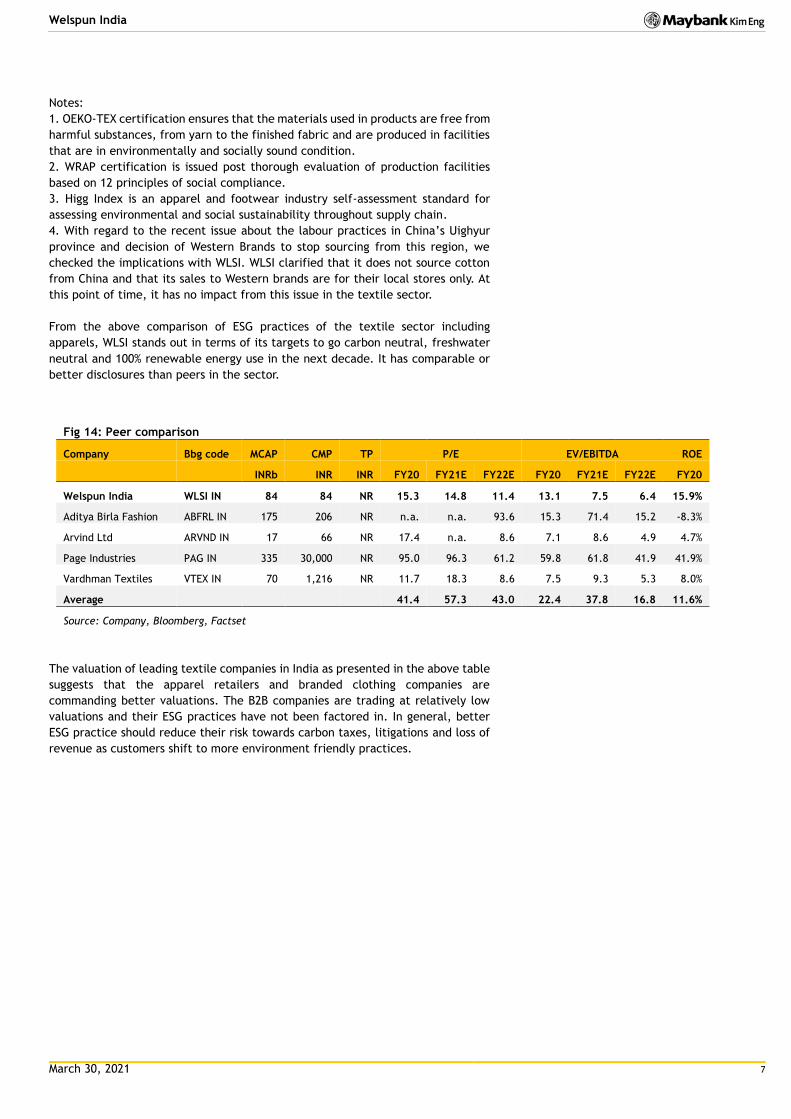
From the above comparison of ESG practices of the textile sector including
apparels, WLSI stands out in terms of its targets to go carbon neutral, freshwater
neutral and 100% renewable energy use in the next decade. It has comparable or
APPENDIX I: TERMS FOR PROVISION OF REPORT, DISCLAIMERS AND DISCLOSURES
DISCLAIMERS This research report is prepared for general circulation and for information purposes only and under no circumstances should it be considered or intended as an offer to s ell or a solicitation of an offer to buy the securities referred to herein. Investors should note that values of such securities, i f any, may fluctuate and that each security’s price or value may rise or fall. Opinions or recommendations contained herein are in form of technical ratings and fundamental ratings. Technical ratings may differ fr om fundamental ratings as technical valuations apply different methodologies and are purely based on price and volume-related information extracted from the relevant jurisdiction’s stock exchange in the equity analysis. Accordingly, investors’ returns may be less than the original sum invested. Past performance is not necessarily a guide to future performance. This report is not intended to provide personal investment advice and does not take into account the specific investment objectives, the financial situation and the particular needs of persons who may receive or read this report. Investors should therefore seek financial, legal and other advice regarding the appropriateness of investing in any securities or the investment strategies discussed or recommended in this report.
The information contained herein has been obtained from sources believed to be reliable but such sources have not been independently verified by Maybank Investment Bank Berhad, its subsidiary and affiliates (collectively, “MKE”) and consequently no representation is made as to the accuracy or completeness of this report by MKE and it should not be relied upon as such. Accordingly, MKE and its officers, directors, associates, connected parties and/or employees (collectively, “Representatives”) shall not be liable for any direct, indirect or consequential losses or damages that may arise from the use or reliance of this report. Any information, opinions or recommendations contained herein are subject to change at any time, without prior notice.
This report may contain forward looking statements which are often but not always identified by the use of words such as “anticipate”, “believe”, “estimate”, “intend”, “plan”, “expect”, “forecast”, “predict” and “project” and statements that an event or result “may”, “will”, “can”, “should”, “could” or “might” occur or be achieved and other similar expressions. Such forward looking statements are based on assumptions made and information currently available to us and are subject to certain risks and uncertainties that could cause the actual results to differ materially from those expressed in any forward looking statements. Readers are cautioned not to place undue relevance on these forward-looking statements. MKE expressly disclaims any obligation to update or revise any such forward looking statements to reflect new information, events or circumstances after the date of this publication or to reflect the occurrence of unanticipated events.
MKE and its officers, directors and employees, including persons involved in the preparation or issuance of this report, may, to the extent permitted by law, from time to time participate or invest in financing transactions with the issuer(s) of the securities mentioned in this report, perform services for or solic it business from such issuers, and/or have a position or holding, or other material interest, or effect transactions, in such securities or options thereon, or other investments related thereto. In addition, it may make markets in the securities mentioned in the material presented in this report. One or more directors, officers and/or employees of MKE may be a director of the issuers of the securities mentioned in this report to the extent permitted by law.
This report is prepared for the use of MKE’s clients and may not be reproduced, altered in any way, transmitted to, copied or distributed to any other party in whole or in part in any form or manner without the prior express written consent of MKE and MKE and its Representatives accepts no liability whatsoever for t he actions of third parties in this respect.
This report is not directed to or intended for distribution to or use by any person or entity who is a citizen or resident of or located in any locality, state, country or other jurisdiction where such distribution, publication, availability or use would be contrary to law or regulation. This report is for distribution only under such circumstances as may be permitted by applicable law. The securities described herein may not be eligible for sale in all jurisdictions or to certain categor ies of investors. Without prejudice to the foregoing, the reader is to note that additional disclaimers, warnings or qualifications may apply based on geographical location of the person or entity receiving this repor t.
Malaysia Opinions or recommendations contained herein are in the form of technical ratings and fundamental ratings. Technical ratings may differ from fundamental ratings as technical valuations apply different methodologies and are purely based on price and volume-related information extracted from Bursa Malaysia Securities Berhad in the equity analysis.
Singapore This report has been produced as of the date hereof and the information herein may be subject to change. Maybank Kim Eng Research Pte. Ltd. (“Maybank KERPL”) in Singapore has no obligation to update such information for any recipient. For distribution in Singapore, recipients of this report are to contact Maybank KERPL in Singapore in respect of any matters arising from, or in connection with, this report. If the recipient of this report is not an accredited investor, expert investor or institutional investor (as defined under Section 4A of the Singapore Securities and Futures Act), Maybank KERPL shall be legally liable for the contents of this report, with such liability being limited to the extent (if any) as permitted by law.
Thailand Except as specifically permitted, no part of this presentation may be reproduced or distributed in any manner without the prior written permission of Maybank Kim Eng Securities (Thailand) Public Company Limited. Maybank Kim Eng Securities (Thailand) Public Company Limited (“MBKET”) accepts no liability whatsoever for the actions of third parties in this respect.
Due to different characteristics, objectives and strategies of institutional and retail investors, the research products of MBKET Institutional and Retail Research departments may differ in either recommendation or target price, or both. MBKET reserves the rights to disseminate MBKET Retail Research reports to institutional investors who have requested to receive it. If you are an authorised recipient, you hereby tacitly acknowledge that the research reports from MBKET Retail Research are first produced in Thai and there is a time lag in the release of the translated English version.
The disclosure of the survey result of the Thai Institute of Directors Association (“IOD”) regarding corporate governance is made pursuant to the policy of the Office of the Securities and Exchange Commission. The survey of the IOD is based on the information of a company listed on the Stock Exchange of Thailand and the market for Alternative Investment disclosed to the public and able to be accessed by a general public investor. The result, therefore, is from the perspective of a third party. It is not an evaluation of operation and is not based on inside information. The survey result is as of the date appearing in the Corporate Governance Report of Thai Listed Companies. As a result, the survey may be changed after that date. MBKET does not confirm nor certify the accuracy of such survey result.
The disclosure of the Anti-Corruption Progress Indicators of a listed company on the Stock Exchange of Thailand, which is assessed by Thaipat Institute, is made in order to comply with the policy and sustainable development plan for the listed companies of the Office of the Securities and Exchange Commission. Thaipat Institute made this assessment based on the information received from the listed company, as stipulated in the form for the assessment of Anti-corruption which refers to the Annual Registration Statement (Form 56-1), Annual Report (Form 56-2), or other relevant documents or reports of such listed company. The assessment result is therefore made from the perspective o f Thaipat Institute that is a third party. It is not an assessment of operation and is not based on any inside information. Since this assessment is only the assessment result as of the date appearing in the assessment result, it may be changed after that date or when there is any change to the relevant information. Nevertheless, MBKET does not confirm, verify, or certify the accuracy and completeness of the assessment result.
US This third-party research report is distributed in the United States (“US”) to Major US Institutional Investors (as defined in Rule 15a-6 under the Securities Exchange Act of 1934, as amended) only by Maybank Kim Eng Securities USA Inc (“Maybank KESUSA”), a broker-dealer registered in the US (registered under Section 15 of the Securities Exchange Act of 1934, as amended). All responsibility for the distribution of this report by Maybank KESUSA in the US shall be borne by Maybank KESUSA. This report is not directed at you if MKE is prohibited or restricted by any legislation or regulation in any jurisdiction from making it available to you. You should satisfy yourself before reading it that Maybank KESUSA is permitted to provide research material concerning investments to you under relevant legislation and regulations. All U.S. persons receiving and/or accessing this report and wishing to effect transactions in any security mentioned within must do so with: Maybank Kim Eng Securities USA Inc. 400 Park Avenue, 11th Floor, New York, New York 10022, 1-(212) 688-8886 and not with, the issuer of this report.
March 30, 2021 12
Welspun India
Disclosure of Interest
Malaysia: MKE and its Representatives may from time to time have positions or be materially interested in the securities referred to herein and may further act as market maker or may have assumed an underwriting commitment or deal with such securities and may also perform or seek to perform investment banking services, advisory and other services for or relating to those companies. Singapore: As of 30 March 2021, Maybank KERPL and the covering analyst do not have any interest in any companies recommended in this research report. Thailand: MBKET may have a business relationship with or may possibly be an issuer of derivative warrants on the securities /companies mentioned in the research report. Therefore, Investors should exercise their own judgment before making any investment decisions. MBKET, its associates, directors, connected parties and/or employees may from time to time have interests and/or underwriting commitments in the securities mentioned in this report. Hong Kong: As of 30 March 2021, KESHK and the authoring analyst do not have any interest in any companies recommended in this research report. India: As of 30 March 2021, and at the end of the month immediately preceding the date of publication of the research report, KESI, authoring analyst o r their associate / relative does not hold any financial interest or any actual or beneficial ownership in any shares or having any conflict of interest in the subject companies except as otherwise disclosed in the research report.
In the past twelve months KESI and authoring analyst or their associate did not receive any compensation or other benefits from the subject companies or third party in connection with the research report on any account what so ever except as otherwise disclosed in the research report.
MKE may have, within the last three years, served as manager or co-manager of a public offering of securities for, or currently may make a primary market in issues of, any or all of the entities mentioned in this report or may be providing, or have provided within the previous 12 months, significant advice or investment services in relation to the investment concerned or a related investment and may receive compensation for the services provided from the companies covered in this report.
OTHERS
Analyst Certification of Independence
The views expressed in this research report accurately reflect the analyst’s personal views about any and all of the subject securities or issuers; and no part of the research analyst’s compensation was, is or will be, directly or indirectly, related to the specific recommendations or views expressed in the report.
Reminder
Structured securities are complex instruments, typically involve a high degree of risk and are intended for sale only to soph isticated investors who are capable of understanding and assuming the risks involved. The market value of any structured security may be affected by changes in economic, financial and politic al factors (including, but not limited to, spot and forward interest and exchange rates), time to maturity, market conditions and volatility and the credit quality of any issuer or reference issuer. Any investor interested in purchasing a structured product should conduct its own analysis of the product and consult with its own professional advisers as to the risks involved in making such a purchase.
No part of this material may be copied, photocopied or duplicated in any form by any means or redistributed without the prior consent of MKE.
Definition of Ratings
Maybank Kim Eng Research uses the following rating system
BUY Return is expected to be above 10% in the next 12 months (including dividends)
HOLD Return is expected to be between 0% to 10% in the next 12 months (including dividends)
SELL Return is expected to be below 0% in the next 12 months (including dividends)
Applicability of Ratings
The respective analyst maintains a coverage universe of stocks, the list of which may be adjusted according to needs. Investment ratings are only applicable to the stocks which form part of the coverage universe. Reports on companies which are not part of the coverage do not carry investment ratings as we do not actively follow developments in these companies.
UK This document is being distributed by Maybank Kim Eng Securities (London) Ltd (“Maybank KESL”) which is authorized and regulated, by the Financial Conduct Authority and is for Informational Purposes only. This document is not intended for distribution to anyone defined as a Retail Client under the Financial Services and Markets Act 2000 within the UK. Any inclusion of a third party link is for the recipients convenience only, and that the firm does not take any responsibility for its comments or accuracy, and that access to such links is at the individuals own risk. Nothing in this report should be considered as constituting legal, accounting or tax advice, and that for accurate guidance r ecipients should consult with their own independent tax advisers.
DISCLOSURES
Legal Entities Disclosures Malaysia: This report is issued and distributed in Malaysia by Maybank Investment Bank Berhad (15938- H) which is a Participating Organization of Bursa Malaysia Berhad and a holder of Capital Markets and Services License issued by the Securities Commission in Malaysia. Singapore: This report is distributed in Singapore by Maybank KERPL (Co. Reg No 198700034E) which is regulated by the Monetary Authority of Singapore. Indonesia: PT Maybank Kim Eng Securities (“PTMKES”) (Reg. No. KEP-251/PM/1992) is a member of the Indonesia Stock Exchange and is regulated by the Financial Services Authority (Indonesia). Thailand: MBKET (Reg. No.0107545000314) is a member of the Stock Exchange of Thailand and is regulated by the Ministry of Finance and the Securities and Exchange Commission. Philippines: Maybank ATRKES (Reg. No.01-2004-00019) is a member of the Philippines Stock Exchange and is regulated by the Securities and Exchange Commission. Vietnam: Maybank Kim Eng Securities Limited (License Number: 117/GP-UBCK) is licensed under the State Securities Commission of Vietnam. Hong Kong: KESHK (Central Entity No AAD284) is regulated by the Securities and Futures Commission. India: Kim Eng Securities India Private Limited (“KESI”) is a participant of the National Stock Exchange of India Limited and the Bombay Stock Exchange and is regulated by Securities and Exchange Board of India (“SEBI”) (Reg. No. INZ000010538). KESI is also registered with SEBI as Category 1 Merchant Banker (Reg. No. INM 000011708) and as Research Analyst (Reg No: INH000000057) US: Maybank KESUSA is a member of/ and is authorized and regulated by the FINRA – Broker ID 27861. UK: Maybank KESL (Reg No 2377538) is authorized and regulated by the Financial Conduct Authority.