21
WE’RE ABOUT DELIVERY AGM Presentation 13 June 2019

WE’RE ABOUTDELIVERY
AGM Presentation
13 June 2019

1
IMPORTANT NOTICESThis document is produced for information only and not in connection with any specific or proposed offer of securities in Sirius Minerals Plc (the “Company”). No part of these results constitutes, or shall be taken to constitute,an invitation or inducement to invest in the Company or any other entity, andmust not be relied upon in any way in connection with any investment decision.
An investment in the Company or any of its subsidiaries (together, the “Group”) involves significant risks, and several risk factors, including, among others, the principal risks and uncertainties as set out on pages 36 to 41 of the Company’s 2018 annual report and other risks or uncertainties associated with the Group’s business, segments, developments, regulatory approvals, resources, management, financing and, more generally, general economic and business conditions, changes in commodity prices, changes in laws and regulations, taxes, fluctuations in currency exchange rates and other factors, could have a material negative impact on the Company or its subsidiaries' future performance, results and financial standing. This document should not be considered as the giving of investment advice by any member of the Group or any of their respective shareholders, directors, officers, agents, employees or advisers.
Any securities offered for sale by the Company will not be registered under theU.S. Securities Act of 1933 (the “Securities Act”) and may only be offered and sold pursuant to an exemption from, or in a transaction not subject to, such registration requirements and applicable U.S. state securities laws.
Unless otherwise indicated, all sources for industry data and statistics are estimatesor forecasts contained in or derived from internal or industry sources believed bythe Company to be reliable. Industry data used throughout this document was obtained from independent experts, independent industry publications and other publicly-available information. Although we believe that these sources are reliable, they have not been independently verified, and we do not guarantee the accuracy and completeness of this information.
The information and opinions contained in this document are provided as at the date of this document and are subject to amendment without notice. In furnishing this document, no member of the Group undertakes or agrees to any obligationto provide the recipient with access to any additional information or to update this document or to correct any inaccuracies in, or omissions from, this document which may become apparent.
This document contains certain forward-looking statements relating to the business, financial performance and results of the Group and/or the industry in which it operates. Forward-looking statements concern future circumstances and resultsand other statements that are not historical facts, sometimes identified by thewords “believes”, “expects”, “predicts”, “intends”, “projects”, “plans”, “estimates”, “aims”, “foresees”, “anticipates”, “targets”, and similar expressions. The forward-looking statements contained in this document, including assumptions, opinions and views of the Group or cited from third party sources are solely opinions and forecasts which are uncertain and subject to risks, including that the predictions, forecasts, projections and other forward-looking statements will not be achieved. Any recipient of this document should be aware that a number of important factors could cause actual results to differ materially from the plans, objectives, expectations, estimates and intentions expressed in such forward-looking statements. Such forward looking-statements speak only as of the date on which they are made.
No member of the Group or any of their respective affiliates or any such person’s officers, directors or employees guarantees that the assumptions underlying such forward-looking statements are free from errors nor does any of the foregoing accept any responsibility for the future accuracy of the opinions expressed in this presentation or the actual occurrence of the forecasted developments or undertakes any obligation to review, update or confirm any of them, or to release publicly any revisions to reflect events that occur due to any change in the Group’s estimates or to reflect circumstances that arise after the date of this document, except to the extent legally required.
Any statements (including targets, projections or expectations of financial performance) regarding the financial position of the Company, any of its subsidiaries or the Group or their results are not and do not constitute a profit forecast for any period, nor should any statements be interpreted to give any indication of the future results or financial position of the Company, any of its subsidiaries or the Group.

2
✓ Completed procurement for major construction packages
✓ Secured supply agreements to facilitate stage 2 financing
✓ Advanced construction across all sites
✓ Stage 2 financing – initiated
CONTINUOUS DELIVERY

3
CONSTRUCTION UPDATE
To view construction update video visit
https://www.youtube.com/watch?v=LLI1KY5HisU&feature=youtu.be

4
ENVIRONMENT, HEALTH & SAFETY
Rolling 12 month frequency rate
JulJun Aug Sep Oct Nov Dec Jan Feb Mar Apr May
2
3
4
5
6
7
Recordable incidents (LTI and above)
Severity rating Number
Lost Time Injury (LTI) 5
Medically Treated Injury (MTI) 4
First Aid Injury (FAI) 50
Recordable incidents June 18 – May 19

5
Service shaft
• Foreshaft excavated to -45m
• Main shaft pre-sink to -80m
• Permanent winder house basement and superstructure in place
• Installation of permanent winder commenced
Production shaft
• Foreshaft excavated to -9m
• Winder house basement excavation complete
MTS access shaft
• VSM section complete to -115m
• Temporary winder house foundation complete
WOODSMITH MINE

6
LOCKWOOD BECK
Intermediate access shaft
• Pre-sink excavation complete to 30m
• Temporary winder house foundation excavation complete
• Temporary headframe construction underway
• Galloway construction underway
7
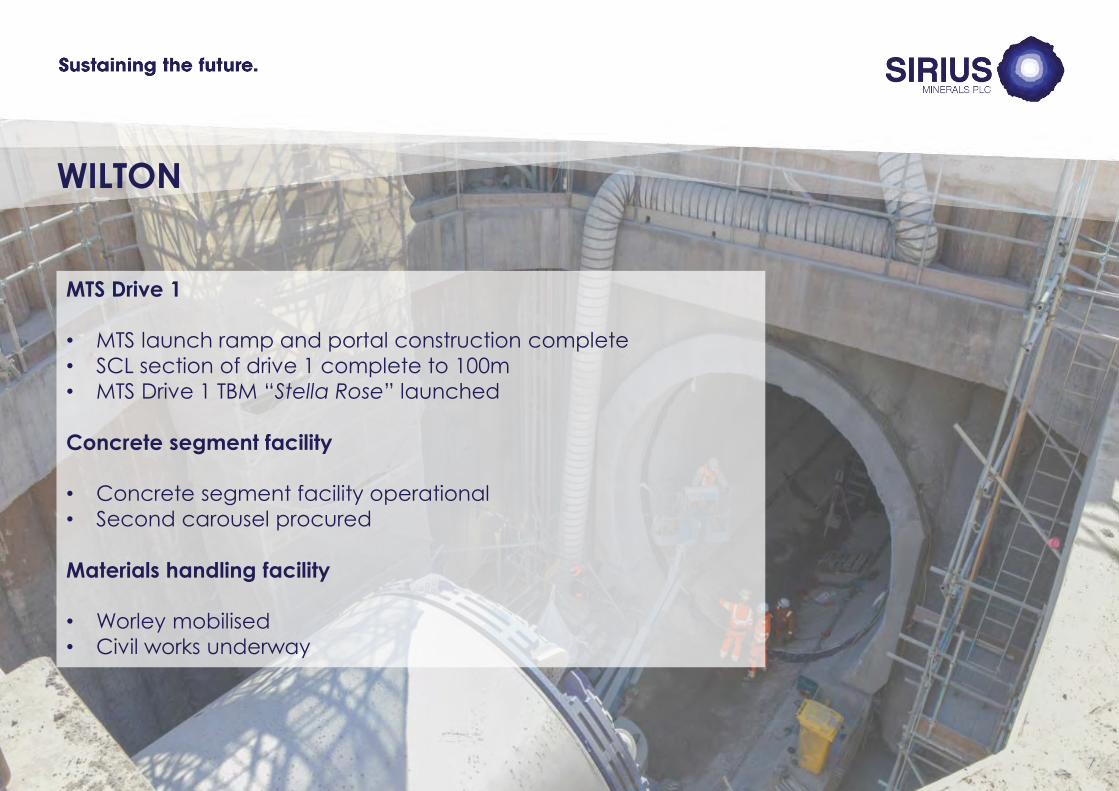
WILTON
MTS Drive 1
• MTS launch ramp and portal construction complete
• SCL section of drive 1 complete to 100m
• MTS Drive 1 TBM “Stella Rose” launched
Concrete segment facility
• Concrete segment facility operational
• Second carousel procured
Materials handling facility
• Worley mobilised
• Civil works underway

8
PROCUREMENT
Notes: WorleyParsons Ltd acquired Jacobs Engineering Groups Inc’s Energy, Chemicals and Resources division. The acquisition was completed 26 April 2019
World-leading construction partners
Mine shafts Mineral transport system Material handling facility Harbour facility

9
SALES & MARKETING
Total peak aggregate supply agreements 11.7 Mtpa
13.4 Mtpa including customer options

10
BRAZIL – 2.5 MTPA PEAK
450 employees including 37 highly experienced sales force
> 5,200 active clients
Operations and warehouses in key Brazilian ports
11 facilities in seven states (9 blending, 1 distribution centre, 1 SSP plant)
CIBRA Head office
States with CIBRA operations
States with CIBRA fertilizer sales
CIBRA blending and distribution facilities
11
Sustaining the future.
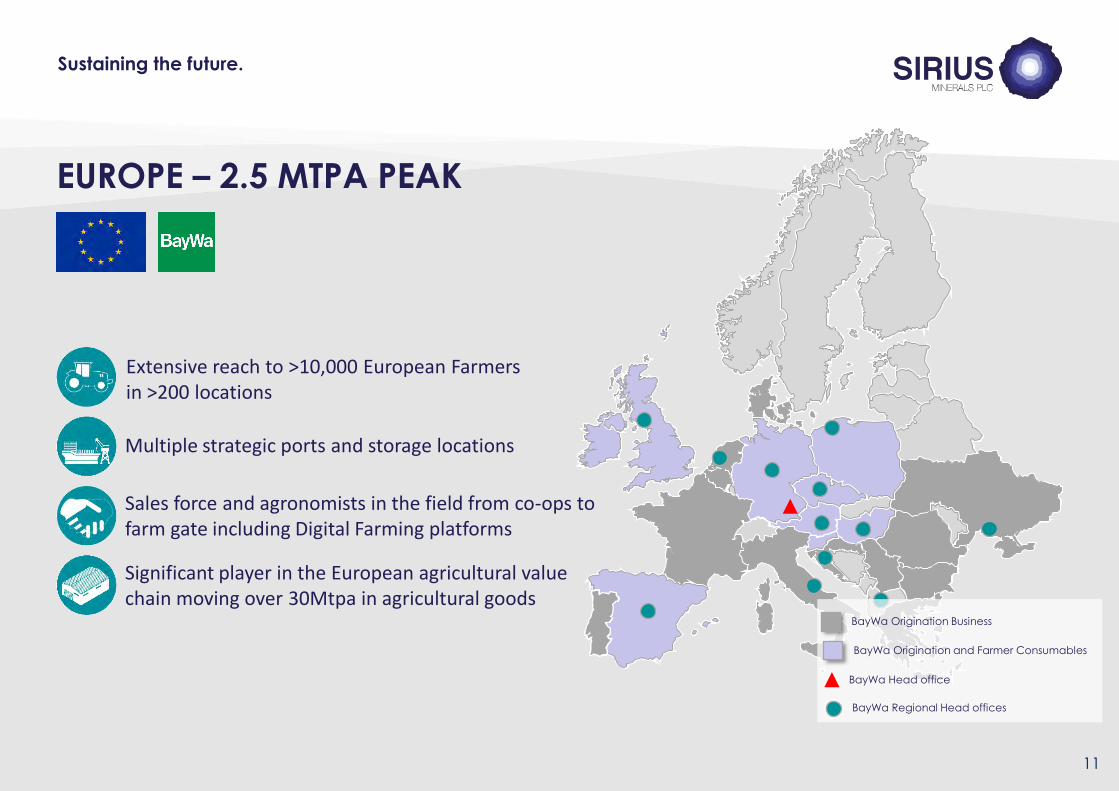
EUROPE – 2.5 MTPA PEAK
Multiple strategic ports and storage locations
Significant player in the European agricultural value chain moving over 30Mtpa in agricultural goods
Extensive reach to >10,000 European Farmers in >200 locations
Sales force and agronomists in the field from co-ops to farm gate including Digital Farming platforms
BayWa Origination Business
BayWa Origination and Farmer Consumables
BayWa Head office
BayWa Regional Head offices

12
INDIA – 1 MTPA PEAK
`
Five production facilities (9 Mtpa N, NP, NPK)
>42,000 warehouses & >82,000 retail outlets
Direct access to over 50 million Indian farmers
Two strategic ports
IFFCO Head office
IFFCO plants in India
IFFCA strategic ports in India
IFFCO state offices

13
TANZANIA MAIZE
Source of macro
and micro nutrients
Improved fertilizer
use efficiency
Extended nutrient
delivery profile
pH neutral
20 26 13 11
N P₂O₅ K₂O Cl
22% 22%56%
MOPUrea DAP
15 20 10 6 2 5 6
N SK₂OP₂O₅ MgO CaO Cl
Urea
44% 30%
DAP POLY4
10%16%
MOP
Maize: 20:26:13 NPK composition (% of input) Maize: 15:20:10 NPK composition (% of input)
POLY4
Input
Standard
Input
Multi-year study demonstrates beneficial change

14
PEOPLE – ONE TEAM
Notes: Employment figures correct as at January 2019. 1) Includes CEO and direct reports
Responsibility
Ownership
Belief
Urgency
Safety
Team
0
250
500
750
1000
2011 2012 2013 2014 2015 2016 2017 2018 2019
0
25
50
75
100
Board Senior management1 All employees
Gender representation Female Male
Workforce 2011 - presentOur Values Local employment (%)
Local Other
Sirius Partners

15
FINANCING – PATHWAY TO OPERATIONS
The true value of our Project can only be realised through successful delivery
Complete procurement
Add supply agreements
Progress construction
Equity
Convertible bond
Strategic partner
2016 2017 2018 2019
Equity like capital
High Yield Bond
Stage 1 financing Stage 2 financing
RCF

16
-
1,000
2,000
3,000
4,000
5,000
6,000
1,400
425
500
1,000
1,000
500
400
3,000
Senior
debt
Notes: 1) Based on indicative corporate financing structure. Production forecasts, pricing, operating costs and capital costs are as per the SRK CPR with the exception that prices and costs are nominal, inflated at 2%. 2) Commercial production assumed to be 10 Mtpa. Expansion to 13 Mtpa will require additional capital of US$367m which is envisaged to be funded from cash flows generated after reaching 10 Mtpa. 3) Includes US$50m Hancock equity investment to be received upon entry into definitive documentation for the Stage 2 Financing. 4) Based on the expectation ofUS$2,500m facility being available with US$1,000m in further liquidity provided after all high yield bond issuances. Amount shown represents the drawn amount in the indicative case shown above. 5)Operating cash flow illustrative based on SRK CPR pricing and operating assumptions, after reduction of sustaining capex and pre-completion operating costs. 6) Represents a conservative downside case for contingency and escalation on which the Stage 2 Financing has been sized to ensure adequate liquidity. Base case contingency and escalation is US$467m.
INDICATIVE FINANCING AND CAPEX FUNDING OVERVIEW
(US$m)
825
1,000
RCF liquidity
2019
Cumulative capex
RCF headroom
HY Bond Issuance – securities
demand featureRevolving Credit Facility Headroom
Cumulative CAPEX Nominal
New Equity
New CB net proceeds
High Yield bond
Senior debt
Pre-Stage 2 equity
2,225
Total equity
2020 2021 2022 2023 2024 2025 2026Pre-Stage 2 May - JulMay

17
ILLUSTRATIVE PROFITABILITY AT VARIOUS POLYHALITE PRICES
Production volume
US$100/t US$120/t US$140/t US$160/t US$180/t US$200/t
13 Mtpa US$0.8bn US$1.0bn US$1.3bn US$1.5bn US$1.7bn US$2.0bn
Steady state EBITDA1 sensitivity (US$mm)
Notes: 1) Illustrative EBITDA in an average steady state year on price assumptions ranging between US$100/t to US$200/t on a flat real 2018 basis and volume assumptions of 13 Mtpa assuming operating cash costs of US$31.6 and US$29.4 per tonne on a real 2018 basis respectively. 2) Weighted average contract price in first 5 years of production on a real 2018 basis.
Margin expansion

18
PROJECT SCHEDULE

19
Construction
• Complete construction of main foreshafts to enable
commencement of excavation of main shafts using shaft-
boring roadheaders
• Commence mechanical tunnelling of drive 1 of MTS and
advance tunnel excavation to 3km
• Complete early works and commence civil works for MHF
• Finalize commercial approach to Harbour facilities
Sales & Marketing
• Continue to expand global agronomy programme
• Expand global distribution footprint in incremental key markets
Corporate
• Achieve financial close on all components of the stage 2
financing plan
2019 MILESTONES

20
QUESTIONS


