15
West Kootenay Elk Composition Surveys: January and February 2011 Prepared By: Patrick Stent and Garth Mowat Ministry of Natural Resource Operations Nelson BC March 2011
West Kootenay Elk Composition Surveys:
January and February 2011
Prepared By:
Patrick Stent
and
Garth Mowat
Ministry of Natural Resource Operations
Nelson BC
March 2011
West Kootenay Elk Composition Surveys
Ministry of Natural Resource Operations 2011 ii
Executive Summary
The Ministry of Natural Resource Operations (MNRO) conducted Rocky Mountain Elk (Cervus
canadensis) composition surveys in portions of West Kootenay Management Units (MUs) 4-15, 4-16 and
4-17 during January and February 2011. The objective of these surveys was to measure bull ratios after a
“6-point or greater” general open season (GOS) was implemented in fall 2010 to Management Units that
had been formerly hunted on the Limited Entry Hunting (LEH; lottery) system. Elk composition data are
also included from stratified random block surveys conducted in the South Selkirk (MU 4-07 and 4-08)
and South Monashee (MU 4-32) MUs. Observation data were corrected for incomplete sightability using
the Hiller 12-e elk model in the program Aerial Survey.
All areas were surveyed in a Bell 206 B Jet Ranger with 3 observers. Combined survey time was 53 hours
and 7 minutes. There were 843 elk observed, including 487 cows, 122 calves, 31 spike-bulls, 87 raghorn
bulls, 85 ≥6-point bulls and 31 elk that could not be classified to sex or age class. Estimated bull ratios
ranged from 41-58:100 cows and ≥ 6-point bull ratios were 7-29:100 cows (Table 1).
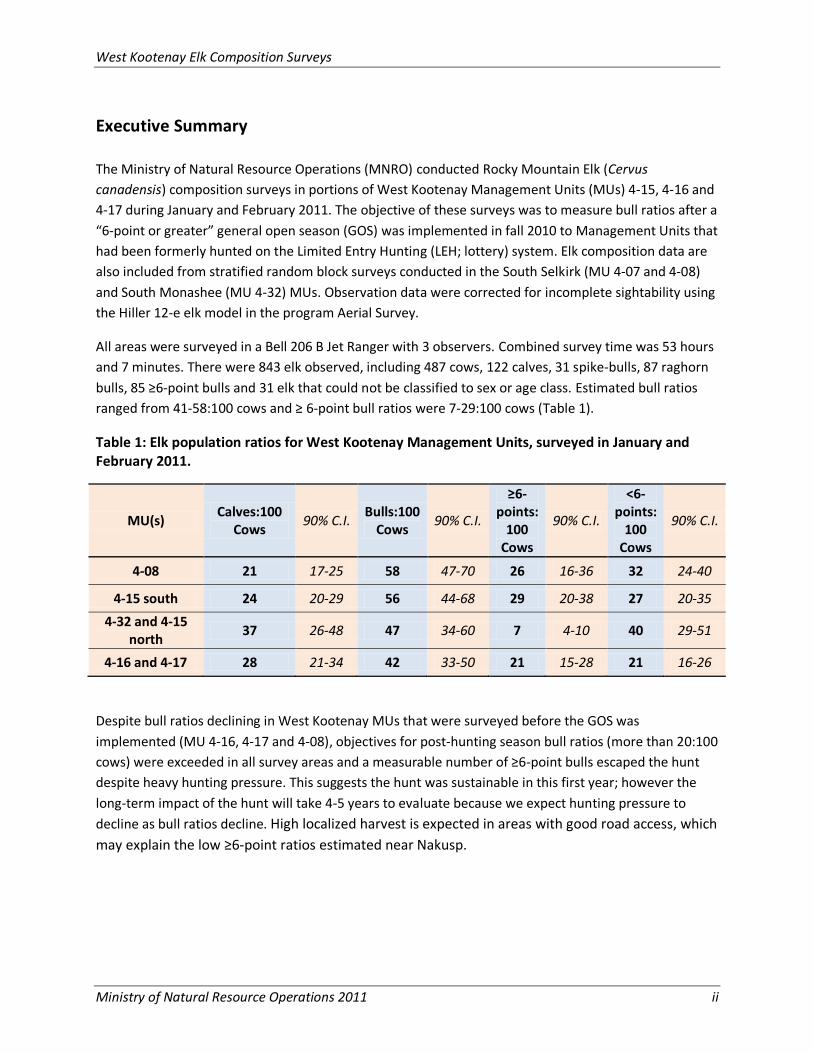
Table 1: Elk population ratios for West Kootenay Management Units, surveyed in January and February 2011.
MU(s) Calves:100
Cows 90% C.I.
Bulls:100 Cows
90% C.I.
≥6-points:
100 Cows
90% C.I.
<6-points:
100 Cows
90% C.I.
4-08 21 17-25 58 47-70 26 16-36 32 24-40
4-15 south 24 20-29 56 44-68 29 20-38 27 20-35
4-32 and 4-15 north
37 26-48 47 34-60 7 4-10 40 29-51
4-16 and 4-17 28 21-34 42 33-50 21 15-28 21 16-26
Despite bull ratios declining in West Kootenay MUs that were surveyed before the GOS was
implemented (MU 4-16, 4-17 and 4-08), objectives for post-hunting season bull ratios (more than 20:100
cows) were exceeded in all survey areas and a measurable number of ≥6-point bulls escaped the hunt
despite heavy hunting pressure. This suggests the hunt was sustainable in this first year; however the
long-term impact of the hunt will take 4-5 years to evaluate because we expect hunting pressure to
decline as bull ratios decline. High localized harvest is expected in areas with good road access, which
may explain the low ≥6-point ratios estimated near Nakusp.
West Kootenay Elk Composition Surveys
Ministry of Natural Resource Operations 2011 iii
Table of Contents
Executive Summary ................................................................................................................................. ii
List of Figures ......................................................................................................................................... iii
List of Tables .......................................................................................................................................... iii
List of Appendices ................................................................................................................................... 3
Introduction ............................................................................................................................................ 1
Study Area ............................................................................................................................................... 1
Methods.................................................................................................................................................. 3
Survey Approach ................................................................................................................................. 3
Classification ....................................................................................................................................... 4
Results .................................................................................................................................................... 4
Other Species ...................................................................................................................................... 7
Discussion ............................................................................................................................................... 7
Changes in Bull Ratios .......................................................................................................................... 7
Impact of GOS on ≥6-point Bulls .......................................................................................................... 8
Spike and Raghorn Bull Ratios .............................................................................................................. 9
Survey Methods .................................................................................................................................. 9
Acknowledgements ................................................................................................................................. 9
Literature Cited ..................................................................................................................................... 10
List of Figures
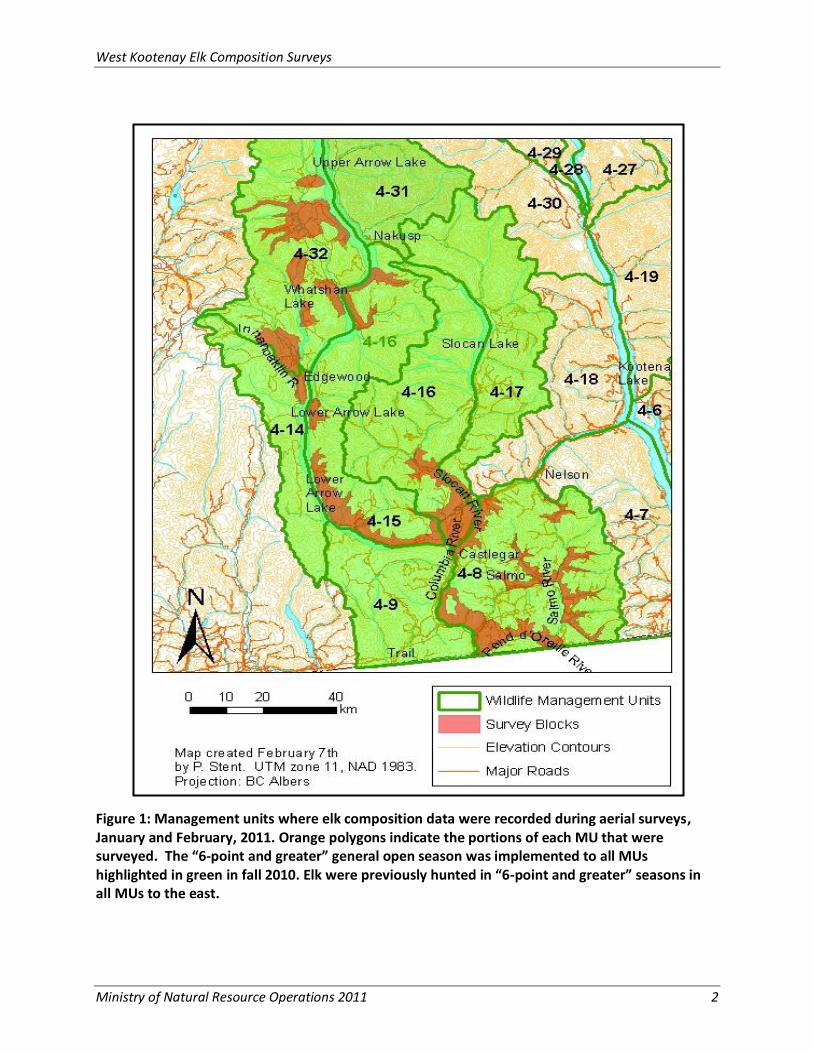
Figure 1: Management units where elk composition data were recorded during aerial surveys, January and February, 2011.. ............................................................................................................................... 2
List of Tables
Table 2: Elk composition data from West Kootenay ungulate surveys, January-February 2011. ............... 5
Table 3: Elk population ratios for the West Kootenay, surveyed January-February 2011. ......................... 7
List of Appendices
Appendix 1: Mountain Goat observations scaled to group size in MU 4-17. ........................................... 12
West Kootenay Elk Composition Surveys
Ministry of Natural Resource Operations 2011 1
Introduction
The Ministry of Natural Resource Operations (MNRO) conducted Rocky Mountain Elk (Cervus
canadensis) composition surveys in portions of West Kootenay Management Units (MUs) 4-08, 4-14, 4-
16 and 4-17 during January and February 2011. One objective of these surveys was to measure bull
ratios following implementation of the “6-point or greater” general open season (GOS). The October 1 –
20 season was implemented in 2010 in all West Kootenay MUs that had been formerly managed with
Limited Entry Hunting (LEH) seasons, where a limited number of bull elk harvest tags were issued to
resident hunters through an annual lottery. The change from LEH to GOS represented a substantial
increase in elk hunting pressure to MUs that were formerly hunted lightly on the LEH system. Elk were
previously hunted on a 40 day “6-point or greater” GOS in several MUs in the West Kootenay (4-06, 4-
07, 4-18, 4-19, 4-27 to 4-30) and all East Kootenay MUs.
Surveys followed RISC standards (2002) and methodology outlined in the Aerial Survey User’s Manual
(Unsworth et al. 1999). All elk observation data were corrected for incomplete sightability using the
Hiller 12-e elk model in the program Aerial Survey. Data from an elk census in MU 4-15 and Stratified
Random Block (SRB) surveys in the South Monashee (MU 4-32 and 4-14) and South Selkirks (MU 4-07
and 4-08) were also analysed, although I do not present data from MU 4-07 as it has been hunted on the
“6-point or greater” GOS prior to 2010.
Study Area
The study area included select winter ranges below 1500 m elevation in MUs 4-14 (Innanoaklin), 4-32
(Ingersoll Mountain and Whatshan Lake), 4-08 (Salmo River andPend d’Oreille Valley), 4-16 (Slocan
River, Krestova and Castlegar), 4-17 (Passmore and Slocan Park) and 4-15 (Robson, Deer Park and
Nakusp). Biogeoclimatic zones surveyed included the Interior Cedar Hemlock (ICH) and Interior Douglas
Fir (IDF). The ICH dry warm (dw) and very warm (xw) subzones were surveyed with greatest intensity,
followed by the IDF undifferentiated (un) and ICH moist warm (mw2) subzones. For a description of site
and vegetation characteristics for each subzone, see Braumandl and Curran (2002).
Snow water equivalents recorded at Barnes Creek, west of the study area (1595 m; 50° 04’N, 118° 21’W)
and Redfish Creek (2038 m; 49° 41’N, 117° 05’W) indicated the high elevation snowpack was 5-10%
below seasonal norms at the start of the surveys (MoE, River Forecast Centre, 2011). Mid and low-
elevation snowpack was relatively shallow at the east of Arrow Lake due to a period of warm weather
prior to the survey when most precipitation fell as rain.
Other ungulates occurring in the survey areas include mule deer (Odocoileus hemionus), white-tailed
deer (O. virginianus), moose (Alces americanus), bighorn sheep (Oreamnos americanus) and mountain
goats (Oreamnos americanus). Potential predators of elk in the survey areas include cougars (Felis
concolor), wolves (Canis lupus), coyotes (C. latrans), grizzly bears (Ursus arctos) and black bears (U.
americanus).
West Kootenay Elk Composition Surveys
Ministry of Natural Resource Operations 2011 2
Figure 1: Management units where elk composition data were recorded during aerial surveys, January and February, 2011. Orange polygons indicate the portions of each MU that were surveyed. The “6-point and greater” general open season was implemented to all MUs highlighted in green in fall 2010. Elk were previously hunted in “6-point and greater” seasons in all MUs to the east.
West Kootenay Elk Composition Surveys
Ministry of Natural Resource Operations 2011 3
Methods
Survey Approach
We conducted aerial surveys for multiple ungulate species throughout the West Kootenay during winter
2010-11. We also collected elk data specifically for estimating age and sex ratios in areas where no other
surveys were planned. For the MU 4-16 and 4-17 survey, we used data from the 2004 elk survey
(DeGroot 2005) to select winter range units where elk were believed to occur in highest densities. These
units were generally flown completely, although we maximized survey intensity in habitat types where
we believed the probability of detecting elk was highest. We minimized survey intensity in heavily
forested, north-facing sites, where elk were expected to occur in low densities and would also be
difficult to detect.
All surveys were conducted with 3 observers (plus the pilot) in a Bell 206 B Jet Ranger equipped with
rear bubble windows. The observer in the front of the machine was responsible for navigating, which
was assisted using ArcPad mobile GPS (Version 6.0.3.21U; Environmental Systems Research Institute) on
a laptop computer. The ArcPad program was connected to a Garmin Bluetooth Global Positioning
System (GPS) so we could track our position in real-time. Flight paths were recorded on the digital map
using the tracklog function to ensure transect spacing was suitable. We flew contours (i.e., transects)
across winter range units, 20-60 m above tree tops at speeds of approximately 60-75 km/hr. The first
transect was usually run at the toe of the hillside and then we worked our way upslope, spacing
transects 200-300 m apart, as dictated by forest cover within the block. We repeated transects up the
hillside until we no longer saw ungulate tracks, which was usually slightly above 1200 m on south
aspects.
We used a SRB survey approach for the South Selkirk and South Monashee surveys, while the Lower
Arrow study area was censused. Census and SRB survey approaches differ from the composition survey
approach as the former surveys are designed to estimate population size and as a result, selected survey
units (i.e., blocks) are flown completely. Hence, census and SRB surveys used roughly equal survey
intensity in high and low value elk habitat within blocks, while the composition survey approach focuses
survey effort on high value elk habitat, where the most observations can be collected in the shortest
time period.
We grouped data from MUs 4-14, 4-32 and 4-15 zone C into a single unit (Nakusp-Monashee), while
data from MU 4-08 and 4-15 zone A were analysed as individual units (Salmo/Pend d’Oreille and Lower
Arrow, respectively). Data from MUs 4-16 and 4-17 were grouped together and analysed as a single unit
(Slocan Valley).
West Kootenay Elk Composition Surveys
Ministry of Natural Resource Operations 2011 4
Classification
Elk classification followed criteria outlined in the Aerial Based Methods for Selected Ungulates (RISC
2002). Bull elk were classified as yearlings (spikes), raghorns (3-5 points with small, thin antlers) and
adult bulls (large, massive antlers with 5 or more points). We also recorded the number of yearling bulls
with >1 point on 1 antler and the number of adult bulls with ≥6-points on 1 or more antlers to assess
management objectives. Cows (females >1-year-old) and calf elk were also classified. To verify
classification data recorded from the air, we photographed all bull elk and large cow/calf groups with a
Nikon D 90 camera with a 300 mm Vibration Resistant lens.
We also recorded the activity of the first elk observed (standing, bedded or moving), relative snow cover
on the ground and oblique vegetation cover, averaged over a 10 m radius around the elk group
(Unsworth et al. 1999). We used sketches showing examples of animals in different cover classes (5%-
90%) to help us decide vegetation cover percent for each observation.
Data Analysis
We used the Hiller 12-e elk model to correct elk observations for incomplete sightability and to test for
differences in sightability between bulls and cows, which can affect bull ratios. The Hiller 12-e model
was developed in Idaho and has been used exclusively for elk surveys in the Kootenay Region (Stent
2008; Phillips et al. 2008; DeGroot 2005; Beswick and Fontana 2003).
The sightability model corrects for the expected proportion of animals within survey units but missed
during surveys. Logistic regressions used in sightability models incorporate a combination of variables
known to affect the probability of animal detection from the air. Variables affecting detection
probability of elk include: group size, animal activity, snow cover on the ground and oblique vegetation
cover. The model predicts the highest detection probability for large groups of moving animals detected
in open habitat with complete snow cover.
A Garmin 60CSx GPS was used to record waypoints at the initial location of elk observations.
I determined elevation of elk by uploading and plotting UTM coordinates in ArcGIS and joining points to
nearest 20 m contour lines so the elevation of the contour line closest to the observation point would be
expressed next to the waypoint number in the attribute table. All population ratio data are expressed
with 90% confidence intervals, generated in the program Aerial Survey. Observation data were entered
on a SPI (Species Inventory) compatible spreadsheet and will be added to the provincial database.
Results
Surveys occurred between January 8th and February 21st, 2011. Snow conditions varied throughout MUs
surveyed; snow cover was complete in the Nakusp survey area but patchy at low elevations (<900 m) in
West Kootenay Elk Composition Surveys
Ministry of Natural Resource Operations 2011 5
the Slocan, Lower Arrow and Salmo-Pend d’Oreille. Combined survey time for all MUs surveyed for elk
(excluding South Monashee moose blocks where no elk were observed) was 53 hours and 7 minutes.
There were 839 elk observed, including: 487 cows, 122 calves, 31 spike-bulls, 87 raghorn bulls, 85 ≥6-
point bulls and 31 elk that could not be classified to sex or age class (Table 2). We excluded all elk
observed in the Inanoklin valley from this analysis because we were unable to do a complete survey of
all occupied elk habitat.
Table 2: Elk observed by sex and age class during West Kootenay ungulate surveys, January-February 2011.
Survey Area Total Cows Calves Spikes Raghorns ≥6-
points Unclassified
Slocan Valley 212 119 31 7 15 20 20
Lower Arrow 222 127 33 6 22 26 8
Nakusp-Monashee 95 53 19 2 16 3 2
Salmo-Pend d’Oreille 314 188 39 16 34 36 1
Total 843 487 122 31 87 85 31
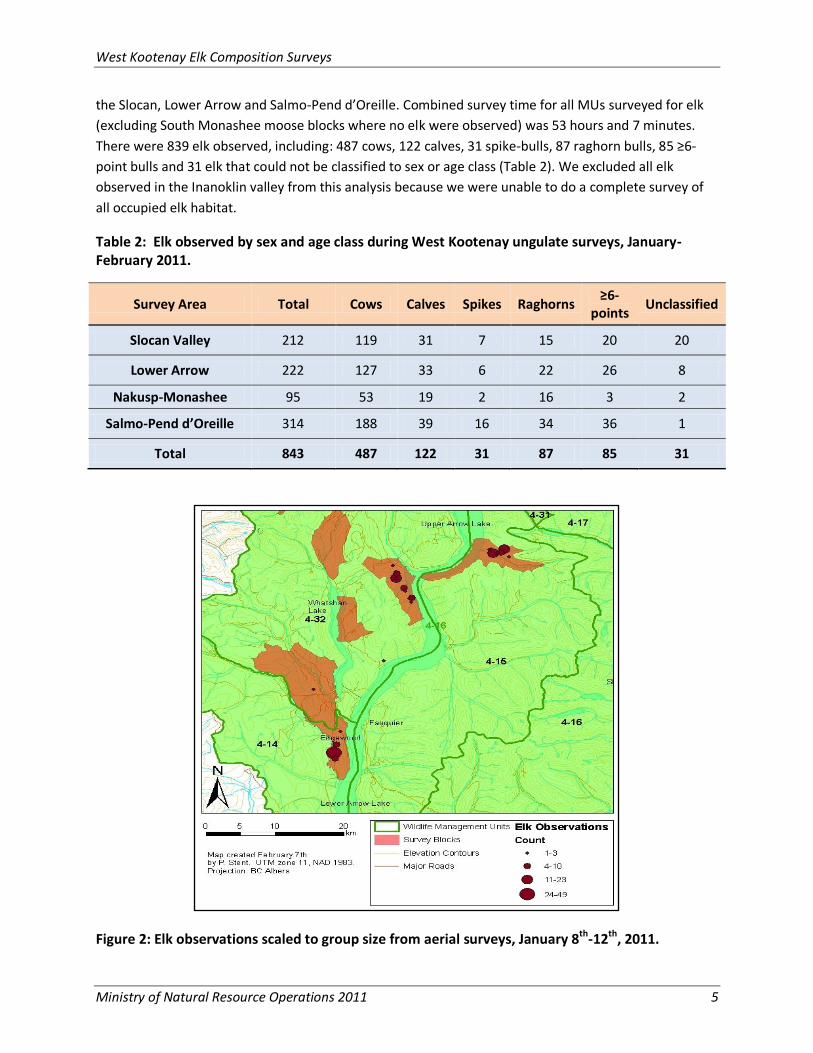
Figure 2: Elk observations scaled to group size from aerial surveys, January 8th-12th, 2011.
West Kootenay Elk Composition Surveys
Ministry of Natural Resource Operations 2011 6
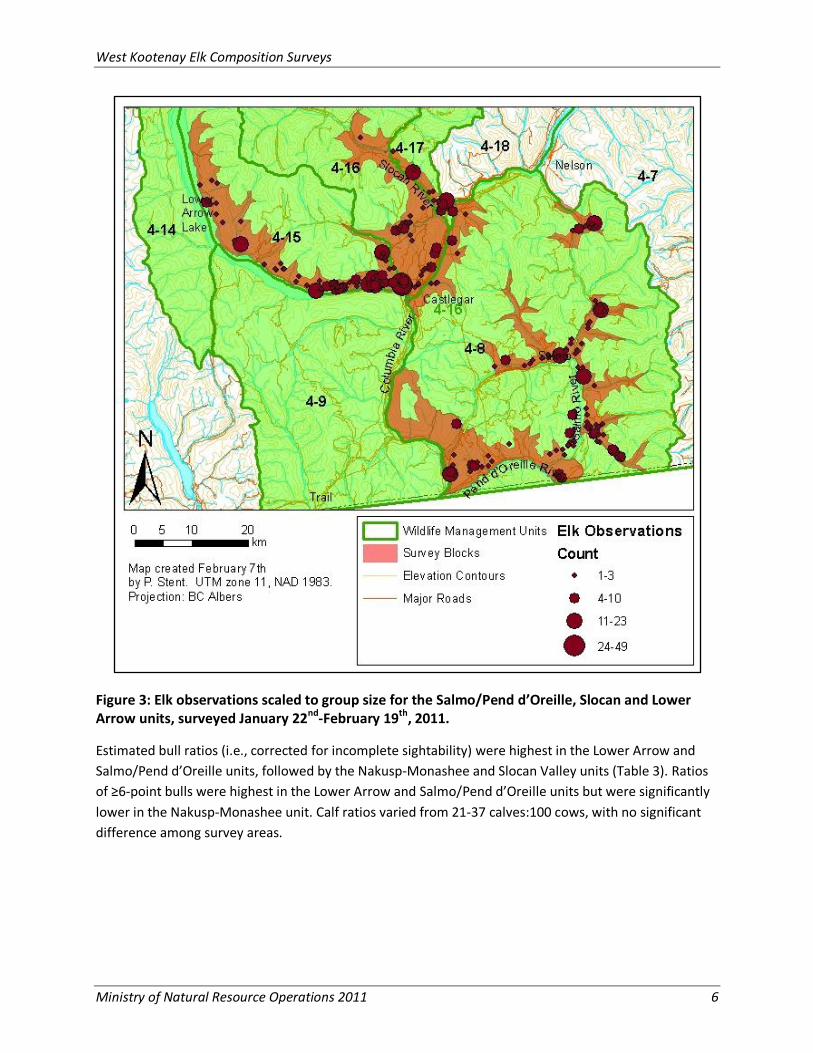
Figure 3: Elk observations scaled to group size for the Salmo/Pend d’Oreille, Slocan and Lower Arrow units, surveyed January 22nd-February 19th, 2011.
Estimated bull ratios (i.e., corrected for incomplete sightability) were highest in the Lower Arrow and
Salmo/Pend d’Oreille units, followed by the Nakusp-Monashee and Slocan Valley units (Table 3). Ratios
of ≥6-point bulls were highest in the Lower Arrow and Salmo/Pend d’Oreille units but were significantly
lower in the Nakusp-Monashee unit. Calf ratios varied from 21-37 calves:100 cows, with no significant
difference among survey areas.
West Kootenay Elk Composition Surveys
Ministry of Natural Resource Operations 2011 7
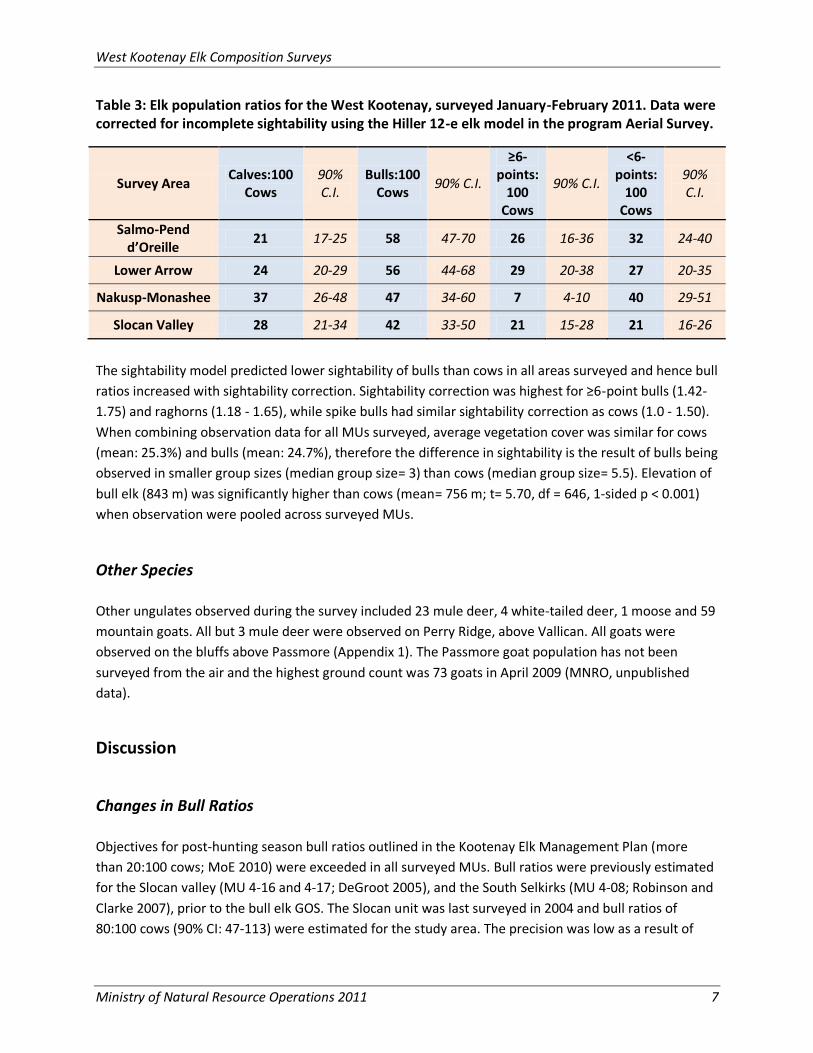
Table 3: Elk population ratios for the West Kootenay, surveyed January-February 2011. Data were corrected for incomplete sightability using the Hiller 12-e elk model in the program Aerial Survey.
Survey Area Calves:100
Cows 90% C.I.
Bulls:100 Cows
90% C.I.
≥6-points:
100 Cows
90% C.I.
<6-points:
100 Cows
90% C.I.
Salmo-Pend d’Oreille
21 17-25 58 47-70 26 16-36 32 24-40
Lower Arrow 24 20-29 56 44-68 29 20-38 27 20-35
Nakusp-Monashee 37 26-48 47 34-60 7 4-10 40 29-51
Slocan Valley 28 21-34 42 33-50 21 15-28 21 16-26
The sightability model predicted lower sightability of bulls than cows in all areas surveyed and hence bull
ratios increased with sightability correction. Sightability correction was highest for ≥6-point bulls (1.42-
1.75) and raghorns (1.18 - 1.65), while spike bulls had similar sightability correction as cows (1.0 - 1.50).
When combining observation data for all MUs surveyed, average vegetation cover was similar for cows
(mean: 25.3%) and bulls (mean: 24.7%), therefore the difference in sightability is the result of bulls being
observed in smaller group sizes (median group size= 3) than cows (median group size= 5.5). Elevation of
bull elk (843 m) was significantly higher than cows (mean= 756 m; t= 5.70, df = 646, 1-sided p < 0.001)
when observation were pooled across surveyed MUs.
Other Species
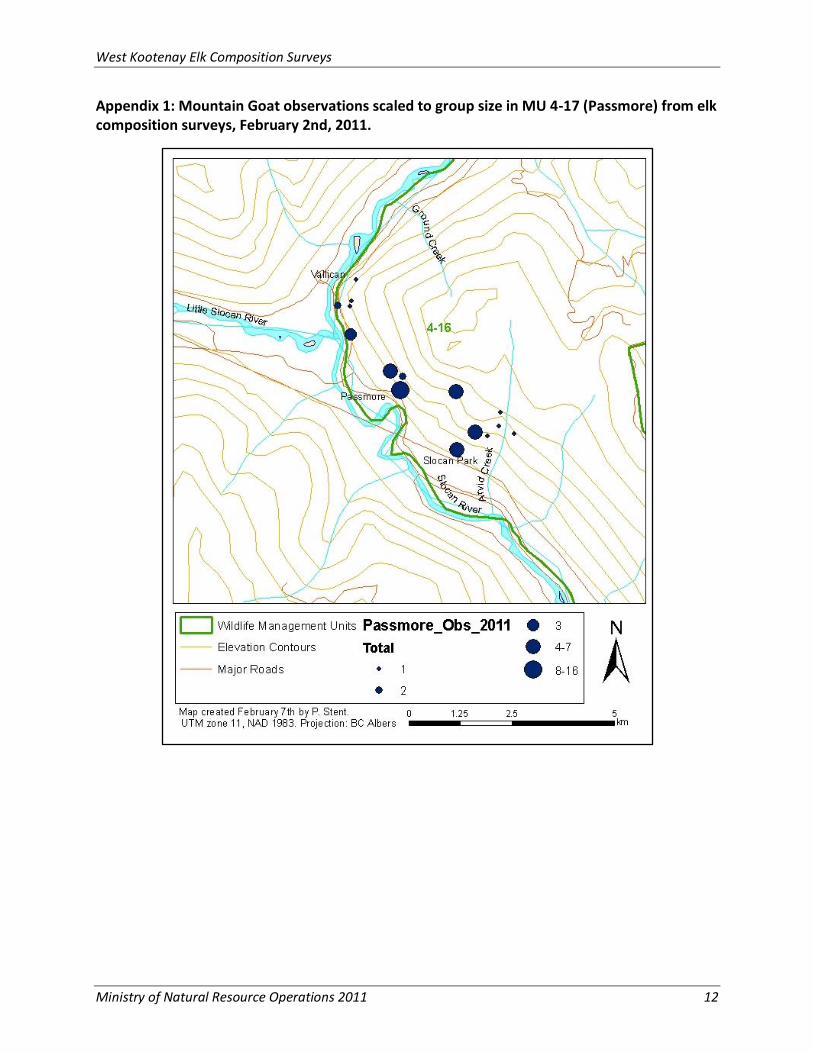
Other ungulates observed during the survey included 23 mule deer, 4 white-tailed deer, 1 moose and 59
mountain goats. All but 3 mule deer were observed on Perry Ridge, above Vallican. All goats were
observed on the bluffs above Passmore (Appendix 1). The Passmore goat population has not been
surveyed from the air and the highest ground count was 73 goats in April 2009 (MNRO, unpublished
data).
Discussion
Changes in Bull Ratios
Objectives for post-hunting season bull ratios outlined in the Kootenay Elk Management Plan (more
than 20:100 cows; MoE 2010) were exceeded in all surveyed MUs. Bull ratios were previously estimated
for the Slocan valley (MU 4-16 and 4-17; DeGroot 2005), and the South Selkirks (MU 4-08; Robinson and
Clarke 2007), prior to the bull elk GOS. The Slocan unit was last surveyed in 2004 and bull ratios of
80:100 cows (90% CI: 47-113) were estimated for the study area. The precision was low as a result of
West Kootenay Elk Composition Surveys
Ministry of Natural Resource Operations 2011 8
poor snow coverage and high sightability variance; hence confidence intervals overlapped 2011 bull
ratios. Given bull ratios >100:100 cows are unlikely in unhunted populations and more bulls than cows
were harvested in the Slocan Valley prior to the GOS, we suspect the true bull ratio was between 60-90
bulls:100 cows in 2004 and dropped following implementation of the 6-point GOS.
We re-analysed elk composition data for MU 4-08 from the 2007 South Selkirk ungulate survey
(Robinson and Clarke 2007) and found a reduction in bull ratios between the 2007 (101 bulls:100 cows
[CI: 71-132]) and 2010 surveys (58 bulls:100 cows [CI: 47-70]). In all former West Kootenay surveys, bulls
were observed in smaller group sizes and higher vegetation cover classes than cows (Robinson and
Clarke 2007; DeGroot 2005), which resulted in greater sightability correction applied to bulls. The
variance in estimated ratios also increases with greater sightability correction, which makes it difficult to
detect change in bull ratios between surveys. Notwithstanding the low precision of composition data,
there was a measurable reduction in bull ratios following the GOS hunt in the Slocan Valley and
Salmo/Pend d’Oreille units. Post-hunt ratios were well above policy minimums and similar to those
observed in the Kootenay valley near Creston (48:100 cows [CI: 32-64]; Stent and Mowat 2008).
Impact of GOS on ≥6-point Bulls
The proportion of ≥6-point bulls in the Lower Arrow, Slocan Valley and Salmo/Pend d'Oreille units
suggest high escapement of bulls from the 6-point GOS, although no bulls were observed in the Pend
d’Oreille survey blocks, suggesting high localized harvest in this area or, a strong behavioral response to
hunting pressure. A large proportion of ≥ 6-point bulls were observed in survey blocks close to Salmo
and we suspect some of these animals migrate from the Darkwoods private property in MU 4-07, where
hunting was not permitted in fall 2010. Estimated ≥6-point bull ratios were significantly lower in the
Nakusp area (7:100 cows), suggesting high bull harvest in 2010.
We re-analysed the 2004 data for the Slocan Valley so that ≥6-point bulls were analysed separately from
5-point bulls and found ≥6-point ratios were higher (46:100 cows [CI: 24-69]) in the 2004 survey than
the 2011 survey (21:100 cows [CI: 15-28). Similarly, the ≥6-point bull ratio in the South Selkirks was
higher in 2007 (46 ≥6-points:100 cows [CI: 28-65]) than 2011(26 ≥6-points:100 cows [CI: 16-36]), but
these ratios were not significantly different.
In conclusion, there was a decline in ≥6-point bull numbers in the Slocan Valley and Salmo/Pend
d’Oreille portions of the West Kootenay following the GOS hunt. We also assume there was a decline in
≥6-point bulls in the Nakusp unit as very few tags were allocated to these MUs prior to the GOS;
however pre-GOS bull ratio data are lacking for this area. The decline in ≥6-point bulls was expected
because only bulls with 6 or more antler points were open for hunting. A measurable number of ≥6-
point bulls escaped the hunt despite heavy hunting pressure, which demonstrates the hunt was
sustainable in this first year. The long-term impact of the hunt will take 4-5 years to evaluate because
we expect hunting pressure to decline as bull ratios decline.
West Kootenay Elk Composition Surveys
Ministry of Natural Resource Operations 2011 9
Spike and Raghorn Bull Ratios
The proportion of <6-points bulls seemed relatively low in all surveys in the West Kootenays, considering
younger age class bulls were not hunted in the West Kootenay in 2010 and only a small number were
likely harvested in prior years (a limited number of 3-point and better LEH tags were issued prior to 2010
but few smaller bulls were killed). A greater proportion of younger aged bulls may grow 6-points in their
3rd and 4th years in the West Kootenay as a result of the wetter climate, lower density populations, or
higher nutritional value in forage. Tooth age data showed 17% of 3 year old bulls and 56% of 4-year old
bulls harvested in the East Kootenay had ≥6-points, while 27% of 3 year old bulls and 78% of 4-year old
bulls harvested from the West Kootenay had ≥6-points (T. Szkorupa, MNRO, unpublished data). No
age/antler architecture data are available for yearling bulls; however the low number of spike-fork
antlered bulls detected in our survey suggests a sizable portion of yearling bull elk may have raghorn
antlers.
Survey Methods
Survey intensity was lower in MUs 4-16 and 4-17, where we did not stay within survey blocks and
focused effort to habitats believed to support high densities of elk. There was no significant difference in
bull ratios between blocks that were surveyed completely and areas that were high-graded; however
the difference in elevation distribution of bulls and cows show it is crucial to survey up to elevations
where tracks are no longer present to ensure samples are not biased towards cows, which may be
concentrated at lower elevations. Differences in group size of cows and bulls was a more significant
source of visibility bias in this survey than vegetation cover and we recommend future elk composition
surveys correct for incomplete sightability to maximize accuracy of bull ratios.
Forest cover in the northern part of the Arrow Lakes area was very dense and we feel we missed quite a
few elk in the Innanoaklin area despite surveying much of the best winter habitat. We saw a large group
of cows that were being fed near Edgewood but were not able to count or classify the group properly.
We could not herd the group out of the trees because the trees were so tall the helicopter did not scare
the elk enough to move them into the open. Local knowledge suggested that to ensure we sighted most
bulls we would have had to survey a large area surrounding the Innanoaklin valley. We had surveyed
about half the suggested area but saw only 2 bull elk. We conclude that to properly measure bull ratios
in this population it will require much more flying effort than other populations of that size. Higher snow
depths would reduce the cost since elk would be more concentrated at lower elevations.
Acknowledgements
We thank pilots Vic Corrie and Ray Taylor from Range Helicopters for safe and professional service. We
would like to thank the following observers who participated in the elk composition surveys: A. Chirico,
I. Teske, G. Mowat, D. Heagy, A. Reid, C. Gaynor, T. Roos, B. Beetlestone, L. Tedesco and K. Murphy.
Biologists A. Reid, R. Clarke and T. Hill provided elk composition data from the South Monashee and
West Kootenay Elk Composition Surveys
Ministry of Natural Resource Operations 2011 10
South Selkirk ungulate surveys. I would also like to thank Deer Park resident John Erikson for allowing us
to establish a fuel Cache in Deer Park. Finally, I would like to thank T. Szkorupa and G. Mowat for
reviewing earlier drafts of this report. Funding for this survey was provided by the Ministry of Natural
Resource Operations.
Literature Cited
Beswick, S. and A. Fontana. 2004. East Kootenay Trench winter range elk population technical report:
2004. Kootenay Natural Resource Consulting, Cranbrook, BC.
Biederbeck, H.H., M.C. Boulay and D.H. Jackson. 2001. Effects of hunting regulations on bull elk survival
and age structure. Wildlife Society Bulletin 29(4): 1271-1277.
Braumandl, T. F., and M. P. Curran. 2002. A field guide for site identification for the Nelson Forest Region. British Columbia Ministry of Forests, Victoria, British Columbia, Canada.
DeGroot, L. 2005. Slocan Valley Elk Study Aerial Survey Report 2004. Prepared for Columbia Basin Fish
and Wildlife Compensation Program, Nelson, British Columbia. Frisina, M.R., C.L. Wambolt., W.W. Fraas and G. Guenther. 2008. Mule deer and elk winter diet as an
indicator of habitat competition. USDA Forest Service Proceedings: 123-126. Johnson, B.K., J.W. Kearn., M.J. Wisdom and F.L. Findholt. 2000. Resource selection and spatial
separation of mule deer and elk during spring. Journal of Wildlife Management 64: 685-697.Ministry of Environment (MoE). 2010. 2010-14 Kootenay Elk Management Plan. Ministry of Environment, Province of British Columbia, Cranbrook, B.C., 39 pp.
Mowat, G. and G. Kuzyk. 2009. Mule deer and white-tailed deer population review for the Kootenay
region of British Columbia. Unpublished report for Ministry of Environment, Nelson B.C., 29 pp. Mowat, G. 2007. Large Carnivore Population Review for the Kootenay Region. British Columbia Ministry
of Environment, Kootenay Region, Nelson, British Columbia. Phillips, B., T. Szkorupa, G. Mowat and P. Stent. 2008. 2008 East Kootenay Trench Elk Inventory. Ministry
of Environment, Cranbrook, British Columbia. Raedeke, K. J. and D. A. M. Raedeke. 1998. Assessment of Harvest Strategies for Rocky Mountain Elk.
Report to the Ministry of the Environment. Raedeke Associates Inc., Seattle, Washington RISC (Resources Information Standards Committee). 2002. Aerial-based inventory methods for selected
ungulates: bison, mountain goat, mountain sheep, moose, elk, deer and caribou. Standards for components of British Columbia’s biodiversity No. 32. Version 2.0. Resources Inventory Committee, B.C. Ministry of Sustainable Resource Management, Victoria, British Columbia.
West Kootenay Elk Composition Surveys
Ministry of Natural Resource Operations 2011 11
Robinson, H. and R. Clarke. 2007. Ungulate aerial survey analysis and summary 200, 2004 and 2007 in the South Selkirk Mountains of southeastern British Columbia. Report for Fish and Wildlife Compensation Program, Nelson, B.C.
Robinson, H.S., R.B. Wielgus and J.C. Gwilliam. 2002. Cougar predation and population growth of
sympatric mule deer and white-tailed deer. Can. J. Zool 50: 556-568. Stent, P. 2009. Kootenay mule deer composition surveys: Winter 2009/10. Unpublished report for
Ministry of Environment, Environmental Stewardship, Nelson B.C., 23 pp. Stent, P. and G. Mowat. 2008. Creston Elk Population Inventory 2008. Ministry of Environment,
Kootenay Region, Nelson, British Columbia. Szkorupa, T. and G. Mowat. 2010. A population review for elk in the Kootenay Region. Report prepared
for the Ministry of Environment, Environmental Stewardship Division, Cranbrook B.C., 61 pp. Tinker, M. T., P. C. Heaven and L. Ingham. 1997. Columbia Basin Large Mammal Monitoring: 1994-97
Aerial Surveys. Prepared for Columbia Basin Fish and Wildlife Compensation Program. Glenside Ecological services, Victoria, British Columbia.
Unsworth, J. W., F. A. Leboan, E. O. Garton, D. J. Leptich, and P. Zager. 1999. Aerial survey: user’s
manual. Electronic edition. Idaho Department of Fish and Game, Boise, Idaho.
West Kootenay Elk Composition Surveys
Ministry of Natural Resource Operations 2011 12
Appendix 1: Mountain Goat observations scaled to group size in MU 4-17 (Passmore) from elk composition surveys, February 2nd, 2011.


