Page 1
Southeast Environmental Research Center OE-148 Florida International University, Miami, FL 33199
305-348-3095, 305-348-4096 fax, http://serc.fiu.edu
20 April 2007 Michael Wright SFWMD Water Quality Analysis Division 1480 Skees Road West Palm Beach, Florida 33411-2642 Re: South Florida Coastal Water Quality Monitoring Network Oct. – Dec. 2006 Quarterly Report for SFWMD Contract #4600000352 Dear Mr. Wright: This letter serves to transmit the South Florida Coastal Water Quality Monitoring Network Quarterly Report as per SFWMD Contract #4600000352. This report consists of this letter along with corresponding tables and figures. Project Background This report includes water quality data collected monthly during the annual period of record (POR) Oct. – Dec. 2006 from 28 stations in Florida Bay, 22 stations in Whitewater Bay, 25 stations in Ten Thousand Islands, 25 stations in Biscayne Bay, and 28 stations in Cape Romano-Rookery Bay-Pine Island Sound. A total of 49 stations were also collected on the SW Florida Shelf on a quarterly basis. Figure 1 shows the location of the fixed sampling stations. Water quality parameters monitored at each station include the dissolved nutrients nitrate + nitrite (NOx), nitrite (NO2), nitrate (NO3), ammonium (NH4), inorganic nitrogen (DIN), and soluble reactive phosphorus (SRP). Silicate (Si(OH)4) was analyzed at all stations on a quarterly basis in conjunction with SW Shelf sampling. Total concentrations of nitrogen (TN), organic nitrogen (TON), phosphorus (TP), and organic carbon (TOC) were also measured. All concentrations for each of these parameters are reported as parts per million (ppm) except where noted. Biological parameters monitored included chlorophyll a (µg l-1) and alkaline phosphatase activity (APA; µM hr-1). Field parameters measured at both surface and bottom of the water column include salinity, dissolved oxygen (DO; mg l-1), and temperature (oC). Turbidity (NTU) of the surface water was also measured.
Page 2
2
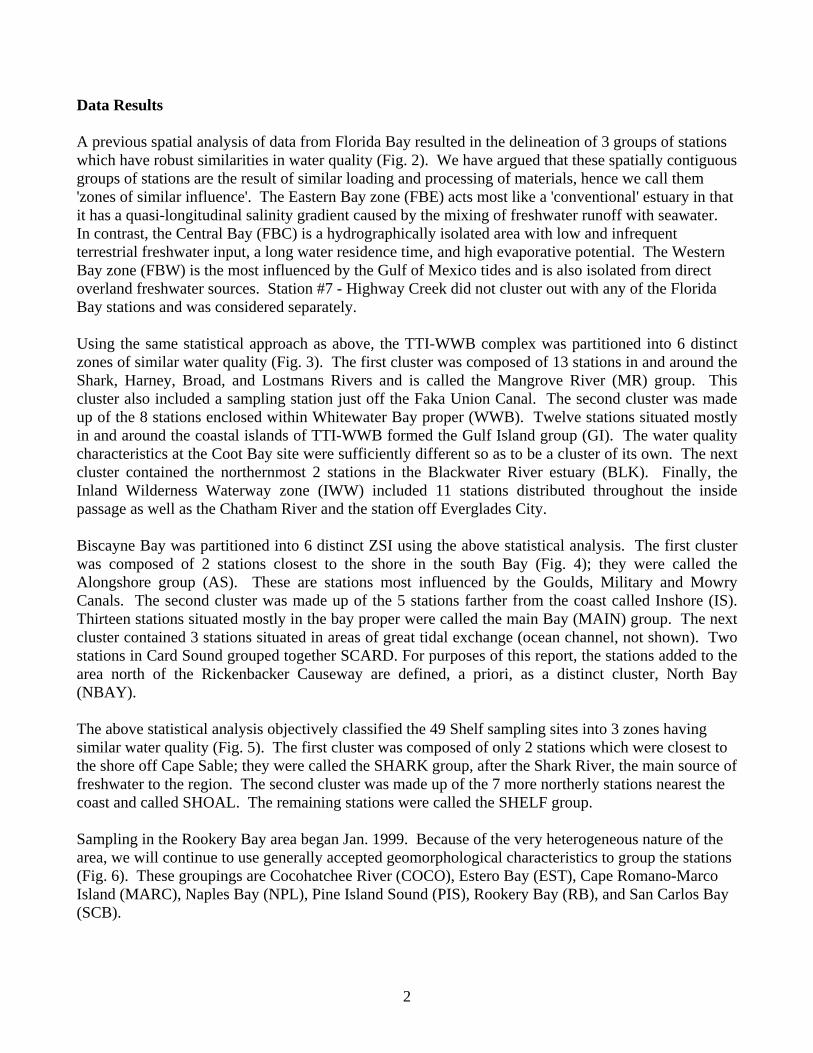
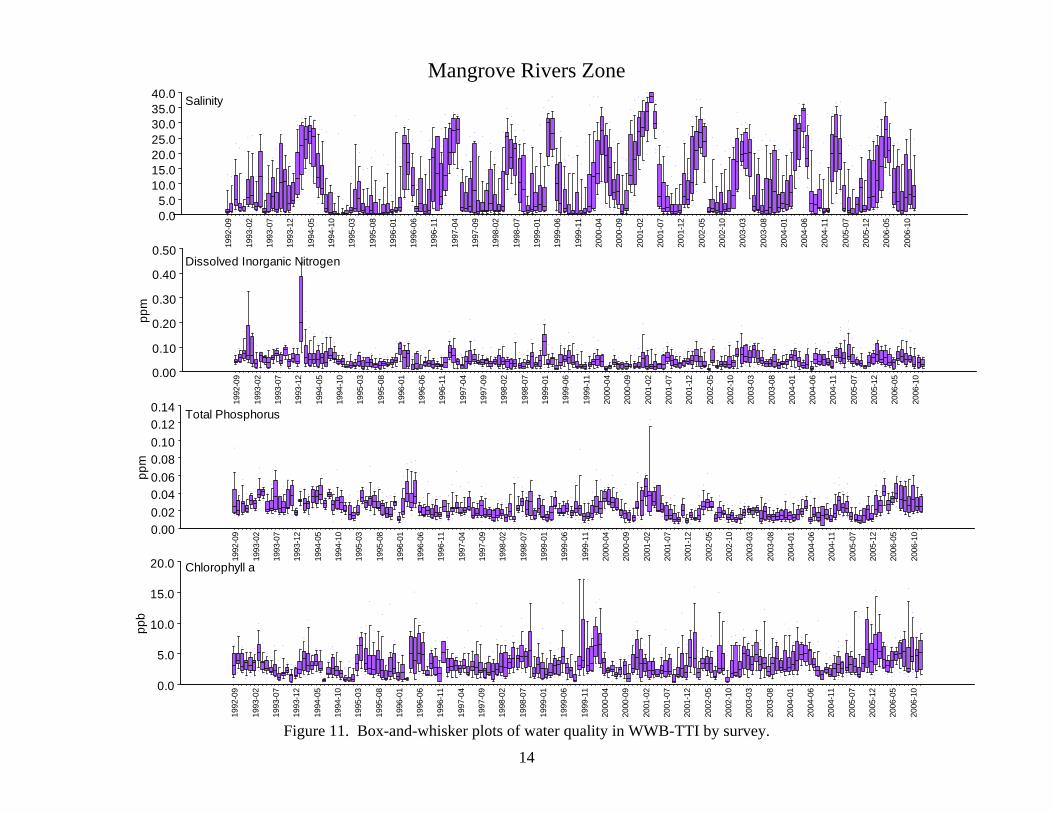
Data Results A previous spatial analysis of data from Florida Bay resulted in the delineation of 3 groups of stations which have robust similarities in water quality (Fig. 2). We have argued that these spatially contiguous groups of stations are the result of similar loading and processing of materials, hence we call them 'zones of similar influence'. The Eastern Bay zone (FBE) acts most like a 'conventional' estuary in that it has a quasi-longitudinal salinity gradient caused by the mixing of freshwater runoff with seawater. In contrast, the Central Bay (FBC) is a hydrographically isolated area with low and infrequent terrestrial freshwater input, a long water residence time, and high evaporative potential. The Western Bay zone (FBW) is the most influenced by the Gulf of Mexico tides and is also isolated from direct overland freshwater sources. Station #7 - Highway Creek did not cluster out with any of the Florida Bay stations and was considered separately. Using the same statistical approach as above, the TTI-WWB complex was partitioned into 6 distinct zones of similar water quality (Fig. 3). The first cluster was composed of 13 stations in and around the Shark, Harney, Broad, and Lostmans Rivers and is called the Mangrove River (MR) group. This cluster also included a sampling station just off the Faka Union Canal. The second cluster was made up of the 8 stations enclosed within Whitewater Bay proper (WWB). Twelve stations situated mostly in and around the coastal islands of TTI-WWB formed the Gulf Island group (GI). The water quality characteristics at the Coot Bay site were sufficiently different so as to be a cluster of its own. The next cluster contained the northernmost 2 stations in the Blackwater River estuary (BLK). Finally, the Inland Wilderness Waterway zone (IWW) included 11 stations distributed throughout the inside passage as well as the Chatham River and the station off Everglades City. Biscayne Bay was partitioned into 6 distinct ZSI using the above statistical analysis. The first cluster was composed of 2 stations closest to the shore in the south Bay (Fig. 4); they were called the Alongshore group (AS). These are stations most influenced by the Goulds, Military and Mowry Canals. The second cluster was made up of the 5 stations farther from the coast called Inshore (IS). Thirteen stations situated mostly in the bay proper were called the main Bay (MAIN) group. The next cluster contained 3 stations situated in areas of great tidal exchange (ocean channel, not shown). Two stations in Card Sound grouped together SCARD. For purposes of this report, the stations added to the area north of the Rickenbacker Causeway are defined, a priori, as a distinct cluster, North Bay (NBAY). The above statistical analysis objectively classified the 49 Shelf sampling sites into 3 zones having similar water quality (Fig. 5). The first cluster was composed of only 2 stations which were closest to the shore off Cape Sable; they were called the SHARK group, after the Shark River, the main source of freshwater to the region. The second cluster was made up of the 7 more northerly stations nearest the coast and called SHOAL. The remaining stations were called the SHELF group. Sampling in the Rookery Bay area began Jan. 1999. Because of the very heterogeneous nature of the area, we will continue to use generally accepted geomorphological characteristics to group the stations (Fig. 6). These groupings are Cocohatchee River (COCO), Estero Bay (EST), Cape Romano-Marco Island (MARC), Naples Bay (NPL), Pine Island Sound (PIS), Rookery Bay (RB), and San Carlos Bay (SCB).
Page 3
3
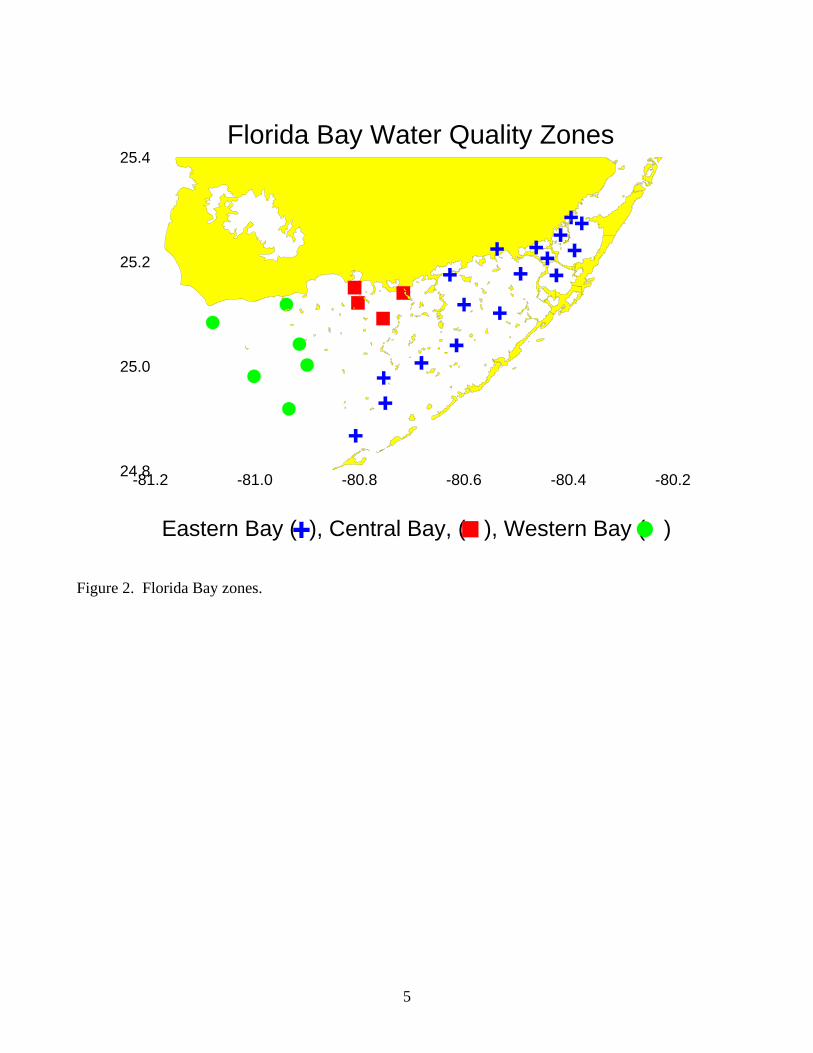
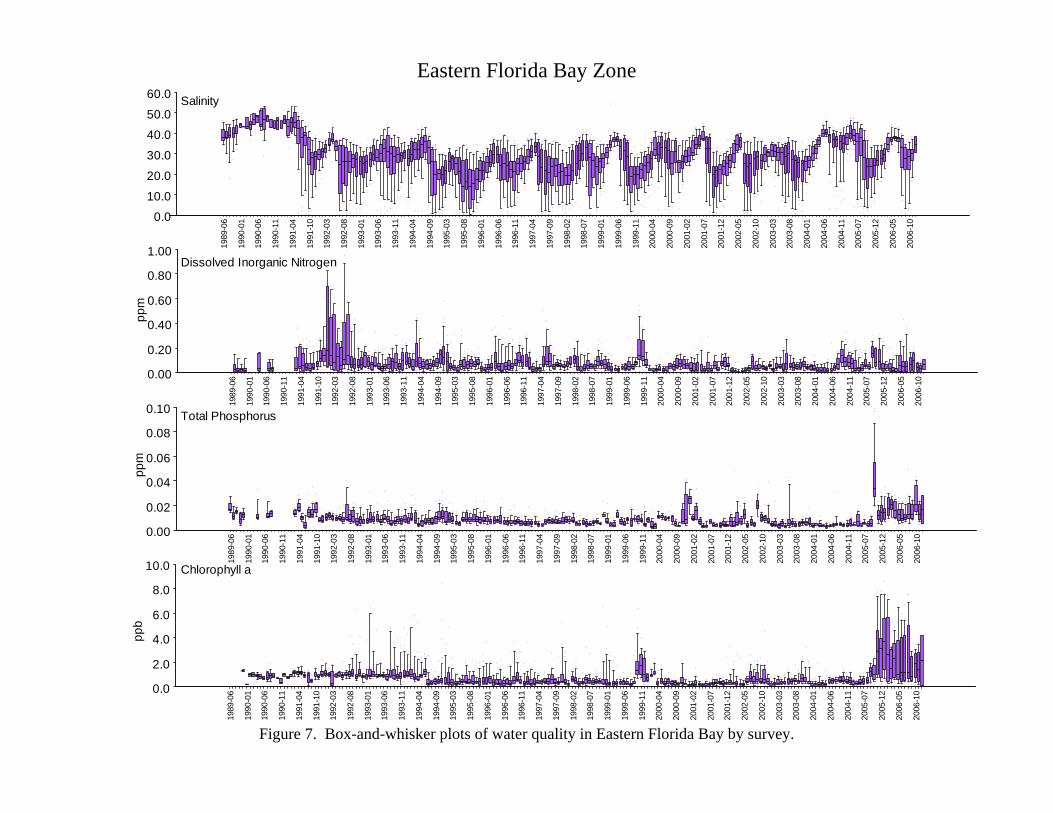
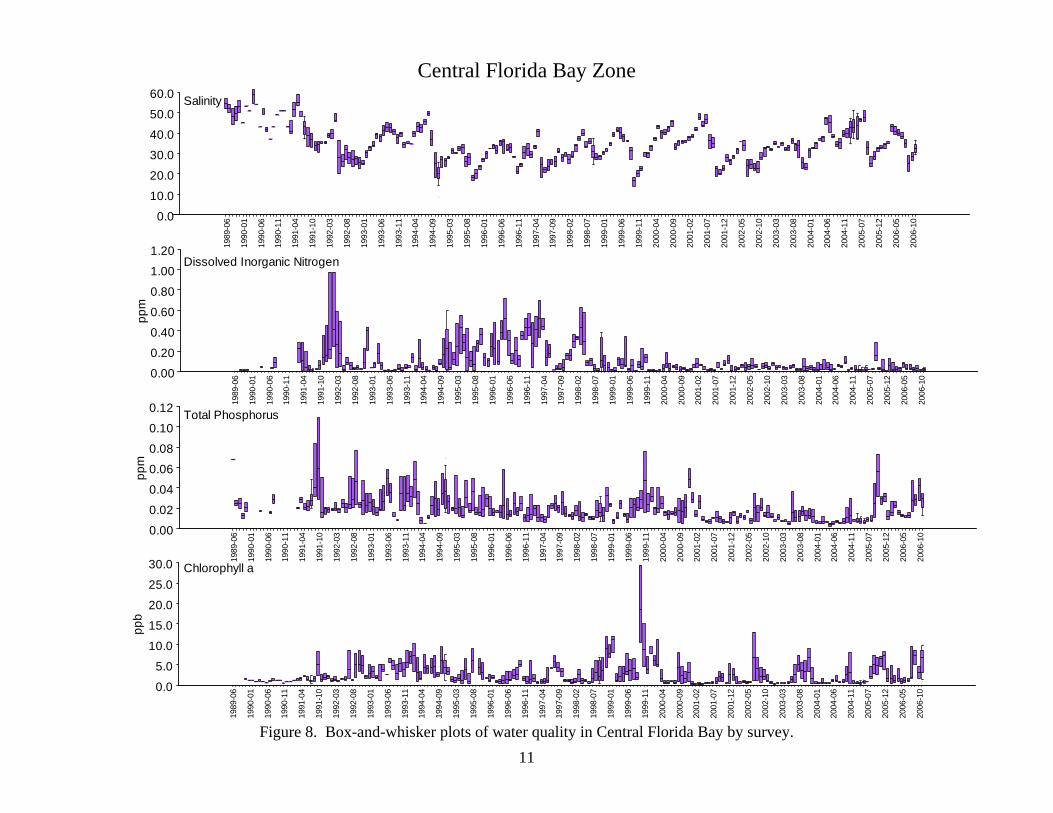
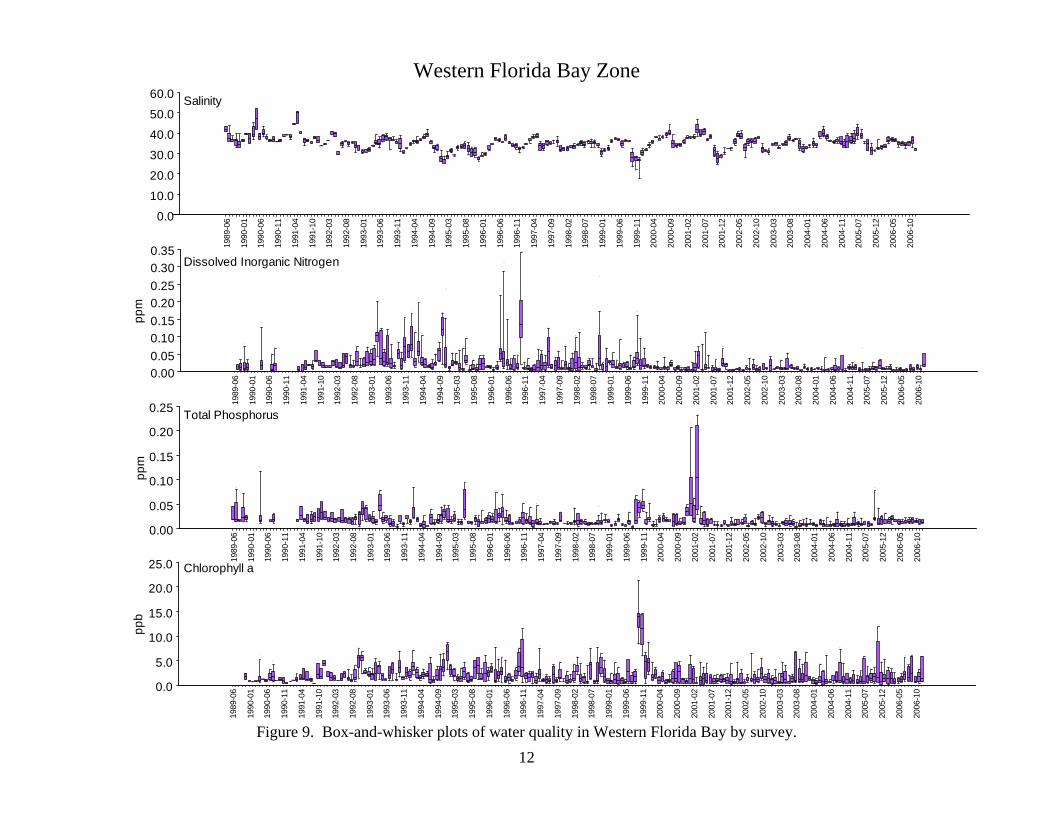
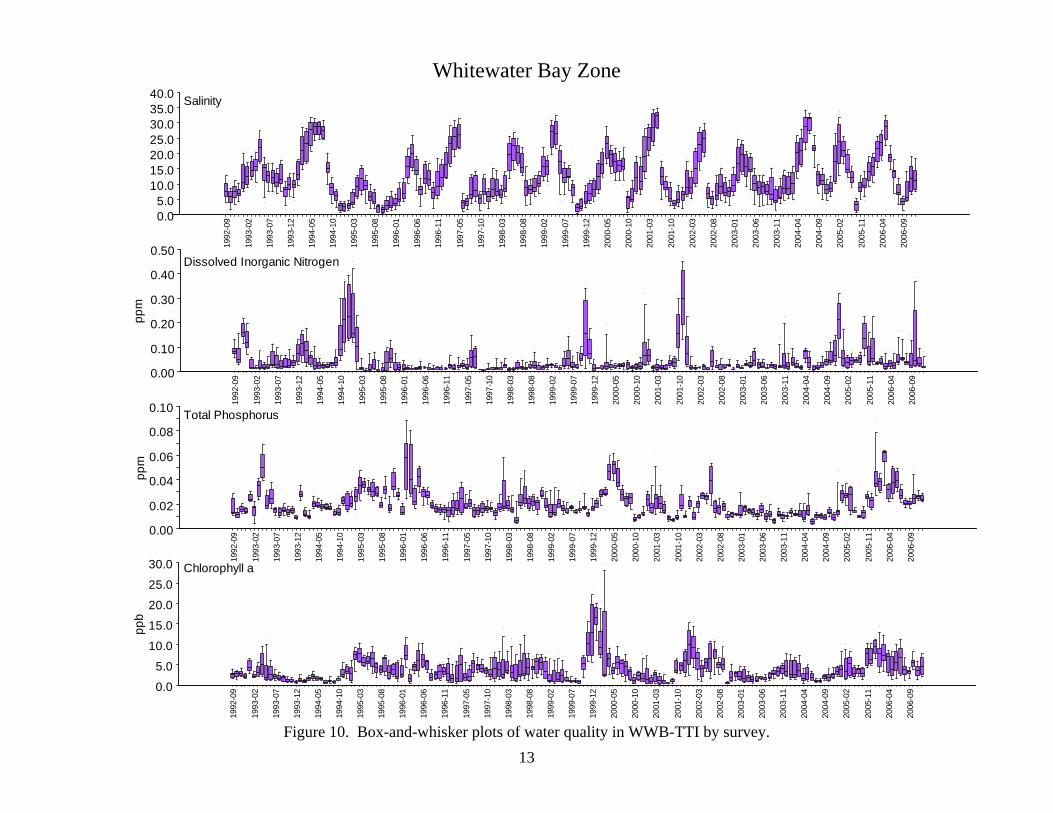
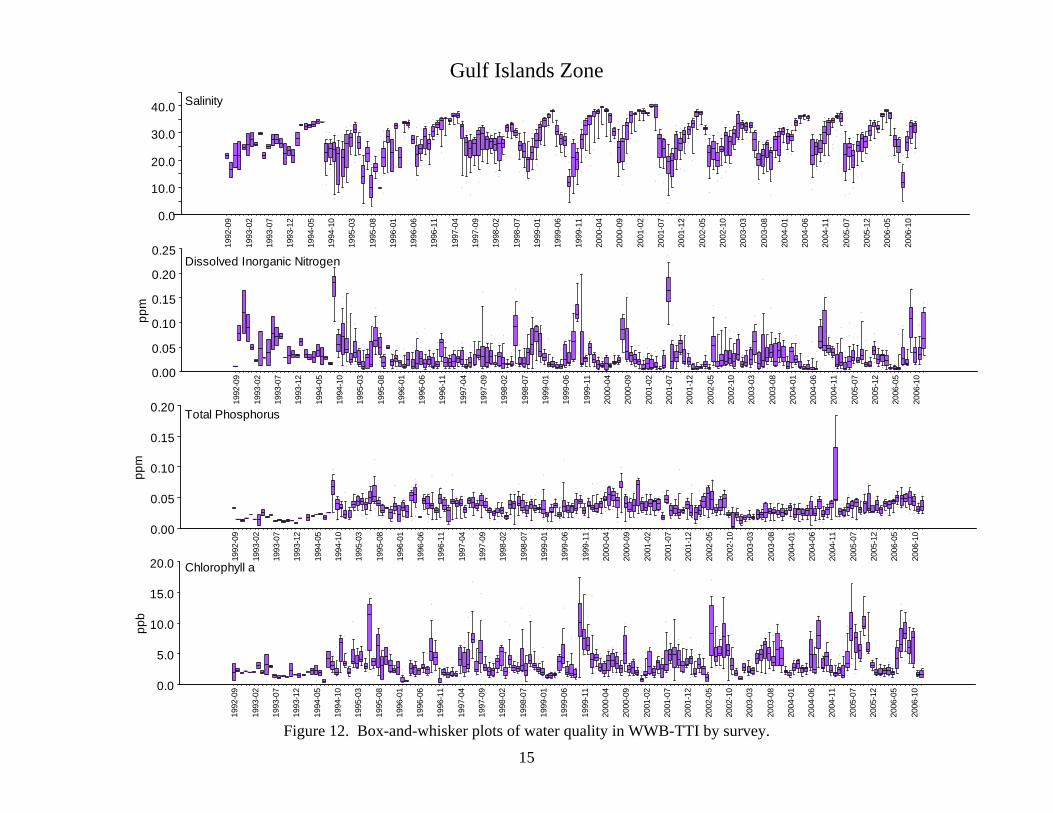
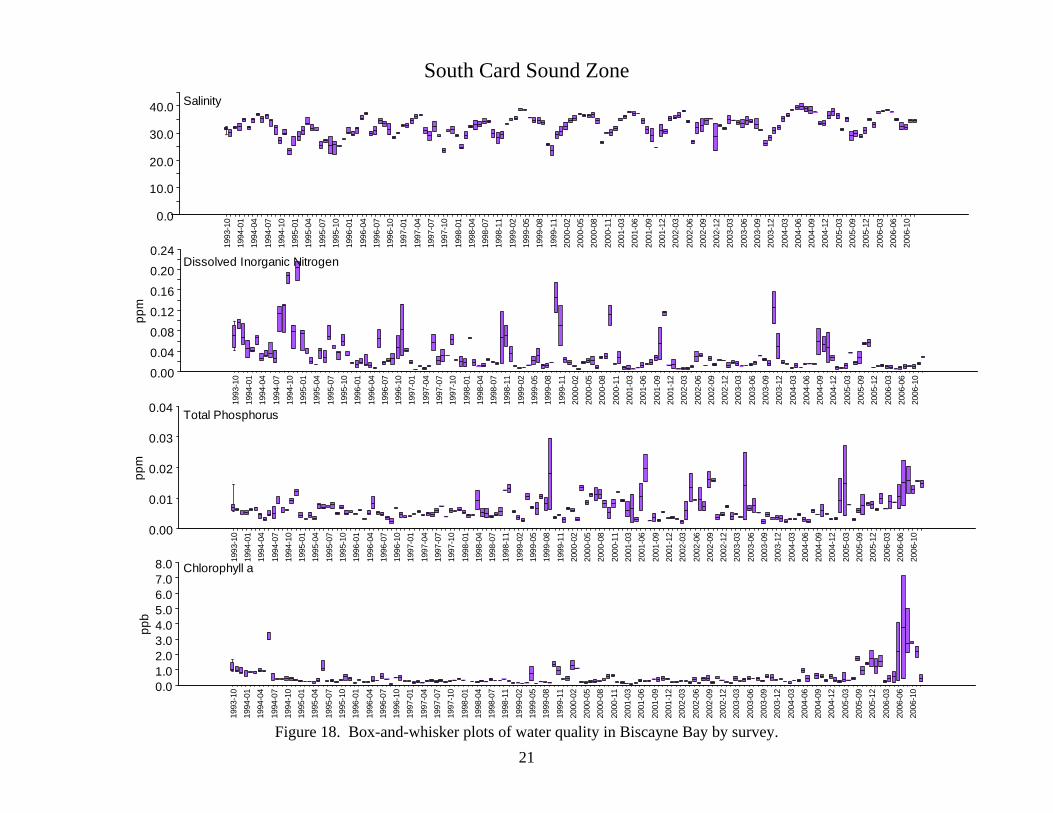
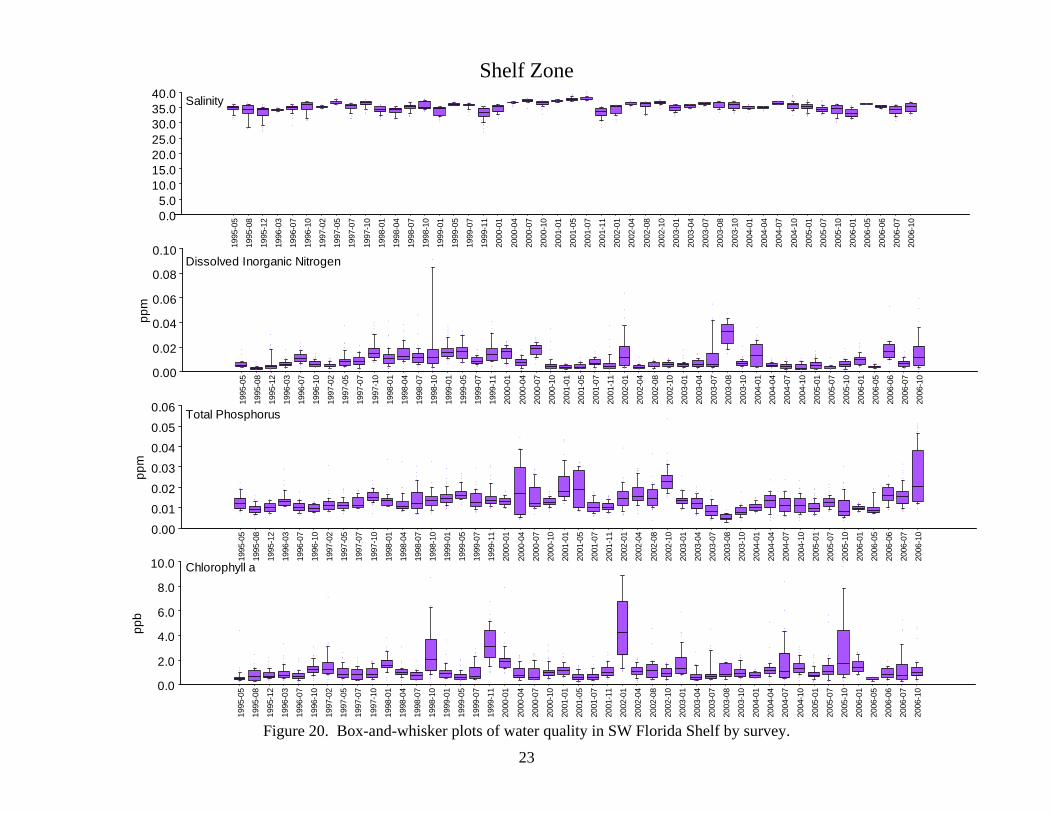
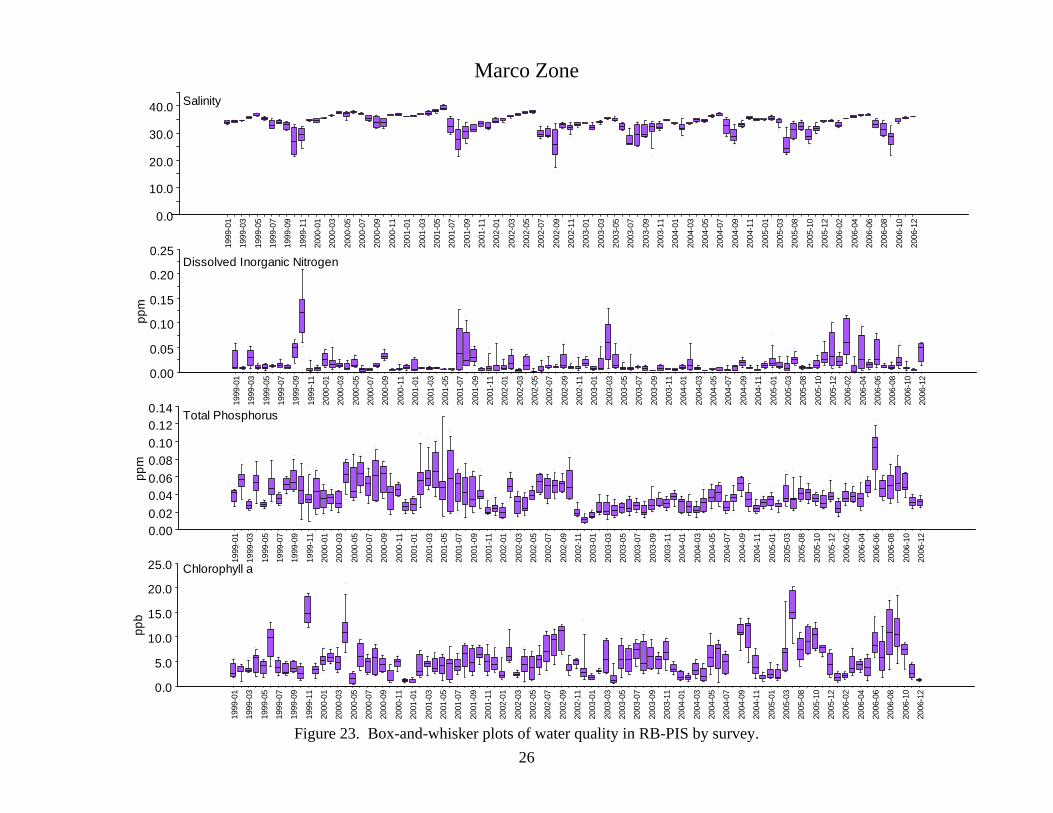
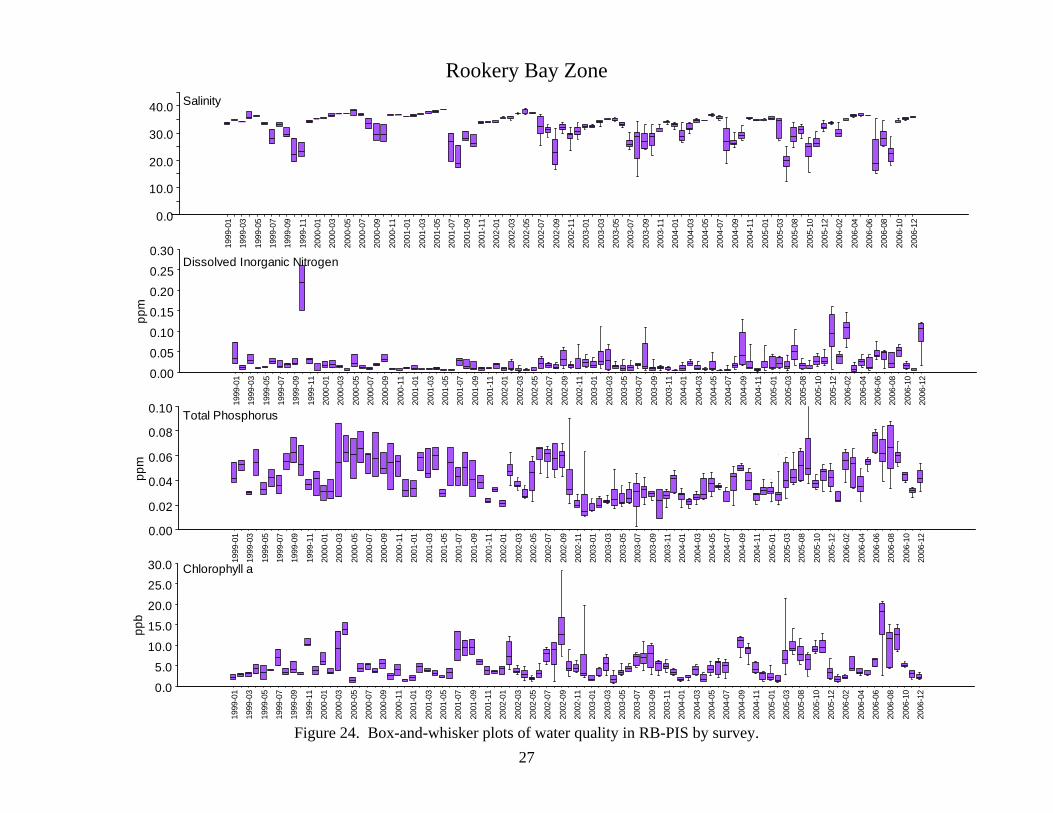
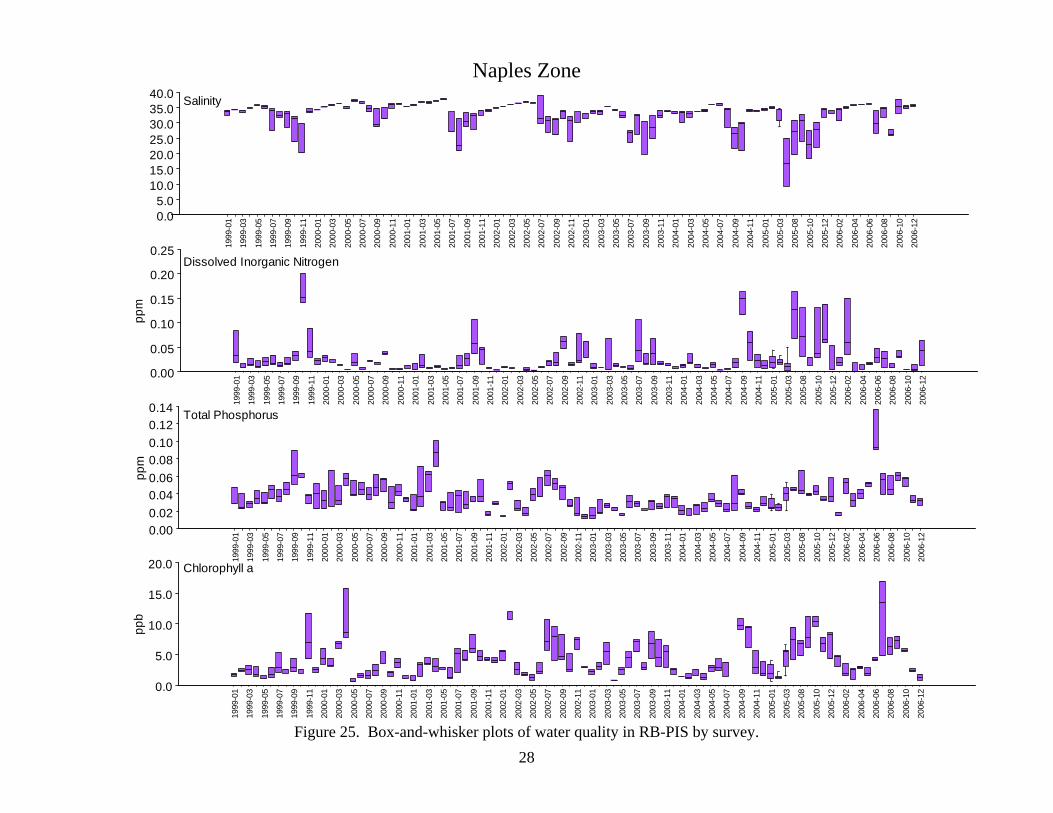
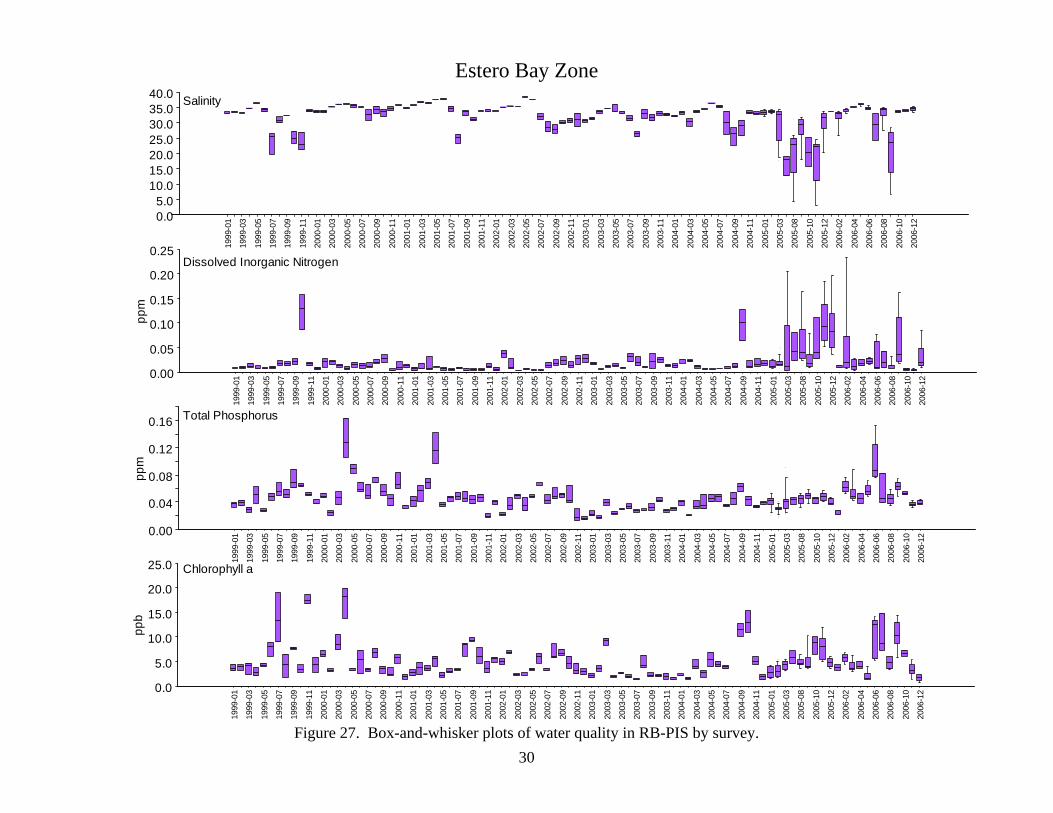
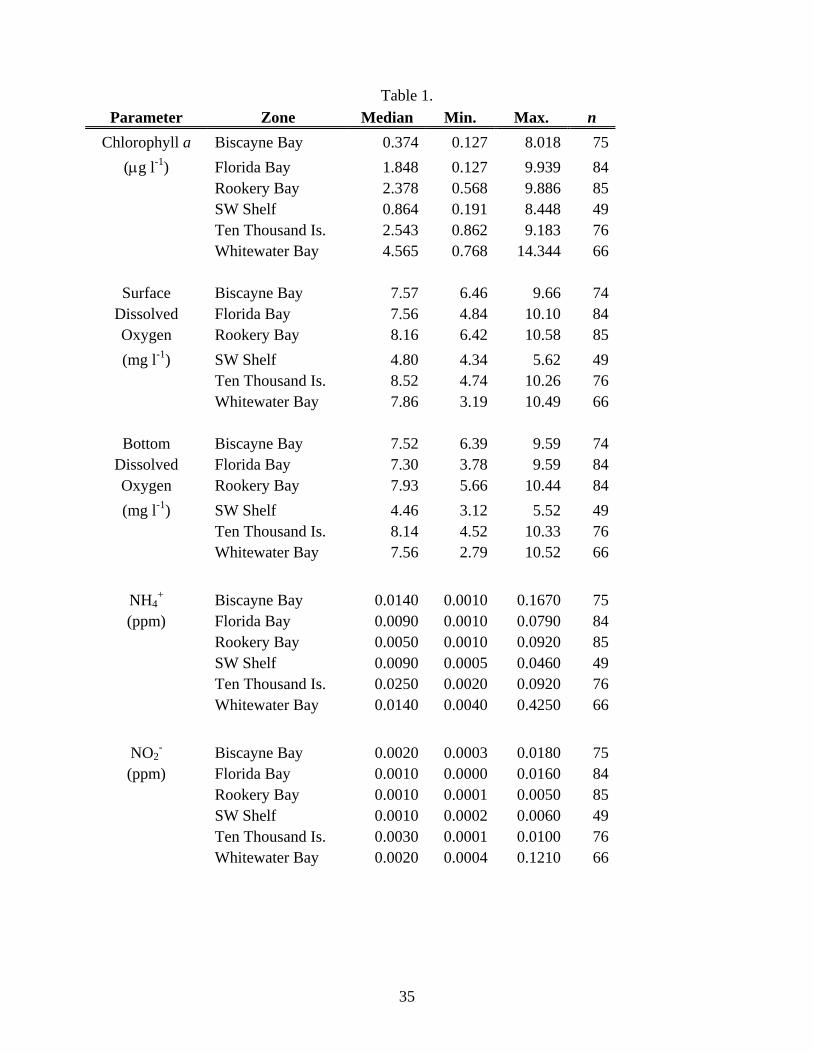
Data are also reported as box-and-whiskers plots (Figs. 7-29). The center horizontal line in the box is the median of the data, the top and bottom of the box are the 25th and 75th percentiles (quartiles), and the ends of the whiskers are the 5th and 95th percentiles. Summary statistics of all water quality parameters by ecosystem are shown in Table 1. The median was chosen because it is a more accurate measure of central tendency in non-normally distributed water quality data. The range is expressed as the minimum (Min.) and maximum (Max.) values for the POR, and n is the number of data points used in the analysis. The cyanobacterial bloom in Eastern Florida Bay continued through this period (Fig.7). We are not sure as to the cause of the bloom but it was widespread affecting Card Sound, Barnes Sound, Manatee Bay, Blackwater Sound, Little Blackwater Sound, and most of Eastern Florida Bay. We will continue to analyze this and other data in conjunction with other agency scientists in an effort to provide an explanation. Note that 2006 TP and CHLA have been some of the highest levels ever seen in Eastern Florida Bay (Fig. 30). Also note the increasing trend in TP seen in Biscayne Bay for the last year (Fig 16-18). If you have any questions about the content of this report, please do not hesitate to contact me at 305-348-4076 or [email protected] . Sincerely,
Joseph N. Boyer, Ph.D. Henry O. Briceño, Ph.D. Associate Director and Scientist Assistant Scientist
Page 4
4
Figure 1: All fixed water quality stations funded by this SFWMD project.
Page 5
5
Figure 2. Florida Bay zones.
-81.2 -81.0 -80.8 -80.6 -80.4 -80.224.8
25.0
25.2
25.4Florida Bay Water Quality Zones
Eastern Bay ( ), Central Bay, ( ), Western Bay ( )
Page 6
6
Figure 3. WWB-TTI water quality zones.
-81.5 -81.025.0
25.5
26.0
4243
444546 474849
2930 31
32333435
3637 38
39
63
70
4041
5152
6566
6768
69717273
50
7475
53545556
57585960
6162
64Faka Union Canal
Everglades City
Blackwater River
Gulf IslandsInner Waterway
MangroveRivers
Coot Bay
WhitewaterBay
Mangrove Rivers, Whitewater Bay, Gulf Islands,Coot Bay, Blackwater River, Inner Waterway
Page 7
7
Figure 4. Biscayne Bay water quality zones.
-80.4 -80.3 -80.2 -80.1
25.5
26.0
101
102
103
110
122
127
128
104
108109
111
112
113
116
123
124
126
129
121
135
130
131132
133
134
Miami
Alongshore, Inshore, Main Bay, North Bay, South Card Sound
Page 8
8
Figure 5. SW Florida Shelf water quality zones.
-82.0 -81.5 -81.024.5
25.0
25.5
26.0
364
384
385386
387
388
389
390
399
351
352
353
354
355
356
357
358
359
360
361
362
363
365
366
367
368
369
370
371
372
373
374
375
376
377
378
379
380
381
382
383
391
392
393
394395
396
397
398
Shark, Shoal, Shelf
Page 9
9
Figure 6. SW estuaries.
-82.3 -82.2 -82.1 -82.0 -81.9 -81.8 -81.7 -81.625.8
25.9
26.0
26.1
26.2
26.3
26.4
26.5
26.6
26.7
Estero Bay
Rookery Bay
Marco Island
Naples Bay
Pine IslandSound
San CarlosBay
Page 10
Eastern Florida Bay Zone
0.0
10.0
20.0
30.0
40.0
50.0
60.0
1989
-06
1990
-01
1990
-06
1990
-11
1991
-04
1991
-10
1992
-03
1992
-08
1993
-01
1993
-06
1993
-11
1994
-04
1994
-09
1995
-03
1995
-08
1996
-01
1996
-06
1996
-11
1997
-04
1997
-09
1998
-02
1998
-07
1999
-01
1999
-06
1999
-11
2000
-04
2000
-09
2001
-02
2001
-07
2001
-12
2002
-05
2002
-10
2003
-03
2003
-08
2004
-01
2004
-06
2004
-11
2005
-07
2005
-12
2006
-05
2006
-10
0.00
0.20
0.40
0.60
0.80
1.00
ppm
1989
-06
1990
-01
1990
-06
1990
-11
1991
-04
1991
-10
1992
-03
1992
-08
1993
-01
1993
-06
1993
-11
1994
-04
1994
-09
1995
-03
1995
-08
1996
-01
1996
-06
1996
-11
1997
-04
1997
-09
1998
-02
1998
-07
1999
-01
1999
-06
1999
-11
2000
-04
2000
-09
2001
-02
2001
-07
2001
-12
2002
-05
2002
-10
2003
-03
2003
-08
2004
-01
2004
-06
2004
-11
2005
-07
2005
-12
2006
-05
2006
-10
0.00
0.02
0.04
0.06
0.08
0.10
ppm
1989
-06
1990
-01
1990
-06
1990
-11
1991
-04
1991
-10
1992
-03
1992
-08
1993
-01
1993
-06
1993
-11
1994
-04
1994
-09
1995
-03
1995
-08
1996
-01
1996
-06
1996
-11
1997
-04
1997
-09
1998
-02
1998
-07
1999
-01
1999
-06
1999
-11
2000
-04
2000
-09
2001
-02
2001
-07
2001
-12
2002
-05
2002
-10
2003
-03
2003
-08
2004
-01
2004
-06
2004
-11
2005
-07
2005
-12
2006
-05
2006
-10
0.0
2.0
4.0
6.0
8.0
10.0
ppb
1989
-06
1990
-01
1990
-06
1990
-11
1991
-04
1991
-10
1992
-03
1992
-08
1993
-01
1993
-06
1993
-11
1994
-04
1994
-09
1995
-03
1995
-08
1996
-01
1996
-06
1996
-11
1997
-04
1997
-09
1998
-02
1998
-07
1999
-01
1999
-06
1999
-11
2000
-04
2000
-09
2001
-02
2001
-07
2001
-12
2002
-05
2002
-10
2003
-03
2003
-08
2004
-01
2004
-06
2004
-11
2005
-07
2005
-12
2006
-05
2006
-10
Salinity
Dissolved Inorganic Nitrogen
Total Phosphorus
Chlorophyll a
Figure 7. Box-and-whisker plots of water quality in Eastern Florida Bay by survey.
Page 11
11
Central Florida Bay Zone
0.0
10.0
20.0
30.0
40.0
50.0
60.0
1989
-06
1990
-01
1990
-06
1990
-11
1991
-04
1991
-10
1992
-03
1992
-08
1993
-01
1993
-06
1993
-11
1994
-04
1994
-09
1995
-03
1995
-08
1996
-01
1996
-06
1996
-11
1997
-04
1997
-09
1998
-02
1998
-07
1999
-01
1999
-06
1999
-11
2000
-04
2000
-09
2001
-02
2001
-07
2001
-12
2002
-05
2002
-10
2003
-03
2003
-08
2004
-01
2004
-06
2004
-11
2005
-07
2005
-12
2006
-05
2006
-10
0.00
0.20
0.40
0.60
0.80
1.00
1.20
ppm
1989
-06
1990
-01
1990
-06
1990
-11
1991
-04
1991
-10
1992
-03
1992
-08
1993
-01
1993
-06
1993
-11
1994
-04
1994
-09
1995
-03
1995
-08
1996
-01
1996
-06
1996
-11
1997
-04
1997
-09
1998
-02
1998
-07
1999
-01
1999
-06
1999
-11
2000
-04
2000
-09
2001
-02
2001
-07
2001
-12
2002
-05
2002
-10
2003
-03
2003
-08
2004
-01
2004
-06
2004
-11
2005
-07
2005
-12
2006
-05
2006
-10
0.00
0.02
0.04
0.06
0.08
0.10
0.12
ppm
1989
-06
1990
-01
1990
-06
1990
-11
1991
-04
1991
-10
1992
-03
1992
-08
1993
-01
1993
-06
1993
-11
1994
-04
1994
-09
1995
-03
1995
-08
1996
-01
1996
-06
1996
-11
1997
-04
1997
-09
1998
-02
1998
-07
1999
-01
1999
-06
1999
-11
2000
-04
2000
-09
2001
-02
2001
-07
2001
-12
2002
-05
2002
-10
2003
-03
2003
-08
2004
-01
2004
-06
2004
-11
2005
-07
2005
-12
2006
-05
2006
-10
0.0
5.0
10.0
15.0
20.0
25.0
30.0
ppb
1989
-06
1990
-01
1990
-06
1990
-11
1991
-04
1991
-10
1992
-03
1992
-08
1993
-01
1993
-06
1993
-11
1994
-04
1994
-09
1995
-03
1995
-08
1996
-01
1996
-06
1996
-11
1997
-04
1997
-09
1998
-02
1998
-07
1999
-01
1999
-06
1999
-11
2000
-04
2000
-09
2001
-02
2001
-07
2001
-12
2002
-05
2002
-10
2003
-03
2003
-08
2004
-01
2004
-06
2004
-11
2005
-07
2005
-12
2006
-05
2006
-10
Salinity
Dissolved Inorganic Nitrogen
Total Phosphorus
Chlorophyll a
Figure 8. Box-and-whisker plots of water quality in Central Florida Bay by survey.
Page 12
12
Western Florida Bay Zone
0.0
10.0
20.0
30.0
40.0
50.0
60.0
1989
-06
1990
-01
1990
-06
1990
-11
1991
-04
1991
-10
1992
-03
1992
-08
1993
-01
1993
-06
1993
-11
1994
-04
1994
-09
1995
-03
1995
-08
1996
-01
1996
-06
1996
-11
1997
-04
1997
-09
1998
-02
1998
-07
1999
-01
1999
-06
1999
-11
2000
-04
2000
-09
2001
-02
2001
-07
2001
-12
2002
-05
2002
-10
2003
-03
2003
-08
2004
-01
2004
-06
2004
-11
2005
-07
2005
-12
2006
-05
2006
-10
0.000.050.100.150.200.250.300.35
ppm
1989
-06
1990
-01
1990
-06
1990
-11
1991
-04
1991
-10
1992
-03
1992
-08
1993
-01
1993
-06
1993
-11
1994
-04
1994
-09
1995
-03
1995
-08
1996
-01
1996
-06
1996
-11
1997
-04
1997
-09
1998
-02
1998
-07
1999
-01
1999
-06
1999
-11
2000
-04
2000
-09
2001
-02
2001
-07
2001
-12
2002
-05
2002
-10
2003
-03
2003
-08
2004
-01
2004
-06
2004
-11
2005
-07
2005
-12
2006
-05
2006
-10
0.00
0.05
0.10
0.15
0.20
0.25
ppm
1989
-06
1990
-01
1990
-06
1990
-11
1991
-04
1991
-10
1992
-03
1992
-08
1993
-01
1993
-06
1993
-11
1994
-04
1994
-09
1995
-03
1995
-08
1996
-01
1996
-06
1996
-11
1997
-04
1997
-09
1998
-02
1998
-07
1999
-01
1999
-06
1999
-11
2000
-04
2000
-09
2001
-02
2001
-07
2001
-12
2002
-05
2002
-10
2003
-03
2003
-08
2004
-01
2004
-06
2004
-11
2005
-07
2005
-12
2006
-05
2006
-10
0.0
5.0
10.0
15.0
20.0
25.0
ppb
1989
-06
1990
-01
1990
-06
1990
-11
1991
-04
1991
-10
1992
-03
1992
-08
1993
-01
1993
-06
1993
-11
1994
-04
1994
-09
1995
-03
1995
-08
1996
-01
1996
-06
1996
-11
1997
-04
1997
-09
1998
-02
1998
-07
1999
-01
1999
-06
1999
-11
2000
-04
2000
-09
2001
-02
2001
-07
2001
-12
2002
-05
2002
-10
2003
-03
2003
-08
2004
-01
2004
-06
2004
-11
2005
-07
2005
-12
2006
-05
2006
-10
Salinity
Dissolved Inorganic Nitrogen
Total Phosphorus
Chlorophyll a
Figure 9. Box-and-whisker plots of water quality in Western Florida Bay by survey.
Page 13
13
Whitewater Bay Zone
0.05.0
10.015.020.025.030.035.040.0
1992
-09
1993
-02
1993
-07
1993
-12
1994
-05
1994
-10
1995
-03
1995
-08
1996
-01
1996
-06
1996
-11
1997
-05
1997
-10
1998
-03
1998
-08
1999
-02
1999
-07
1999
-12
2000
-05
2000
-10
2001
-03
2001
-10
2002
-03
2002
-08
2003
-01
2003
-06
2003
-11
2004
-04
2004
-09
2005
-02
2005
-11
2006
-04
2006
-09
0.00
0.10
0.20
0.30
0.40
0.50
ppm
1992
-09
1993
-02
1993
-07
1993
-12
1994
-05
1994
-10
1995
-03
1995
-08
1996
-01
1996
-06
1996
-11
1997
-05
1997
-10
1998
-03
1998
-08
1999
-02
1999
-07
1999
-12
2000
-05
2000
-10
2001
-03
2001
-10
2002
-03
2002
-08
2003
-01
2003
-06
2003
-11
2004
-04
2004
-09
2005
-02
2005
-11
2006
-04
2006
-09
0.00
0.02
0.04
0.06
0.08
0.10
ppm
1992
-09
1993
-02
1993
-07
1993
-12
1994
-05
1994
-10
1995
-03
1995
-08
1996
-01
1996
-06
1996
-11
1997
-05
1997
-10
1998
-03
1998
-08
1999
-02
1999
-07
1999
-12
2000
-05
2000
-10
2001
-03
2001
-10
2002
-03
2002
-08
2003
-01
2003
-06
2003
-11
2004
-04
2004
-09
2005
-02
2005
-11
2006
-04
2006
-09
0.0
5.0
10.0
15.0
20.0
25.0
30.0
ppb
1992
-09
1993
-02
1993
-07
1993
-12
1994
-05
1994
-10
1995
-03
1995
-08
1996
-01
1996
-06
1996
-11
1997
-05
1997
-10
1998
-03
1998
-08
1999
-02
1999
-07
1999
-12
2000
-05
2000
-10
2001
-03
2001
-10
2002
-03
2002
-08
2003
-01
2003
-06
2003
-11
2004
-04
2004
-09
2005
-02
2005
-11
2006
-04
2006
-09
Salinity
Dissolved Inorganic Nitrogen
Total Phosphorus
Chlorophyll a
Figure 10. Box-and-whisker plots of water quality in WWB-TTI by survey.
Page 14
14
Mangrove Rivers Zone
0.05.0
10.015.020.025.030.035.040.0
1992
-09
1993
-02
1993
-07
1993
-12
1994
-05
1994
-10
1995
-03
1995
-08
1996
-01
1996
-06
1996
-11
1997
-04
1997
-09
1998
-02
1998
-07
1999
-01
1999
-06
1999
-11
2000
-04
2000
-09
2001
-02
2001
-07
2001
-12
2002
-05
2002
-10
2003
-03
2003
-08
2004
-01
2004
-06
2004
-11
2005
-07
2005
-12
2006
-05
2006
-10
0.00
0.10
0.20
0.30
0.40
0.50
ppm
1992
-09
1993
-02
1993
-07
1993
-12
1994
-05
1994
-10
1995
-03
1995
-08
1996
-01
1996
-06
1996
-11
1997
-04
1997
-09
1998
-02
1998
-07
1999
-01
1999
-06
1999
-11
2000
-04
2000
-09
2001
-02
2001
-07
2001
-12
2002
-05
2002
-10
2003
-03
2003
-08
2004
-01
2004
-06
2004
-11
2005
-07
2005
-12
2006
-05
2006
-10
0.000.020.040.060.080.100.120.14
ppm
1992
-09
1993
-02
1993
-07
1993
-12
1994
-05
1994
-10
1995
-03
1995
-08
1996
-01
1996
-06
1996
-11
1997
-04
1997
-09
1998
-02
1998
-07
1999
-01
1999
-06
1999
-11
2000
-04
2000
-09
2001
-02
2001
-07
2001
-12
2002
-05
2002
-10
2003
-03
2003
-08
2004
-01
2004
-06
2004
-11
2005
-07
2005
-12
2006
-05
2006
-10
0.0
5.0
10.0
15.0
20.0
ppb
1992
-09
1993
-02
1993
-07
1993
-12
1994
-05
1994
-10
1995
-03
1995
-08
1996
-01
1996
-06
1996
-11
1997
-04
1997
-09
1998
-02
1998
-07
1999
-01
1999
-06
1999
-11
2000
-04
2000
-09
2001
-02
2001
-07
2001
-12
2002
-05
2002
-10
2003
-03
2003
-08
2004
-01
2004
-06
2004
-11
2005
-07
2005
-12
2006
-05
2006
-10
Salinity
Dissolved Inorganic Nitrogen
Total Phosphorus
Chlorophyll a
Figure 11. Box-and-whisker plots of water quality in WWB-TTI by survey.
Page 15
15
Gulf Islands Zone
0.0
10.0
20.0
30.0
40.0
1992
-09
1993
-02
1993
-07
1993
-12
1994
-05
1994
-10
1995
-03
1995
-08
1996
-01
1996
-06
1996
-11
1997
-04
1997
-09
1998
-02
1998
-07
1999
-01
1999
-06
1999
-11
2000
-04
2000
-09
2001
-02
2001
-07
2001
-12
2002
-05
2002
-10
2003
-03
2003
-08
2004
-01
2004
-06
2004
-11
2005
-07
2005
-12
2006
-05
2006
-10
0.00
0.05
0.10
0.15
0.20
0.25
ppm
1992
-09
1993
-02
1993
-07
1993
-12
1994
-05
1994
-10
1995
-03
1995
-08
1996
-01
1996
-06
1996
-11
1997
-04
1997
-09
1998
-02
1998
-07
1999
-01
1999
-06
1999
-11
2000
-04
2000
-09
2001
-02
2001
-07
2001
-12
2002
-05
2002
-10
2003
-03
2003
-08
2004
-01
2004
-06
2004
-11
2005
-07
2005
-12
2006
-05
2006
-10
0.00
0.05
0.10
0.15
0.20
ppm
1992
-09
1993
-02
1993
-07
1993
-12
1994
-05
1994
-10
1995
-03
1995
-08
1996
-01
1996
-06
1996
-11
1997
-04
1997
-09
1998
-02
1998
-07
1999
-01
1999
-06
1999
-11
2000
-04
2000
-09
2001
-02
2001
-07
2001
-12
2002
-05
2002
-10
2003
-03
2003
-08
2004
-01
2004
-06
2004
-11
2005
-07
2005
-12
2006
-05
2006
-10
0.0
5.0
10.0
15.0
20.0
ppb
1992
-09
1993
-02
1993
-07
1993
-12
1994
-05
1994
-10
1995
-03
1995
-08
1996
-01
1996
-06
1996
-11
1997
-04
1997
-09
1998
-02
1998
-07
1999
-01
1999
-06
1999
-11
2000
-04
2000
-09
2001
-02
2001
-07
2001
-12
2002
-05
2002
-10
2003
-03
2003
-08
2004
-01
2004
-06
2004
-11
2005
-07
2005
-12
2006
-05
2006
-10
Salinity
Dissolved Inorganic Nitrogen
Total Phosphorus
Chlorophyll a
Figure 12. Box-and-whisker plots of water quality in WWB-TTI by survey.
Page 16
16
Inner Waterway Zone
0.0
10.0
20.0
30.0
40.0
1994
-09
1994
-12
1995
-03
1995
-06
1995
-09
1996
-01
1996
-05
1996
-09
1996
-12
1997
-03
1997
-06
1997
-09
1997
-12
1998
-03
1998
-06
1998
-10
1999
-01
1999
-04
1999
-07
1999
-10
2000
-01
2000
-04
2000
-07
2000
-10
2001
-01
2001
-04
2001
-07
2001
-10
2002
-01
2002
-04
2002
-07
2002
-10
2003
-01
2003
-04
2003
-07
2003
-10
2004
-01
2004
-04
2004
-07
2004
-10
2005
-01
2005
-07
2005
-10
2006
-01
2006
-04
2006
-07
2006
-10
0.000.050.100.150.200.250.300.35
ppm
1994
-09
1994
-12
1995
-03
1995
-06
1995
-09
1996
-01
1996
-05
1996
-09
1996
-12
1997
-03
1997
-06
1997
-09
1997
-12
1998
-03
1998
-06
1998
-10
1999
-01
1999
-04
1999
-07
1999
-10
2000
-01
2000
-04
2000
-07
2000
-10
2001
-01
2001
-04
2001
-07
2001
-10
2002
-01
2002
-04
2002
-07
2002
-10
2003
-01
2003
-04
2003
-07
2003
-10
2004
-01
2004
-04
2004
-07
2004
-10
2005
-01
2005
-07
2005
-10
2006
-01
2006
-04
2006
-07
2006
-10
0.00
0.05
0.10
0.15
0.20
ppm
1994
-09
1994
-12
1995
-03
1995
-06
1995
-09
1996
-01
1996
-05
1996
-09
1996
-12
1997
-03
1997
-06
1997
-09
1997
-12
1998
-03
1998
-06
1998
-10
1999
-01
1999
-04
1999
-07
1999
-10
2000
-01
2000
-04
2000
-07
2000
-10
2001
-01
2001
-04
2001
-07
2001
-10
2002
-01
2002
-04
2002
-07
2002
-10
2003
-01
2003
-04
2003
-07
2003
-10
2004
-01
2004
-04
2004
-07
2004
-10
2005
-01
2005
-07
2005
-10
2006
-01
2006
-04
2006
-07
2006
-10
0.0
5.0
10.0
15.0
20.0
25.0
ppb
1994
-09
1994
-12
1995
-03
1995
-06
1995
-09
1996
-01
1996
-05
1996
-09
1996
-12
1997
-03
1997
-06
1997
-09
1997
-12
1998
-03
1998
-06
1998
-10
1999
-01
1999
-04
1999
-07
1999
-10
2000
-01
2000
-04
2000
-07
2000
-10
2001
-01
2001
-04
2001
-07
2001
-10
2002
-01
2002
-04
2002
-07
2002
-10
2003
-01
2003
-04
2003
-07
2003
-10
2004
-01
2004
-04
2004
-07
2004
-10
2005
-01
2005
-07
2005
-10
2006
-01
2006
-04
2006
-07
2006
-10
Salinity
Dissolved Inorganic Nitrogen
Total Phosphorus
Chlorophyll a
Figure 13. Box-and-whisker plots of water quality in WWB-TTI by survey.
Page 17
17
Blackwater River Zone
0.05.0
10.015.020.025.030.035.040.0
1994
-09
1994
-12
1995
-03
1995
-06
1995
-09
1996
-02
1996
-07
1996
-10
1997
-01
1997
-04
1997
-07
1997
-10
1998
-01
1998
-04
1998
-07
1998
-11
1999
-02
1999
-05
1999
-08
1999
-11
2000
-02
2000
-05
2000
-08
2000
-11
2001
-02
2001
-05
2001
-08
2001
-11
2002
-02
2002
-05
2002
-08
2002
-11
2003
-02
2003
-05
2003
-08
2003
-11
2004
-02
2004
-05
2004
-08
2004
-11
2005
-02
2005
-08
2005
-11
2006
-02
2006
-05
2006
-08
2006
-11
0.00
0.05
0.10
0.15
0.20
0.25
0.30
ppm
1994
-09
1994
-12
1995
-03
1995
-06
1995
-09
1996
-02
1996
-07
1996
-10
1997
-01
1997
-04
1997
-07
1997
-10
1998
-01
1998
-04
1998
-07
1998
-11
1999
-02
1999
-05
1999
-08
1999
-11
2000
-02
2000
-05
2000
-08
2000
-11
2001
-02
2001
-05
2001
-08
2001
-11
2002
-02
2002
-05
2002
-08
2002
-11
2003
-02
2003
-05
2003
-08
2003
-11
2004
-02
2004
-05
2004
-08
2004
-11
2005
-02
2005
-08
2005
-11
2006
-02
2006
-05
2006
-08
2006
-11
0.00
0.05
0.10
0.15
0.20
0.25
ppm
1994
-09
1994
-12
1995
-03
1995
-06
1995
-09
1996
-02
1996
-07
1996
-10
1997
-01
1997
-04
1997
-07
1997
-10
1998
-01
1998
-04
1998
-07
1998
-11
1999
-02
1999
-05
1999
-08
1999
-11
2000
-02
2000
-05
2000
-08
2000
-11
2001
-02
2001
-05
2001
-08
2001
-11
2002
-02
2002
-05
2002
-08
2002
-11
2003
-02
2003
-05
2003
-08
2003
-11
2004
-02
2004
-05
2004
-08
2004
-11
2005
-02
2005
-08
2005
-11
2006
-02
2006
-05
2006
-08
2006
-11
0.0
5.0
10.0
15.0
20.0
ppb
1994
-09
1994
-12
1995
-03
1995
-06
1995
-09
1996
-02
1996
-07
1996
-10
1997
-01
1997
-04
1997
-07
1997
-10
1998
-01
1998
-04
1998
-07
1998
-11
1999
-02
1999
-05
1999
-08
1999
-11
2000
-02
2000
-05
2000
-08
2000
-11
2001
-02
2001
-05
2001
-08
2001
-11
2002
-02
2002
-05
2002
-08
2002
-11
2003
-02
2003
-05
2003
-08
2003
-11
2004
-02
2004
-05
2004
-08
2004
-11
2005
-02
2005
-08
2005
-11
2006
-02
2006
-05
2006
-08
2006
-11
Salinity
Dissolved Inorganic Nitrogen
Total Phosphorus
Chlorophyll a
Figure 14. Box-and-whisker plots of water quality in WWB-TTI by survey.
Page 18
18
Alongshore Zone
0.0
10.0
20.0
30.0
40.0
1993
-09
1993
-12
1994
-03
1994
-06
1994
-09
1994
-12
1995
-03
1995
-06
1995
-09
1995
-12
1996
-03
1996
-06
1996
-09
1996
-12
1997
-03
1997
-06
1997
-09
1997
-12
1998
-03
1998
-06
1998
-10
1999
-01
1999
-04
1999
-07
1999
-10
2000
-01
2000
-04
2000
-07
2000
-10
2001
-01
2001
-05
2001
-08
2001
-11
2002
-02
2002
-05
2002
-08
2002
-11
2003
-02
2003
-05
2003
-08
2003
-11
2004
-02
2004
-05
2004
-08
2004
-11
2005
-02
2005
-08
2005
-11
2006
-02
2006
-05
2006
-09
2006
-12
0.000.200.400.600.801.001.201.40
ppm
1993
-09
1993
-12
1994
-03
1994
-06
1994
-09
1994
-12
1995
-03
1995
-06
1995
-09
1995
-12
1996
-03
1996
-06
1996
-09
1996
-12
1997
-03
1997
-06
1997
-09
1997
-12
1998
-03
1998
-06
1998
-10
1999
-01
1999
-04
1999
-07
1999
-10
2000
-01
2000
-04
2000
-07
2000
-10
2001
-01
2001
-05
2001
-08
2001
-11
2002
-02
2002
-05
2002
-08
2002
-11
2003
-02
2003
-05
2003
-08
2003
-11
2004
-02
2004
-05
2004
-08
2004
-11
2005
-02
2005
-08
2005
-11
2006
-02
2006
-05
2006
-09
2006
-12
0.00
0.01
0.02
0.03
0.04
0.05
0.06
ppm
1993
-09
1993
-12
1994
-03
1994
-06
1994
-09
1994
-12
1995
-03
1995
-06
1995
-09
1995
-12
1996
-03
1996
-06
1996
-09
1996
-12
1997
-03
1997
-06
1997
-09
1997
-12
1998
-03
1998
-06
1998
-10
1999
-01
1999
-04
1999
-07
1999
-10
2000
-01
2000
-04
2000
-07
2000
-10
2001
-01
2001
-05
2001
-08
2001
-11
2002
-02
2002
-05
2002
-08
2002
-11
2003
-02
2003
-05
2003
-08
2003
-11
2004
-02
2004
-05
2004
-08
2004
-11
2005
-02
2005
-08
2005
-11
2006
-02
2006
-05
2006
-09
2006
-12
0.0
0.5
1.0
1.5
2.0
2.5
3.0
ppb
1993
-09
1993
-12
1994
-03
1994
-06
1994
-09
1994
-12
1995
-03
1995
-06
1995
-09
1995
-12
1996
-03
1996
-06
1996
-09
1996
-12
1997
-03
1997
-06
1997
-09
1997
-12
1998
-03
1998
-06
1998
-10
1999
-01
1999
-04
1999
-07
1999
-10
2000
-01
2000
-04
2000
-07
2000
-10
2001
-01
2001
-05
2001
-08
2001
-11
2002
-02
2002
-05
2002
-08
2002
-11
2003
-02
2003
-05
2003
-08
2003
-11
2004
-02
2004
-05
2004
-08
2004
-11
2005
-02
2005
-08
2005
-11
2006
-02
2006
-05
2006
-09
2006
-12
Salinity
Dissolved Inorganic Nitrogen
Total Phosphorus
Chlorophyll a
Figure 15. Box-and-whisker plots of water quality in Biscayne Bay by survey.
Page 19
19
Inshore Zone
0.0
10.0
20.0
30.0
40.0
1993
-09
1993
-12
1994
-03
1994
-06
1994
-09
1994
-12
1995
-03
1995
-06
1995
-09
1995
-12
1996
-03
1996
-06
1996
-09
1996
-12
1997
-03
1997
-06
1997
-09
1997
-12
1998
-03
1998
-06
1998
-10
1999
-01
1999
-04
1999
-07
1999
-10
2000
-01
2000
-04
2000
-07
2000
-10
2001
-01
2001
-05
2001
-08
2001
-11
2002
-02
2002
-05
2002
-08
2002
-11
2003
-02
2003
-05
2003
-08
2003
-11
2004
-02
2004
-05
2004
-08
2004
-11
2005
-02
2005
-08
2005
-11
2006
-02
2006
-05
2006
-09
2006
-12
0.00
0.20
0.40
0.60
0.80
1.00
ppm
1993
-09
1993
-12
1994
-03
1994
-06
1994
-09
1994
-12
1995
-03
1995
-06
1995
-09
1995
-12
1996
-03
1996
-06
1996
-09
1996
-12
1997
-03
1997
-06
1997
-09
1997
-12
1998
-03
1998
-06
1998
-10
1999
-01
1999
-04
1999
-07
1999
-10
2000
-01
2000
-04
2000
-07
2000
-10
2001
-01
2001
-05
2001
-08
2001
-11
2002
-02
2002
-05
2002
-08
2002
-11
2003
-02
2003
-05
2003
-08
2003
-11
2004
-02
2004
-05
2004
-08
2004
-11
2005
-02
2005
-08
2005
-11
2006
-02
2006
-05
2006
-09
2006
-12
0.00
0.01
0.02
0.03
0.04
0.05
0.06
ppm
1993
-09
1993
-12
1994
-03
1994
-06
1994
-09
1994
-12
1995
-03
1995
-06
1995
-09
1995
-12
1996
-03
1996
-06
1996
-09
1996
-12
1997
-03
1997
-06
1997
-09
1997
-12
1998
-03
1998
-06
1998
-10
1999
-01
1999
-04
1999
-07
1999
-10
2000
-01
2000
-04
2000
-07
2000
-10
2001
-01
2001
-05
2001
-08
2001
-11
2002
-02
2002
-05
2002
-08
2002
-11
2003
-02
2003
-05
2003
-08
2003
-11
2004
-02
2004
-05
2004
-08
2004
-11
2005
-02
2005
-08
2005
-11
2006
-02
2006
-05
2006
-09
2006
-12
0.01.02.03.04.05.06.07.0
ppb
1993
-09
1993
-12
1994
-03
1994
-06
1994
-09
1994
-12
1995
-03
1995
-06
1995
-09
1995
-12
1996
-03
1996
-06
1996
-09
1996
-12
1997
-03
1997
-06
1997
-09
1997
-12
1998
-03
1998
-06
1998
-10
1999
-01
1999
-04
1999
-07
1999
-10
2000
-01
2000
-04
2000
-07
2000
-10
2001
-01
2001
-05
2001
-08
2001
-11
2002
-02
2002
-05
2002
-08
2002
-11
2003
-02
2003
-05
2003
-08
2003
-11
2004
-02
2004
-05
2004
-08
2004
-11
2005
-02
2005
-08
2005
-11
2006
-02
2006
-05
2006
-09
2006
-12
Salinity
Dissolved Inorganic Nitrogen
Total Phosphorus
Chlorophyll a
Figure 16. Box-and-whisker plots of water quality in Biscayne Bay by survey.
Page 20
20
Main Bay Zone
0.05.0
10.015.020.025.030.035.040.0
1993
-09
1993
-12
1994
-03
1994
-06
1994
-09
1994
-12
1995
-03
1995
-06
1995
-09
1995
-12
1996
-03
1996
-06
1996
-09
1996
-12
1997
-03
1997
-06
1997
-09
1997
-12
1998
-03
1998
-06
1998
-10
1999
-01
1999
-04
1999
-07
1999
-10
2000
-01
2000
-04
2000
-07
2000
-10
2001
-01
2001
-05
2001
-08
2001
-11
2002
-02
2002
-05
2002
-08
2002
-11
2003
-02
2003
-05
2003
-08
2003
-11
2004
-02
2004
-05
2004
-08
2004
-11
2005
-02
2005
-08
2005
-11
2006
-02
2006
-05
2006
-09
2006
-12
0.00
0.10
0.20
0.30
0.40
0.50
ppm
1993
-09
1993
-12
1994
-03
1994
-06
1994
-09
1994
-12
1995
-03
1995
-06
1995
-09
1995
-12
1996
-03
1996
-06
1996
-09
1996
-12
1997
-03
1997
-06
1997
-09
1997
-12
1998
-03
1998
-06
1998
-10
1999
-01
1999
-04
1999
-07
1999
-10
2000
-01
2000
-04
2000
-07
2000
-10
2001
-01
2001
-05
2001
-08
2001
-11
2002
-02
2002
-05
2002
-08
2002
-11
2003
-02
2003
-05
2003
-08
2003
-11
2004
-02
2004
-05
2004
-08
2004
-11
2005
-02
2005
-08
2005
-11
2006
-02
2006
-05
2006
-09
2006
-12
0.00
0.01
0.02
0.03
0.04
0.05
ppm
1993
-09
1993
-12
1994
-03
1994
-06
1994
-09
1994
-12
1995
-03
1995
-06
1995
-09
1995
-12
1996
-03
1996
-06
1996
-09
1996
-12
1997
-03
1997
-06
1997
-09
1997
-12
1998
-03
1998
-06
1998
-10
1999
-01
1999
-04
1999
-07
1999
-10
2000
-01
2000
-04
2000
-07
2000
-10
2001
-01
2001
-05
2001
-08
2001
-11
2002
-02
2002
-05
2002
-08
2002
-11
2003
-02
2003
-05
2003
-08
2003
-11
2004
-02
2004
-05
2004
-08
2004
-11
2005
-02
2005
-08
2005
-11
2006
-02
2006
-05
2006
-09
2006
-12
0.0
1.0
2.0
3.0
4.0
5.0
ppb
1993
-09
1993
-12
1994
-03
1994
-06
1994
-09
1994
-12
1995
-03
1995
-06
1995
-09
1995
-12
1996
-03
1996
-06
1996
-09
1996
-12
1997
-03
1997
-06
1997
-09
1997
-12
1998
-03
1998
-06
1998
-10
1999
-01
1999
-04
1999
-07
1999
-10
2000
-01
2000
-04
2000
-07
2000
-10
2001
-01
2001
-05
2001
-08
2001
-11
2002
-02
2002
-05
2002
-08
2002
-11
2003
-02
2003
-05
2003
-08
2003
-11
2004
-02
2004
-05
2004
-08
2004
-11
2005
-02
2005
-08
2005
-11
2006
-02
2006
-05
2006
-09
2006
-12
Salinity
Dissolved Inorganic Nitrogen
Total Phosphorus
Chlorophyll a
Figure 17. Box-and-whisker plots of water quality in Biscayne Bay by survey.
Page 21
21
South Card Sound Zone
0.0
10.0
20.0
30.0
40.0
1993
-10
1994
-01
1994
-04
1994
-07
1994
-10
1995
-01
1995
-04
1995
-07
1995
-10
1996
-01
1996
-04
1996
-07
1996
-10
1997
-01
1997
-04
1997
-07
1997
-10
1998
-01
1998
-04
1998
-07
1998
-11
1999
-02
1999
-05
1999
-08
1999
-11
2000
-02
2000
-05
2000
-08
2000
-11
2001
-03
2001
-06
2001
-09
2001
-12
2002
-03
2002
-06
2002
-09
2002
-12
2003
-03
2003
-06
2003
-09
2003
-12
2004
-03
2004
-06
2004
-09
2004
-12
2005
-03
2005
-09
2005
-12
2006
-03
2006
-06
2006
-10
0.00
0.04
0.08
0.12
0.16
0.20
0.24
ppm
1993
-10
1994
-01
1994
-04
1994
-07
1994
-10
1995
-01
1995
-04
1995
-07
1995
-10
1996
-01
1996
-04
1996
-07
1996
-10
1997
-01
1997
-04
1997
-07
1997
-10
1998
-01
1998
-04
1998
-07
1998
-11
1999
-02
1999
-05
1999
-08
1999
-11
2000
-02
2000
-05
2000
-08
2000
-11
2001
-03
2001
-06
2001
-09
2001
-12
2002
-03
2002
-06
2002
-09
2002
-12
2003
-03
2003
-06
2003
-09
2003
-12
2004
-03
2004
-06
2004
-09
2004
-12
2005
-03
2005
-09
2005
-12
2006
-03
2006
-06
2006
-10
0.00
0.01
0.02
0.03
0.04
ppm
1993
-10
1994
-01
1994
-04
1994
-07
1994
-10
1995
-01
1995
-04
1995
-07
1995
-10
1996
-01
1996
-04
1996
-07
1996
-10
1997
-01
1997
-04
1997
-07
1997
-10
1998
-01
1998
-04
1998
-07
1998
-11
1999
-02
1999
-05
1999
-08
1999
-11
2000
-02
2000
-05
2000
-08
2000
-11
2001
-03
2001
-06
2001
-09
2001
-12
2002
-03
2002
-06
2002
-09
2002
-12
2003
-03
2003
-06
2003
-09
2003
-12
2004
-03
2004
-06
2004
-09
2004
-12
2005
-03
2005
-09
2005
-12
2006
-03
2006
-06
2006
-10
0.01.02.03.04.05.06.07.08.0
ppb
1993
-10
1994
-01
1994
-04
1994
-07
1994
-10
1995
-01
1995
-04
1995
-07
1995
-10
1996
-01
1996
-04
1996
-07
1996
-10
1997
-01
1997
-04
1997
-07
1997
-10
1998
-01
1998
-04
1998
-07
1998
-11
1999
-02
1999
-05
1999
-08
1999
-11
2000
-02
2000
-05
2000
-08
2000
-11
2001
-03
2001
-06
2001
-09
2001
-12
2002
-03
2002
-06
2002
-09
2002
-12
2003
-03
2003
-06
2003
-09
2003
-12
2004
-03
2004
-06
2004
-09
2004
-12
2005
-03
2005
-09
2005
-12
2006
-03
2006
-06
2006
-10
Salinity
Dissolved Inorganic Nitrogen
Total Phosphorus
Chlorophyll a
Figure 18. Box-and-whisker plots of water quality in Biscayne Bay by survey.
Page 22
22
North Bay Zone
0.05.0
10.015.020.025.030.035.040.0
1996
-06
1996
-09
1996
-12
1997
-03
1997
-06
1997
-09
1997
-12
1998
-03
1998
-06
1998
-10
1999
-01
1999
-04
1999
-07
1999
-10
2000
-01
2000
-04
2000
-07
2000
-10
2001
-01
2001
-05
2001
-08
2001
-11
2002
-02
2002
-05
2002
-08
2002
-11
2003
-02
2003
-05
2003
-08
2003
-11
2004
-02
2004
-05
2004
-08
2004
-11
2005
-02
2005
-08
2005
-11
2006
-02
2006
-05
2006
-09
2006
-12
0.000.050.100.150.200.250.300.350.40
ppm
1996
-06
1996
-09
1996
-12
1997
-03
1997
-06
1997
-09
1997
-12
1998
-03
1998
-06
1998
-10
1999
-01
1999
-04
1999
-07
1999
-10
2000
-01
2000
-04
2000
-07
2000
-10
2001
-01
2001
-05
2001
-08
2001
-11
2002
-02
2002
-05
2002
-08
2002
-11
2003
-02
2003
-05
2003
-08
2003
-11
2004
-02
2004
-05
2004
-08
2004
-11
2005
-02
2005
-08
2005
-11
2006
-02
2006
-05
2006
-09
2006
-12
0.00
0.01
0.02
0.03
0.04
0.05
0.06
ppm
1996
-06
1996
-09
1996
-12
1997
-03
1997
-06
1997
-09
1997
-12
1998
-03
1998
-06
1998
-10
1999
-01
1999
-04
1999
-07
1999
-10
2000
-01
2000
-04
2000
-07
2000
-10
2001
-01
2001
-05
2001
-08
2001
-11
2002
-02
2002
-05
2002
-08
2002
-11
2003
-02
2003
-05
2003
-08
2003
-11
2004
-02
2004
-05
2004
-08
2004
-11
2005
-02
2005
-08
2005
-11
2006
-02
2006
-05
2006
-09
2006
-12
0.0
2.0
4.0
6.0
8.0
10.0
ppb
1996
-06
1996
-09
1996
-12
1997
-03
1997
-06
1997
-09
1997
-12
1998
-03
1998
-06
1998
-10
1999
-01
1999
-04
1999
-07
1999
-10
2000
-01
2000
-04
2000
-07
2000
-10
2001
-01
2001
-05
2001
-08
2001
-11
2002
-02
2002
-05
2002
-08
2002
-11
2003
-02
2003
-05
2003
-08
2003
-11
2004
-02
2004
-05
2004
-08
2004
-11
2005
-02
2005
-08
2005
-11
2006
-02
2006
-05
2006
-09
2006
-12
Salinity
Dissolved Inorganic Nitrogen
Total Phosphorus
Chlorophyll a
Figure 19. Box-and-whisker plots of water quality in Biscayne Bay by survey.
Page 23
23
Shelf Zone
0.05.0
10.015.020.025.030.035.040.0
1995
-05
1995
-08
1995
-12
1996
-03
1996
-07
1996
-10
1997
-02
1997
-05
1997
-07
1997
-10
1998
-01
1998
-04
1998
-07
1998
-10
1999
-01
1999
-05
1999
-07
1999
-11
2000
-01
2000
-04
2000
-07
2000
-10
2001
-01
2001
-05
2001
-07
2001
-11
2002
-01
2002
-04
2002
-08
2002
-10
2003
-01
2003
-04
2003
-07
2003
-08
2003
-10
2004
-01
2004
-04
2004
-07
2004
-10
2005
-01
2005
-07
2005
-10
2006
-01
2006
-05
2006
-06
2006
-07
2006
-10
0.00
0.02
0.04
0.06
0.08
0.10
ppm
1995
-05
1995
-08
1995
-12
1996
-03
1996
-07
1996
-10
1997
-02
1997
-05
1997
-07
1997
-10
1998
-01
1998
-04
1998
-07
1998
-10
1999
-01
1999
-05
1999
-07
1999
-11
2000
-01
2000
-04
2000
-07
2000
-10
2001
-01
2001
-05
2001
-07
2001
-11
2002
-01
2002
-04
2002
-08
2002
-10
2003
-01
2003
-04
2003
-07
2003
-08
2003
-10
2004
-01
2004
-04
2004
-07
2004
-10
2005
-01
2005
-07
2005
-10
2006
-01
2006
-05
2006
-06
2006
-07
2006
-10
0.00
0.01
0.02
0.03
0.04
0.05
0.06
ppm
1995
-05
1995
-08
1995
-12
1996
-03
1996
-07
1996
-10
1997
-02
1997
-05
1997
-07
1997
-10
1998
-01
1998
-04
1998
-07
1998
-10
1999
-01
1999
-05
1999
-07
1999
-11
2000
-01
2000
-04
2000
-07
2000
-10
2001
-01
2001
-05
2001
-07
2001
-11
2002
-01
2002
-04
2002
-08
2002
-10
2003
-01
2003
-04
2003
-07
2003
-08
2003
-10
2004
-01
2004
-04
2004
-07
2004
-10
2005
-01
2005
-07
2005
-10
2006
-01
2006
-05
2006
-06
2006
-07
2006
-10
0.0
2.0
4.0
6.0
8.0
10.0
ppb
1995
-05
1995
-08
1995
-12
1996
-03
1996
-07
1996
-10
1997
-02
1997
-05
1997
-07
1997
-10
1998
-01
1998
-04
1998
-07
1998
-10
1999
-01
1999
-05
1999
-07
1999
-11
2000
-01
2000
-04
2000
-07
2000
-10
2001
-01
2001
-05
2001
-07
2001
-11
2002
-01
2002
-04
2002
-08
2002
-10
2003
-01
2003
-04
2003
-07
2003
-08
2003
-10
2004
-01
2004
-04
2004
-07
2004
-10
2005
-01
2005
-07
2005
-10
2006
-01
2006
-05
2006
-06
2006
-07
2006
-10
Salinity
Dissolved Inorganic Nitrogen
Total Phosphorus
Chlorophyll a
Figure 20. Box-and-whisker plots of water quality in SW Florida Shelf by survey.
Page 24
24
Shark Zone
0.0
10.0
20.0
30.0
40.0
1995
-05
1995
-08
1995
-12
1996
-03
1996
-07
1996
-10
1997
-02
1997
-05
1997
-07
1997
-10
1998
-01
1998
-04
1998
-07
1998
-10
1999
-01
1999
-05
1999
-07
1999
-11
2000
-01
2000
-04
2000
-07
2000
-10
2001
-01
2001
-05
2001
-07
2001
-11
2002
-01
2002
-04
2002
-08
2002
-10
2003
-01
2003
-04
2003
-08
2003
-10
2004
-01
2004
-04
2004
-07
2004
-10
2005
-01
2005
-07
2005
-10
2006
-01
2006
-06
2006
-07
2006
-10
0.00
0.02
0.04
0.06
0.08
0.10
0.12
ppm
1995
-05
1995
-08
1995
-12
1996
-03
1996
-07
1996
-10
1997
-02
1997
-05
1997
-07
1997
-10
1998
-01
1998
-04
1998
-07
1998
-10
1999
-01
1999
-05
1999
-07
1999
-11
2000
-01
2000
-04
2000
-07
2000
-10
2001
-01
2001
-05
2001
-07
2001
-11
2002
-01
2002
-04
2002
-08
2002
-10
2003
-01
2003
-04
2003
-08
2003
-10
2004
-01
2004
-04
2004
-07
2004
-10
2005
-01
2005
-07
2005
-10
2006
-01
2006
-06
2006
-07
2006
-10
0.00
0.02
0.04
0.06
0.08
0.10
ppm
1995
-05
1995
-08
1995
-12
1996
-03
1996
-07
1996
-10
1997
-02
1997
-05
1997
-07
1997
-10
1998
-01
1998
-04
1998
-07
1998
-10
1999
-01
1999
-05
1999
-07
1999
-11
2000
-01
2000
-04
2000
-07
2000
-10
2001
-01
2001
-05
2001
-07
2001
-11
2002
-01
2002
-04
2002
-08
2002
-10
2003
-01
2003
-04
2003
-08
2003
-10
2004
-01
2004
-04
2004
-07
2004
-10
2005
-01
2005
-07
2005
-10
2006
-01
2006
-06
2006
-07
2006
-10
0.0
2.0
4.0
6.0
8.0
10.0
ppb
1995
-05
1995
-08
1995
-12
1996
-03
1996
-07
1996
-10
1997
-02
1997
-05
1997
-07
1997
-10
1998
-01
1998
-04
1998
-07
1998
-10
1999
-01
1999
-05
1999
-07
1999
-11
2000
-01
2000
-04
2000
-07
2000
-10
2001
-01
2001
-05
2001
-07
2001
-11
2002
-01
2002
-04
2002
-08
2002
-10
2003
-01
2003
-04
2003
-08
2003
-10
2004
-01
2004
-04
2004
-07
2004
-10
2005
-01
2005
-07
2005
-10
2006
-01
2006
-06
2006
-07
2006
-10
Salinity
Dissolved Inorganic Nitrogen
Total Phosphorus
Chlorophyll a
Figure 21. Box-and-whisker plots of water quality in SW Florida Shelf by survey.
Page 25
25
Shoal Zone
0.05.0
10.015.020.025.030.035.040.0
1995
-05
1995
-08
1995
-12
1996
-03
1996
-07
1996
-10
1997
-02
1997
-05
1997
-07
1997
-10
1998
-01
1998
-04
1998
-07
1998
-10
1999
-01
1999
-05
1999
-07
1999
-11
2000
-01
2000
-04
2000
-07
2000
-10
2001
-01
2001
-05
2001
-07
2001
-11
2002
-01
2002
-04
2002
-08
2002
-10
2003
-01
2003
-04
2003
-07
2003
-08
2003
-10
2004
-01
2004
-04
2004
-05
2004
-07
2004
-10
2005
-01
2005
-07
2005
-10
2006
-01
2006
-05
2006
-06
2006
-07
2006
-10
0.000.010.020.030.040.050.060.07
ppm
1995
-05
1995
-08
1995
-12
1996
-03
1996
-07
1996
-10
1997
-02
1997
-05
1997
-07
1997
-10
1998
-01
1998
-04
1998
-07
1998
-10
1999
-01
1999
-05
1999
-07
1999
-11
2000
-01
2000
-04
2000
-07
2000
-10
2001
-01
2001
-05
2001
-07
2001
-11
2002
-01
2002
-04
2002
-08
2002
-10
2003
-01
2003
-04
2003
-07
2003
-08
2003
-10
2004
-01
2004
-04
2004
-05
2004
-07
2004
-10
2005
-01
2005
-07
2005
-10
2006
-01
2006
-05
2006
-06
2006
-07
2006
-10
0.00
0.01
0.02
0.03
0.04
ppm
1995
-05
1995
-08
1995
-12
1996
-03
1996
-07
1996
-10
1997
-02
1997
-05
1997
-07
1997
-10
1998
-01
1998
-04
1998
-07
1998
-10
1999
-01
1999
-05
1999
-07
1999
-11
2000
-01
2000
-04
2000
-07
2000
-10
2001
-01
2001
-05
2001
-07
2001
-11
2002
-01
2002
-04
2002
-08
2002
-10
2003
-01
2003
-04
2003
-07
2003
-08
2003
-10
2004
-01
2004
-04
2004
-05
2004
-07
2004
-10
2005
-01
2005
-07
2005
-10
2006
-01
2006
-05
2006
-06
2006
-07
2006
-10
0.01.02.03.04.05.06.07.0
ppb
1995
-05
1995
-08
1995
-12
1996
-03
1996
-07
1996
-10
1997
-02
1997
-05
1997
-07
1997
-10
1998
-01
1998
-04
1998
-07
1998
-10
1999
-01
1999
-05
1999
-07
1999
-11
2000
-01
2000
-04
2000
-07
2000
-10
2001
-01
2001
-05
2001
-07
2001
-11
2002
-01
2002
-04
2002
-08
2002
-10
2003
-01
2003
-04
2003
-07
2003
-08
2003
-10
2004
-01
2004
-04
2004
-05
2004
-07
2004
-10
2005
-01
2005
-07
2005
-10
2006
-01
2006
-05
2006
-06
2006
-07
2006
-10
Salinity
Dissolved Inorganic Nitrogen
Total Phosphorus
Chlorophyll a
Figure 22. Box-and-whisker plots of water quality in SW Florida Shelf by survey.
Page 26
26
Marco Zone
0.0
10.0
20.0
30.0
40.0
1999
-01
1999
-03
1999
-05
1999
-07
1999
-09
1999
-11
2000
-01
2000
-03
2000
-05
2000
-07
2000
-09
2000
-11
2001
-01
2001
-03
2001
-05
2001
-07
2001
-09
2001
-11
2002
-01
2002
-03
2002
-05
2002
-07
2002
-09
2002
-11
2003
-01
2003
-03
2003
-05
2003
-07
2003
-09
2003
-11
2004
-01
2004
-03
2004
-05
2004
-07
2004
-09
2004
-11
2005
-01
2005
-03
2005
-08
2005
-10
2005
-12
2006
-02
2006
-04
2006
-06
2006
-08
2006
-10
2006
-12
0.00
0.05
0.10
0.15
0.20
0.25
ppm
1999
-01
1999
-03
1999
-05
1999
-07
1999
-09
1999
-11
2000
-01
2000
-03
2000
-05
2000
-07
2000
-09
2000
-11
2001
-01
2001
-03
2001
-05
2001
-07
2001
-09
2001
-11
2002
-01
2002
-03
2002
-05
2002
-07
2002
-09
2002
-11
2003
-01
2003
-03
2003
-05
2003
-07
2003
-09
2003
-11
2004
-01
2004
-03
2004
-05
2004
-07
2004
-09
2004
-11
2005
-01
2005
-03
2005
-08
2005
-10
2005
-12
2006
-02
2006
-04
2006
-06
2006
-08
2006
-10
2006
-12
0.000.020.040.060.080.100.120.14
ppm
1999
-01
1999
-03
1999
-05
1999
-07
1999
-09
1999
-11
2000
-01
2000
-03
2000
-05
2000
-07
2000
-09
2000
-11
2001
-01
2001
-03
2001
-05
2001
-07
2001
-09
2001
-11
2002
-01
2002
-03
2002
-05
2002
-07
2002
-09
2002
-11
2003
-01
2003
-03
2003
-05
2003
-07
2003
-09
2003
-11
2004
-01
2004
-03
2004
-05
2004
-07
2004
-09
2004
-11
2005
-01
2005
-03
2005
-08
2005
-10
2005
-12
2006
-02
2006
-04
2006
-06
2006
-08
2006
-10
2006
-12
0.0
5.0
10.0
15.0
20.0
25.0
ppb
1999
-01
1999
-03
1999
-05
1999
-07
1999
-09
1999
-11
2000
-01
2000
-03
2000
-05
2000
-07
2000
-09
2000
-11
2001
-01
2001
-03
2001
-05
2001
-07
2001
-09
2001
-11
2002
-01
2002
-03
2002
-05
2002
-07
2002
-09
2002
-11
2003
-01
2003
-03
2003
-05
2003
-07
2003
-09
2003
-11
2004
-01
2004
-03
2004
-05
2004
-07
2004
-09
2004
-11
2005
-01
2005
-03
2005
-08
2005
-10
2005
-12
2006
-02
2006
-04
2006
-06
2006
-08
2006
-10
2006
-12
Salinity
Dissolved Inorganic Nitrogen
Total Phosphorus
Chlorophyll a
Figure 23. Box-and-whisker plots of water quality in RB-PIS by survey.
Page 27
27
Rookery Bay Zone
0.0
10.0
20.0
30.0
40.0
1999
-01
1999
-03
1999
-05
1999
-07
1999
-09
1999
-11
2000
-01
2000
-03
2000
-05
2000
-07
2000
-09
2000
-11
2001
-01
2001
-03
2001
-05
2001
-07
2001
-09
2001
-11
2002
-01
2002
-03
2002
-05
2002
-07
2002
-09
2002
-11
2003
-01
2003
-03
2003
-05
2003
-07
2003
-09
2003
-11
2004
-01
2004
-03
2004
-05
2004
-07
2004
-09
2004
-11
2005
-01
2005
-03
2005
-08
2005
-10
2005
-12
2006
-02
2006
-04
2006
-06
2006
-08
2006
-10
2006
-12
0.00
0.05
0.10
0.15
0.20
0.25
0.30
ppm
1999
-01
1999
-03
1999
-05
1999
-07
1999
-09
1999
-11
2000
-01
2000
-03
2000
-05
2000
-07
2000
-09
2000
-11
2001
-01
2001
-03
2001
-05
2001
-07
2001
-09
2001
-11
2002
-01
2002
-03
2002
-05
2002
-07
2002
-09
2002
-11
2003
-01
2003
-03
2003
-05
2003
-07
2003
-09
2003
-11
2004
-01
2004
-03
2004
-05
2004
-07
2004
-09
2004
-11
2005
-01
2005
-03
2005
-08
2005
-10
2005
-12
2006
-02
2006
-04
2006
-06
2006
-08
2006
-10
2006
-12
0.00
0.02
0.04
0.06
0.08
0.10
ppm
1999
-01
1999
-03
1999
-05
1999
-07
1999
-09
1999
-11
2000
-01
2000
-03
2000
-05
2000
-07
2000
-09
2000
-11
2001
-01
2001
-03
2001
-05
2001
-07
2001
-09
2001
-11
2002
-01
2002
-03
2002
-05
2002
-07
2002
-09
2002
-11
2003
-01
2003
-03
2003
-05
2003
-07
2003
-09
2003
-11
2004
-01
2004
-03
2004
-05
2004
-07
2004
-09
2004
-11
2005
-01
2005
-03
2005
-08
2005
-10
2005
-12
2006
-02
2006
-04
2006
-06
2006
-08
2006
-10
2006
-12
0.0
5.0
10.0
15.0
20.0
25.0
30.0
ppb
1999
-01
1999
-03
1999
-05
1999
-07
1999
-09
1999
-11
2000
-01
2000
-03
2000
-05
2000
-07
2000
-09
2000
-11
2001
-01
2001
-03
2001
-05
2001
-07
2001
-09
2001
-11
2002
-01
2002
-03
2002
-05
2002
-07
2002
-09
2002
-11
2003
-01
2003
-03
2003
-05
2003
-07
2003
-09
2003
-11
2004
-01
2004
-03
2004
-05
2004
-07
2004
-09
2004
-11
2005
-01
2005
-03
2005
-08
2005
-10
2005
-12
2006
-02
2006
-04
2006
-06
2006
-08
2006
-10
2006
-12
Salinity
Dissolved Inorganic Nitrogen
Total Phosphorus
Chlorophyll a
Figure 24. Box-and-whisker plots of water quality in RB-PIS by survey.
Page 28
28
Naples Zone
0.05.0
10.015.020.025.030.035.040.0
1999
-01
1999
-03
1999
-05
1999
-07
1999
-09
1999
-11
2000
-01
2000
-03
2000
-05
2000
-07
2000
-09
2000
-11
2001
-01
2001
-03
2001
-05
2001
-07
2001
-09
2001
-11
2002
-01
2002
-03
2002
-05
2002
-07
2002
-09
2002
-11
2003
-01
2003
-03
2003
-05
2003
-07
2003
-09
2003
-11
2004
-01
2004
-03
2004
-05
2004
-07
2004
-09
2004
-11
2005
-01
2005
-03
2005
-08
2005
-10
2005
-12
2006
-02
2006
-04
2006
-06
2006
-08
2006
-10
2006
-12
0.00
0.05
0.10
0.15
0.20
0.25
ppm
1999
-01
1999
-03
1999
-05
1999
-07
1999
-09
1999
-11
2000
-01
2000
-03
2000
-05
2000
-07
2000
-09
2000
-11
2001
-01
2001
-03
2001
-05
2001
-07
2001
-09
2001
-11
2002
-01
2002
-03
2002
-05
2002
-07
2002
-09
2002
-11
2003
-01
2003
-03
2003
-05
2003
-07
2003
-09
2003
-11
2004
-01
2004
-03
2004
-05
2004
-07
2004
-09
2004
-11
2005
-01
2005
-03
2005
-08
2005
-10
2005
-12
2006
-02
2006
-04
2006
-06
2006
-08
2006
-10
2006
-12
0.000.020.040.060.080.100.120.14
ppm
1999
-01
1999
-03
1999
-05
1999
-07
1999
-09
1999
-11
2000
-01
2000
-03
2000
-05
2000
-07
2000
-09
2000
-11
2001
-01
2001
-03
2001
-05
2001
-07
2001
-09
2001
-11
2002
-01
2002
-03
2002
-05
2002
-07
2002
-09
2002
-11
2003
-01
2003
-03
2003
-05
2003
-07
2003
-09
2003
-11
2004
-01
2004
-03
2004
-05
2004
-07
2004
-09
2004
-11
2005
-01
2005
-03
2005
-08
2005
-10
2005
-12
2006
-02
2006
-04
2006
-06
2006
-08
2006
-10
2006
-12
0.0
5.0
10.0
15.0
20.0
ppb
1999
-01
1999
-03
1999
-05
1999
-07
1999
-09
1999
-11
2000
-01
2000
-03
2000
-05
2000
-07
2000
-09
2000
-11
2001
-01
2001
-03
2001
-05
2001
-07
2001
-09
2001
-11
2002
-01
2002
-03
2002
-05
2002
-07
2002
-09
2002
-11
2003
-01
2003
-03
2003
-05
2003
-07
2003
-09
2003
-11
2004
-01
2004
-03
2004
-05
2004
-07
2004
-09
2004
-11
2005
-01
2005
-03
2005
-08
2005
-10
2005
-12
2006
-02
2006
-04
2006
-06
2006
-08
2006
-10
2006
-12
Salinity
Dissolved Inorganic Nitrogen
Total Phosphorus
Chlorophyll a
Figure 25. Box-and-whisker plots of water quality in RB-PIS by survey.
Page 29
29
San Carlos Bay Zone
0.05.0
10.015.020.025.030.035.040.0
1999
-01
1999
-03
1999
-05
1999
-07
1999
-09
1999
-11
2000
-01
2000
-03
2000
-05
2000
-07
2000
-09
2000
-11
2001
-01
2001
-03
2001
-05
2001
-07
2001
-09
2001
-11
2002
-01
2002
-03
2002
-05
2002
-07
2002
-09
2002
-11
2003
-01
2003
-03
2003
-05
2003
-07
2003
-09
2003
-11
2004
-01
2004
-03
2004
-05
2004
-07
2004
-09
2004
-11
2005
-01
2005
-03
2005
-08
2005
-10
2005
-12
2006
-02
2006
-04
2006
-06
2006
-08
2006
-10
2006
-12
0.000.100.200.300.400.500.600.70
ppm
1999
-01
1999
-03
1999
-05
1999
-07
1999
-09
1999
-11
2000
-01
2000
-03
2000
-05
2000
-07
2000
-09
2000
-11
2001
-01
2001
-03
2001
-05
2001
-07
2001
-09
2001
-11
2002
-01
2002
-03
2002
-05
2002
-07
2002
-09
2002
-11
2003
-01
2003
-03
2003
-05
2003
-07
2003
-09
2003
-11
2004
-01
2004
-03
2004
-05
2004
-07
2004
-09
2004
-11
2005
-01
2005
-03
2005
-08
2005
-10
2005
-12
2006
-02
2006
-04
2006
-06
2006
-08
2006
-10
2006
-12
0.00
0.05
0.10
0.15
0.20
0.25
ppm
1999
-01
1999
-03
1999
-05
1999
-07
1999
-09
1999
-11
2000
-01
2000
-03
2000
-05
2000
-07
2000
-09
2000
-11
2001
-01
2001
-03
2001
-05
2001
-07
2001
-09
2001
-11
2002
-01
2002
-03
2002
-05
2002
-07
2002
-09
2002
-11
2003
-01
2003
-03
2003
-05
2003
-07
2003
-09
2003
-11
2004
-01
2004
-03
2004
-05
2004
-07
2004
-09
2004
-11
2005
-01
2005
-03
2005
-08
2005
-10
2005
-12
2006
-02
2006
-04
2006
-06
2006
-08
2006
-10
2006
-12
0.0
5.0
10.0
15.0
20.0
25.0
30.0
ppb
1999
-01
1999
-03
1999
-05
1999
-07
1999
-09
1999
-11
2000
-01
2000
-03
2000
-05
2000
-07
2000
-09
2000
-11
2001
-01
2001
-03
2001
-05
2001
-07
2001
-09
2001
-11
2002
-01
2002
-03
2002
-05
2002
-07
2002
-09
2002
-11
2003
-01
2003
-03
2003
-05
2003
-07
2003
-09
2003
-11
2004
-01
2004
-03
2004
-05
2004
-07
2004
-09
2004
-11
2005
-01
2005
-03
2005
-08
2005
-10
2005
-12
2006
-02
2006
-04
2006
-06
2006
-08
2006
-10
2006
-12
Salinity
Dissolved Inorganic Nitrogen
Total Phosphorus
Chlorophyll a
Figure 26. Box-and-whisker plots of water quality in RB-PIS by survey.
Page 30
30
Estero Bay Zone
0.05.0
10.015.020.025.030.035.040.0
1999
-01
1999
-03
1999
-05
1999
-07
1999
-09
1999
-11
2000
-01
2000
-03
2000
-05
2000
-07
2000
-09
2000
-11
2001
-01
2001
-03
2001
-05
2001
-07
2001
-09
2001
-11
2002
-01
2002
-03
2002
-05
2002
-07
2002
-09
2002
-11
2003
-01
2003
-03
2003
-05
2003
-07
2003
-09
2003
-11
2004
-01
2004
-03
2004
-05
2004
-07
2004
-09
2004
-11
2005
-01
2005
-03
2005
-08
2005
-10
2005
-12
2006
-02
2006
-04
2006
-06
2006
-08
2006
-10
2006
-12
0.00
0.05
0.10
0.15
0.20
0.25
ppm
1999
-01
1999
-03
1999
-05
1999
-07
1999
-09
1999
-11
2000
-01
2000
-03
2000
-05
2000
-07
2000
-09
2000
-11
2001
-01
2001
-03
2001
-05
2001
-07
2001
-09
2001
-11
2002
-01
2002
-03
2002
-05
2002
-07
2002
-09
2002
-11
2003
-01
2003
-03
2003
-05
2003
-07
2003
-09
2003
-11
2004
-01
2004
-03
2004
-05
2004
-07
2004
-09
2004
-11
2005
-01
2005
-03
2005
-08
2005
-10
2005
-12
2006
-02
2006
-04
2006
-06
2006
-08
2006
-10
2006
-12
0.00
0.04
0.08
0.12
0.16
ppm
1999
-01
1999
-03
1999
-05
1999
-07
1999
-09
1999
-11
2000
-01
2000
-03
2000
-05
2000
-07
2000
-09
2000
-11
2001
-01
2001
-03
2001
-05
2001
-07
2001
-09
2001
-11
2002
-01
2002
-03
2002
-05
2002
-07
2002
-09
2002
-11
2003
-01
2003
-03
2003
-05
2003
-07
2003
-09
2003
-11
2004
-01
2004
-03
2004
-05
2004
-07
2004
-09
2004
-11
2005
-01
2005
-03
2005
-08
2005
-10
2005
-12
2006
-02
2006
-04
2006
-06
2006
-08
2006
-10
2006
-12
0.0
5.0
10.0
15.0
20.0
25.0
ppb
1999
-01
1999
-03
1999
-05
1999
-07
1999
-09
1999
-11
2000
-01
2000
-03
2000
-05
2000
-07
2000
-09
2000
-11
2001
-01
2001
-03
2001
-05
2001
-07
2001
-09
2001
-11
2002
-01
2002
-03
2002
-05
2002
-07
2002
-09
2002
-11
2003
-01
2003
-03
2003
-05
2003
-07
2003
-09
2003
-11
2004
-01
2004
-03
2004
-05
2004
-07
2004
-09
2004
-11
2005
-01
2005
-03
2005
-08
2005
-10
2005
-12
2006
-02
2006
-04
2006
-06
2006
-08
2006
-10
2006
-12
Salinity
Dissolved Inorganic Nitrogen
Total Phosphorus
Chlorophyll a
Figure 27. Box-and-whisker plots of water quality in RB-PIS by survey.
Page 31
31
Pine Island Sound Zone
0.05.0
10.015.020.025.030.035.040.0
1999
-01
1999
-03
1999
-05
1999
-07
1999
-09
1999
-11
2000
-01
2000
-03
2000
-05
2000
-07
2000
-09
2000
-11
2001
-01
2001
-03
2001
-05
2001
-07
2001
-09
2001
-11
2002
-01
2002
-03
2002
-05
2002
-07
2002
-09
2002
-11
2003
-01
2003
-03
2003
-05
2003
-07
2003
-09
2003
-11
2004
-01
2004
-03
2004
-05
2004
-07
2004
-09
2004
-11
2005
-01
2005
-03
2005
-08
2005
-10
2005
-12
2006
-02
2006
-04
2006
-06
2006
-08
2006
-10
2006
-12
0.00
0.05
0.10
0.15
0.20
ppm
1999
-01
1999
-03
1999
-05
1999
-07
1999
-09
1999
-11
2000
-01
2000
-03
2000
-05
2000
-07
2000
-09
2000
-11
2001
-01
2001
-03
2001
-05
2001
-07
2001
-09
2001
-11
2002
-01
2002
-03
2002
-05
2002
-07
2002
-09
2002
-11
2003
-01
2003
-03
2003
-05
2003
-07
2003
-09
2003
-11
2004
-01
2004
-03
2004
-05
2004
-07
2004
-09
2004
-11
2005
-01
2005
-03
2005
-08
2005
-10
2005
-12
2006
-02
2006
-04
2006
-06
2006
-08
2006
-10
2006
-12
0.00
0.04
0.08
0.12
0.16
ppm
1999
-01
1999
-03
1999
-05
1999
-07
1999
-09
1999
-11
2000
-01
2000
-03
2000
-05
2000
-07
2000
-09
2000
-11
2001
-01
2001
-03
2001
-05
2001
-07
2001
-09
2001
-11
2002
-01
2002
-03
2002
-05
2002
-07
2002
-09
2002
-11
2003
-01
2003
-03
2003
-05
2003
-07
2003
-09
2003
-11
2004
-01
2004
-03
2004
-05
2004
-07
2004
-09
2004
-11
2005
-01
2005
-03
2005
-08
2005
-10
2005
-12
2006
-02
2006
-04
2006
-06
2006
-08
2006
-10
2006
-12
0.0
5.0
10.0
15.0
20.0
25.0
30.0
ppb
1999
-01
1999
-03
1999
-05
1999
-07
1999
-09
1999
-11
2000
-01
2000
-03
2000
-05
2000
-07
2000
-09
2000
-11
2001
-01
2001
-03
2001
-05
2001
-07
2001
-09
2001
-11
2002
-01
2002
-03
2002
-05
2002
-07
2002
-09
2002
-11
2003
-01
2003
-03
2003
-05
2003
-07
2003
-09
2003
-11
2004
-01
2004
-03
2004
-05
2004
-07
2004
-09
2004
-11
2005
-01
2005
-03
2005
-08
2005
-10
2005
-12
2006
-02
2006
-04
2006
-06
2006
-08
2006
-10
2006
-12
Salinity
Dissolved Inorganic Nitrogen
Total Phosphorus
Chlorophyll a
Figure 28. Box-and-whisker plots of water quality in RB-PIS by survey.
Page 32
32
Cocohatchee River at Wiggins Pass
0.05.0
10.015.020.025.030.035.040.0
1999
-02
1999
-04
1999
-06
1999
-08
1999
-10
1999
-12
2000
-02
2000
-04
2000
-06
2000
-08
2000
-10
2000
-12
2001
-02
2001
-04
2001
-06
2001
-08
2001
-10
2001
-12
2002
-02
2002
-04
2002
-06
2002
-08
2002
-10
2002
-12
2003
-02
2003
-04
2003
-06
2003
-08
2003
-10
2003
-12
2004
-02
2004
-04
2004
-06
2004
-08
2004
-10
2004
-12
2005
-07
2006
-01
2006
-07
0.000.050.100.150.200.250.300.35
ppm
1999
-02
1999
-04
1999
-06
1999
-08
1999
-10
1999
-12
2000
-02
2000
-04
2000
-06
2000
-08
2000
-10
2000
-12
2001
-02
2001
-04
2001
-06
2001
-08
2001
-10
2001
-12
2002
-02
2002
-04
2002
-06
2002
-08
2002
-10
2002
-12
2003
-02
2003
-04
2003
-06
2003
-08
2003
-10
2003
-12
2004
-02
2004
-04
2004
-06
2004
-08
2004
-10
2004
-12
2005
-07
2006
-01
2006
-07
0.000.020.040.060.080.100.120.14
ppm
1999
-02
1999
-04
1999
-06
1999
-08
1999
-10
1999
-12
2000
-02
2000
-04
2000
-06
2000
-08
2000
-10
2000
-12
2001
-02
2001
-04
2001
-06
2001
-08
2001
-10
2001
-12
2002
-02
2002
-04
2002
-06
2002
-08
2002
-10
2002
-12
2003
-02
2003
-04
2003
-06
2003
-08
2003
-10
2003
-12
2004
-02
2004
-04
2004
-06
2004
-08
2004
-10
2004
-12
2005
-07
2006
-01
2006
-07
0.0
4.0
8.0
12.0
16.0
20.0
ppb
1999
-02
1999
-04
1999
-06
1999
-08
1999
-10
1999
-12
2000
-02
2000
-04
2000
-06
2000
-08
2000
-10
2000
-12
2001
-02
2001
-04
2001
-06
2001
-08
2001
-10
2001
-12
2002
-02
2002
-04
2002
-06
2002
-08
2002
-10
2002
-12
2003
-02
2003
-04
2003
-06
2003
-08
2003
-10
2003
-12
2004
-02
2004
-04
2004
-06
2004
-08
2004
-10
2004
-12
2005
-07
2006
-01
2006
-07
Chlorophyll a
Total Phosphorus
Dissolved Inorganic Nitrogen
Salinity
Figure 29. Box-and-whisker plots of water quality in RB-PIS by survey.
Page 34
34
0.00
0.01
0.02
0.03pp
m
1989
1990
1991
1992
1993
1994
1995
1996
1997
1998
1999
2000
2001
2002
2003
2004
2005
2006
TP
0.0
1.0
2.0
3.0
4.0
5.0
6.0
ppb
1989
1990
1991
1992
1993
1994
1995
1996
1997
1998
1999
2000
2001
2002
2003
2004
2005
2006
CHLA
Figure 30. Reversal of TP decline in Eastern Bay in 2006 as related to algal bloom event.
Page 35
35
Table 1. Parameter Zone Median Min. Max. n
Chlorophyll a Biscayne Bay 0.374 0.127 8.018 75 (μg l-1) Florida Bay 1.848 0.127 9.939 84
Rookery Bay 2.378 0.568 9.886 85 SW Shelf 0.864 0.191 8.448 49 Ten Thousand Is. 2.543 0.862 9.183 76 Whitewater Bay 4.565 0.768 14.344 66
Surface Biscayne Bay 7.57 6.46 9.66 74 Dissolved Florida Bay 7.56 4.84 10.10 84 Oxygen Rookery Bay 8.16 6.42 10.58 85 (mg l-1) SW Shelf 4.80 4.34 5.62 49
Ten Thousand Is. 8.52 4.74 10.26 76 Whitewater Bay 7.86 3.19 10.49 66
Bottom Biscayne Bay 7.52 6.39 9.59 74 Dissolved Florida Bay 7.30 3.78 9.59 84 Oxygen Rookery Bay 7.93 5.66 10.44 84 (mg l-1) SW Shelf 4.46 3.12 5.52 49
Ten Thousand Is. 8.14 4.52 10.33 76 Whitewater Bay 7.56 2.79 10.52 66
NH4+ Biscayne Bay 0.0140 0.0010 0.1670 75
(ppm) Florida Bay 0.0090 0.0010 0.0790 84 Rookery Bay 0.0050 0.0010 0.0920 85 SW Shelf 0.0090 0.0005 0.0460 49 Ten Thousand Is. 0.0250 0.0020 0.0920 76 Whitewater Bay 0.0140 0.0040 0.4250 66
NO2- Biscayne Bay 0.0020 0.0003 0.0180 75
(ppm) Florida Bay 0.0010 0.0000 0.0160 84 Rookery Bay 0.0010 0.0001 0.0050 85 SW Shelf 0.0010 0.0002 0.0060 49 Ten Thousand Is. 0.0030 0.0001 0.0100 76 Whitewater Bay 0.0020 0.0004 0.1210 66
Page 36
36
Parameter Zone Median Min. Max. n
NO3- Biscayne Bay 0.0090 0.0000 0.3690 75
(ppm) Florida Bay 0.0090 0.0010 0.0460 84 Rookery Bay 0.0040 0.0001 0.0270 85 SW Shelf 0.0020 0.0003 0.0230 49 Ten Thousand Is. 0.0220 0.0000 0.0890 76 Whitewater Bay 0.0160 0.0003 0.0780 66
pH Biscayne Bay 7.930 7.650 8.040 74 Florida Bay 8.025 7.394 8.715 84 Rookery Bay 7.880 7.530 8.120 85 SW Shelf 7.885 7.755 7.995 49 Ten Thousand Is. 7.818 7.430 8.425 76 Whitewater Bay 7.978 7.300 8.440 66
Surface Biscayne Bay 34.30 19.00 38.14 74 Salinity Florida Bay 31.37 2.69 38.37 84
Rookery Bay 34.49 22.19 38.38 85 SW Shelf 34.95 31.02 37.36 49 Ten Thousand Is. 26.86 1.14 35.52 76 Whitewater Bay 8.85 0.52 27.77 66
Bottom Biscayne Bay 34.71 27.34 38.16 74 Salinity Florida Bay 31.72 10.32 38.36 84
Rookery Bay 34.74 23.31 38.38 84 SW Shelf 33.98 24.39 36.81 49 Ten Thousand Is. 27.07 1.15 35.54 76 Whitewater Bay 9.79 0.65 28.90 66
Si(OH)4 Biscayne Bay 0.1090 0.0010 0.8600 25 (ppm) Florida Bay 1.6240 0.3670 2.8520 28
Rookery Bay 0.8490 0.1130 1.4750 27 SW Shelf 0.2880 0.0002 2.0120 49 Ten Thousand Is. 2.0870 1.1530 2.7830 25 Whitewater Bay 3.0860 1.3430 4.5290 22
Soluble Biscayne Bay 0.0010 0.0002 0.0100 75 Reactive Florida Bay 0.0010 0.0004 0.0070 84
Phosphorus Rookery Bay 0.0120 0.0010 0.0450 85 (ppm) SW Shelf 0.0010 0.0010 0.0030 49
Ten Thousand Is. 0.0080 0.0002 0.0460 76
Page 37
37
Whitewater Bay 0.0020 0.0003 0.0160 66 Parameter Zone Median Min. Max. n
Surface Biscayne Bay 25.67 22.80 29.09 74 Temperature Florida Bay 25.53 23.72 29.73 84
(oC) Rookery Bay 19.78 16.55 26.23 85 SW Shelf 25.49 23.95 29.08 49 Ten Thousand Is. 22.83 20.01 26.02 76 Whitewater Bay 25.23 22.35 28.36 66
Bottom Biscayne Bay 25.69 22.88 32.70 74 Temperature Florida Bay 25.48 23.82 30.59 84
(oC) Rookery Bay 19.67 16.59 26.23 84 SW Shelf 25.40 22.67 29.15 49 Ten Thousand Is. 23.04 19.96 27.70 76 Whitewater Bay 25.17 22.39 28.14 66
Total Biscayne Bay 0.230 0.160 0.991 75 Nitrogen Florida Bay 0.467 0.156 0.882 84
(ppm) Rookery Bay 0.243 0.142 0.534 85 SW Shelf 0.185 0.146 0.366 49 Ten Thousand Is. 0.344 0.182 0.558 76 Whitewater Bay 0.425 0.274 1.072 66
Total Biscayne Bay 2.477 1.365 6.244 75 Organic Florida Bay 10.033 1.268 19.295 84 Carbon Rookery Bay 3.493 1.883 7.356 85 (ppm) SW Shelf 2.053 1.213 3.740 49
Ten Thousand Is. 7.126 3.386 16.140 76 Whitewater Bay 11.395 5.182 23.565 66
Total Biscayne Bay 0.199 0.119 0.987 75 Organic Florida Bay 0.422 0.150 0.866 84 Nitrogen Rookery Bay 0.212 0.126 0.520 85
(ppm) SW Shelf 0.172 0.128 0.353 49 Ten Thousand Is. 0.282 0.152 0.527 76 Whitewater Bay 0.366 0.228 0.687 66
Total Biscayne Bay 0.013 0.005 0.052 75 Phosphorus Florida Bay 0.018 0.005 0.049 84
(ppm) Rookery Bay 0.041 0.023 0.215 83 SW Shelf 0.031 0.010 0.051 49 Ten Thousand Is. 0.038 0.020 0.075 73
Page 38
38
Whitewater Bay 0.025 0.015 0.063 66 Parameter Zone Median Min. Max. n Turbidity Biscayne Bay 0.92 0.11 2.70 74
(NTU) Florida Bay 3.64 0.18 15.81 84 Rookery Bay 3.42 0.57 14.86 85 SW Shelf 2.01 0.46 3.82 49 Ten Thousand Is. 4.11 0.09 18.37 76 Whitewater Bay 3.93 0.28 14.33 66