31
West Virginia’s Review of Longview Power’s ACE Permit Application and Lessons Learned Hosted by West Virginia Division of Air Quality Edward Andrews, P.E. December 2, 2020

West Virginia’s
Review of Longview Power’s
ACE Permit Application
and
Lessons Learned
Hosted by
West Virginia Division of Air Quality
Edward Andrews, P.E.
December 2, 2020

Overview
• Is WV working on an ACE permit?
• Who is Longview Power?
• Subpart UUUUa (ACE Rule)
• Applied BSERs & HRIs
• Proposed Standards
• Anticipated Future Operational Characteristics
• Monitoring
• Testing
• Recordkeeping
• Reporting
• Resources
• Lessons Learned
2

Is WV Working on an ACE Permit?
• Longview Power has voluntarily proposed to establish CO2 Emission Standards in accordance with the Emission Guidelines of Subpart UUUUa (ACE Rule) using the WV Minor Source Permitting Rule.
• Currently WV DAQ is developing responses to 10 written comments and 21 oral comments.
• When all comments have been addressed, the WV DAQ will make a final decision on the Longview ACE Permit.
3

Who is Longview Power?
• Longview Power is a merchant power plant operating in the PJM RTO market with a single EGU, located in Maidsville, WV.
• The Unit:
o Gross rating of 789 MW.
o Once-through, supercritical steam generator.
o High-pressure, immediate-pressure and two low-pressure steam turbines on single tandem.
o Single reheat steam circuit.
o Pulverized coal-fired unit using bituminous coal.
4

Subpart UUUUa (ACE Rule)
• This rule will require states to establish CO2 Standards for coal-fired EGUs that commenced construction before June 2014.
• The Standard must be a rate-based standard in the form of mass CO2 per energy output (e.g. lb CO2 per megawatt of electricity).
• Seven Candidate Technologies of Heat Rate Improvements must be evaluated as to whether these improvements can be implemented and the potential impact on the unit’s heat rate and reduction in CO2
emissions.
5

Candidate Technologies (aka BSERs)
Potential Range of Heat Improvements
HRI Measure % Min % Max
Neural Network/Intelligent Sootblowers 0.3 0.9
Boiler Feed Pumps 0.2 0.5
Air Heater and Duct Leakage Control 0.1 0.4
Variable Frequency Drives 0.2 1.0
Blade Path Upgrade (Steam Turbine) 1.0 2.9
Redesign/Replace Economizer 0.5 1.0
Improved Operating and Maintenance(O&M) Practices
Can range from 0 to > 2.0% depending on the unit's historical O&M practices
6

Applied BSERs & HRIs
7

Summary of LVP’s Heat Rate Improvements
• Upgraded the Neural Network in the Summer of 2015*
• Installed Intelligent Sootblowing System in the Fall of 2015*
• Installed Intelligent Combustion System in Fall of 2018
• Operates an Online Condenser Cleaning System*
• Installed Online Air Heater Basket Cleaning System in 2018
* Candidate technology of heat rate improvement (HRI).
8

Summary of LVP’s Original Designs
• Forced and induced draft fans are axial fans with variable pitch blade design.
• Feed water pumps are variable speed pumps due to hydraulic geared coupling system.
• Air heater seals are an adjustable, double seal designed system.*
• Siemens’ Advance Design steam turbines.
• Economizer is equipped with a by-pass to maintain the optimal flue gas temperature for the SCR.
* Candidate technology of heat rate improvement (HRI).
9

Heat Rates
Plant Name State Name Capacity (MW) Heat Rate (Btu/kWh) On Line Year
Longview Power Plant West Virginia 700 8904 2011
James E. Rogers Energy Complex North Carolina 844 9090 2012
John W Turk Jr Power Plant Arkansas 609 9102 2012
Belews Creek North Carolina 1110 9185 1974
Belews Creek North Carolina 1110 9203 1975
Marshall (NC) North Carolina 660 9300 1965
https://www.epa.gov/sites/production/files/2020-10/needs_v620_10-05-20_0.xlsx
10

Issues in Development of the Performance Standards
• Baseline Period 2016-2020 2nd Quarter.
o Over 90% of operating time the unit operated within the upper load bin.
• Hourly emission rate varied.
• How to show that the standard is constraining?
• What is reasonable?
• Compliance margins.
• How to account for other changes (e.g., fuel switching, unit degradation, etc.)?
• CBI.
11

Overcoming the Issues
• Broke down the data into load bins.
o Used unadjusted flowrates.
• Reduced the peaks and valleys in the data.
o Reduced the hourly emission data to monthly and developed a 12-month rolling average over the entire baseline period.
12

1,850
1,870
1,890
1,910
1,930
1,950
1,970
1,990
Jan Mar May Jul Sep Nov Jan Mar May Jul Sep Nov Jan Mar May Jul Sep Nov Jan Mar May Jul Sep Nov Jan Mar May
2016 2017 2018 2019 2020
CO
2Rate
(lb
/MW
h N
et)
CO2 Rate for LB-5lb/MWN
12M Rolling Avg + 2Sdfor LB-5 lb/MWhN
12 Mth Rolling Avg
CO2 Emission Rate for Load Bin 5 During the Baseline Period
13

Overcoming the Issues
• Would the historical emissions be constraining?
• What about the NSPS Subpart TTTT limit?
• Level 2 Limit was created for equipment failures where the unit could still operate but with degraded efficiency (impaired operation).
• Unit Degradation Adjustment Factor – includes a recovery rate.
• Coal Adjustment Factor to account for fuel supplier switching. Pre- and post-tests to develop a ratio to be applied to each of the bin limits.
14

1650
1700
1750
1800
1850
1900
1950
Jan
Feb
Mar
Ap
rM
ay Jun
Jul
Au
gSe
pO
ctN
ov
Dec Jan
Feb
Mar
Ap
rM
ay Jun
Jul
Au
gSe
pO
ctN
ov
Dec Jan
Feb
Mar
Ap
rM
ay Jun
Jul
Au
gSe
pO
ctN
ov
Dec Jan
Feb
Mar
Ap
rM
ay Jun
Jul
Au
gSe
pO
ctN
ov
Dec Jan
Feb
Mar
Ap
rM
ay Jun
2016 2017 2018 2019 2020
CO
2 R
ate
(lb
/MW
h -
Gro
ss)
Weighted Avg Vs. NSPS Limit CO2 Weighted Avg Limit
NSPS LImit
12 Mth Rolling Avg of the WeightedLimit
Weighted Avg Standard Gross Basis versesthe NSPS Standard for Reconstructed EGUs
15

1850
1900
1950
2000
2050
2100
2150
2200
2250
Jan Mar May Jul Sep Nov Jan Mar May Jul Sep Nov Jan Mar May Jul Sep Nov Jan Mar May Jul Sep Nov Jan Mar May
2016 2017 2018 2019 2020
CO
2 R
ate
(lb
/MW
h-
Net
)
CO2 Weighted Avg LImit -Net
Adj NSPS Limit
12 per. Mov. Avg. (CO2 Weighted AvgLImit -Net)
Weighted Avg Standard (Net) versesthe NSPS Standard for Reconstructed EGUs Adj to Net Generation
16

Proposed Performance Standards
• Weighted Average Limit based on 5 Normal Load Bin Limits weighted on hours of operation for each of the load bins on a calendar year basis.
• Two levels of Normal Load Bin Limits (LB-1 through 5).
o Level 1 – Normal Operations
o Level 2 – Impaired Operations
• Startup and shutdown emissions has its own limit on a calendar year basis (LB-0).
17
Proposed Standard – Bin Limits
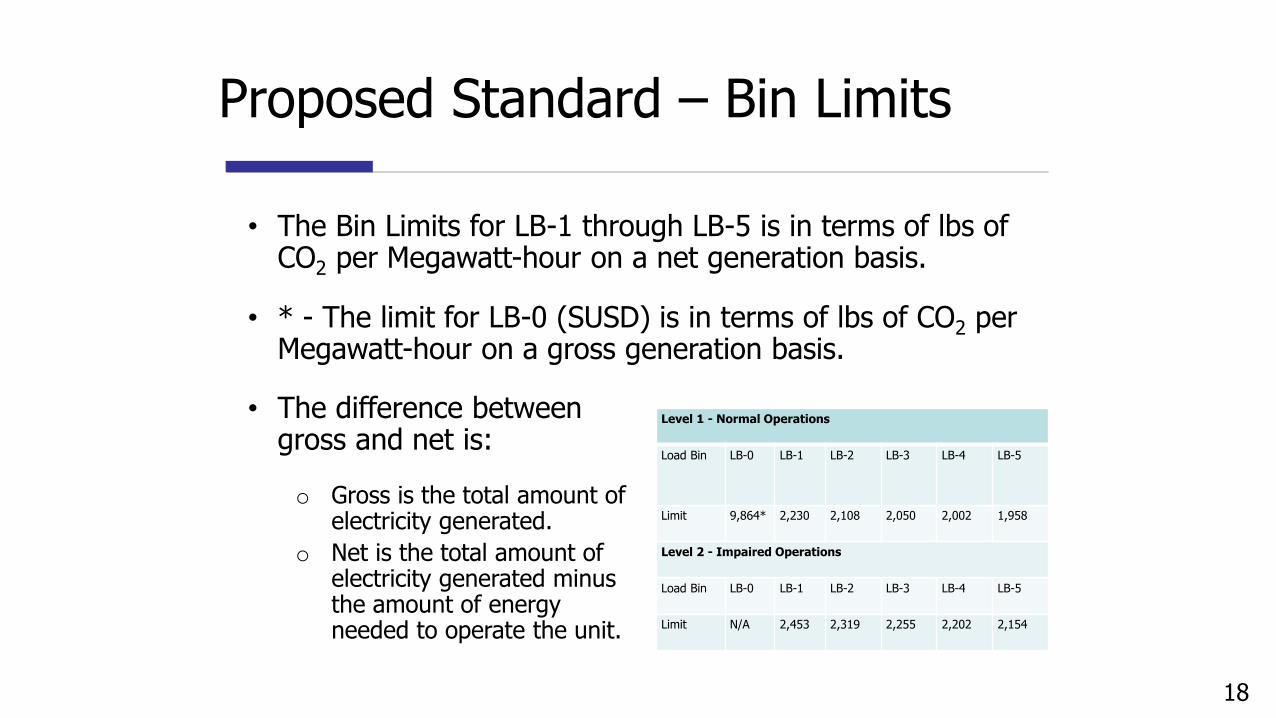
• The Bin Limits for LB-1 through LB-5 is in terms of lbs of CO2 per Megawatt-hour on a net generation basis.
• * - The limit for LB-0 (SUSD) is in terms of lbs of CO2 per Megawatt-hour on a gross generation basis.
Level 1 - Normal Operations
Load Bin LB-0 LB-1 LB-2 LB-3 LB-4 LB-5
Limit 9,864* 2,230 2,108 2,050 2,002 1,958
Level 2 - Impaired Operations
Load Bin LB-0 LB-1 LB-2 LB-3 LB-4 LB-5
Limit N/A 2,453 2,319 2,255 2,202 2,154
• The difference between gross and net is:
o Gross is the total amount of electricity generated.
o Net is the total amount of electricity generated minus the amount of energy needed to operate the unit.
18
Proposed Standard – Other Adjustments
• Unit Degradation Adjustment Factor (UDAF) will increase all the Bin Limits by 0.4% annually with a recovery factor (decrease the limits) of 0.7% applied once every fifth year. This adjustment factor is to account for unit degradation over time up to year 2046. The recovery factor is to account for the recovered degradation as a result of minor/major repair work.
• Coal Adjustment Factor will adjust the Bin Limits due to fuel supplier changes.
19

Anticipated Future Operational Characteristics
• Longview provided annual generation, CO2
emissions, fuel usage, carbon content, heat rate, electric generation capacity, and capacity factor.
• Avoided the need to use fixed and variable operations and maintenance costs; fuel cost; and wholesale electricity prices (CBI data) to justify or support the standard.
20

Requirements
21

Monitoring – New Requirements
• LVP will have to monitor and record the hours of operation in each of the load bins during the compliance period.
• LVP will have to monitor and record the auxiliary load of the unit and determine the net generation on an hourly basis.
• LVP will have to monitor and record the heat rate of the unit and determine the average heat rate during the compliance period.
22

Monitoring
• Existing Monitoring System will be used.o Only unbiased monitored data will be used for
compliance.o Emission Data using Part 75 Substitution Procedures
cannot be used for compliance.o This includes full span exceedances procedures of Part
75.
• Monitor system (CO2 and Flow Monitor) must have a monitor availability of 95% or better.o Missing Emission Data below the 95% availability
requirement shall be determined using procedures for Part 75 Appendix G for compliance.
23

Testing
• The Relative Accuracy Testing Audit (RATA) under Part 75 is still required to be conducted.
• When making fuel supplier changes, LVP will have to conduct testing to determine the Coal Adjustment Factor to adjust the bin limits to account for the changes in the quality of the coal from supplier/source changes.
24

Recordkeeping
• LVP will be required to maintain records of the data used to determine the weighted average for compliance data needed to determine the CO2
emission rate each compliance period (e.g. net generation, hours operated in each load bin, unbiased flue gas flowrate, and CO2
concentration).
25

Reporting
• At the end of each compliance period, LVP will be required to submit a compliance demonstration.
• Any time there is an event that causes impaired operations, bimonthly repair progress, root cause analysis reports.
• Any time the fuel supplier changes.
26

Public Comment Period
• Public Meeting was held on Tuesday, October 27.
o 21 oral comments were taken for the record. 66 individuals registered for the meeting.
• Comment period ended on Monday, November 9.
o 10 written comment were received.
27

Summary
• LVP is voluntarily seeking a proposed CO2 Standard for their existing coal fired EGU.
• No physical changes to the facility were proposed as part of this action.
• The standard is using a weighted average with 5 bin limits covering the normal operating range of the unit.
• Startup/Shutdowns have a separate standard.
• Bin limits were developed taking hourly emission data and converting it into monthly rates with respect to load bin. Using the monthly rates, the average and standard deviation was taken from a 12-month rolling average.
28

Resources
• Field Audit Checklist Tool (FACT)
• Field Audit Checklist Tool (FACT) | Clean Air Markets | US EPA
• EIA-923 Form Data
• Form EIA-923 detailed data with previous form data (EIA-906/920)
• National Electric Energy Data System (NEEDS)
• National Electric Energy Data System (NEEDS) v6 | Clean Air Markets | US EPA
• Guidance on Implementing the Affordable Clean Energy Rule: Engineering, Operations and Compliance Considerations
• GuidanceonImplementingtheAffordableCleanEnergyRule.pdf (cooperative.com)
• Regulatory Impact Analysis for the Repeal of the Clean Power Plan, and the Emission Guidelines for Greenhouse Gas Emissions from Existing Electric Utility Generating Units
• Regulatory Impact Analysis for the Repeal of the Clean Power Plan, and the Emission Guidelines for Greenhouse Gas Emissions from Existing Electric Utility Generating Units (epa.gov)
29

Lessons Learned
• Develop a team.
• Be ready to handle large data sets (hardware/ software/trained personnel).
• Work concurrently.
• Establish a good relationship with the source.
• Get EPA involved early with your process.
• Look at other sources/units.
• Develop justification as you go forward on everything.
• Upper Management/Legal needs to advise and support the staff.
30

Information
Application R13-3495
https://dep.wv.gov/daq/permitting/Pages/NSR-Permit-Applications.aspx
Edward Andrews, P.E.304 926 0499, ext. 41244
31


