48
i Western Cape Government: Department of Human Settlements A Human Settlement Demand Study in the Western Cape Housing market segment report Final 25 March 2015
i
Western Cape Government: Department of Human Settlements
A Human Settlement Demand Study in the Western Cape
Housing market segment report
Final
25 March 2015

ii
Contact Details
Contact Nick Graham, Meagan Jooste & Kevin Foster
Postal address PO Box 46830, Glosderry, 7702
Physical address Ubunye House, 1st floor, 70 Rosmead Avenue, Kenilworth, Cape Town, 7708
Telephone (021) 671 1402
Facsimile (021) 671 1409
E-mail [email protected] ; [email protected] ; [email protected]

Contents
1 Introduction ..................................................................................... 1
2 Supply dynamics ............................................................................... 2
2.1 State housing assistance through capital subsidies ........................ 2
2.2 Housing stock for middle and low income households ..................... 4
3 Demand dynamics ............................................................................ 9
3.1 Quantum of demand: who needs a house? ................................... 9
3.1.1 Housing adequacy 9
3.2 Profile of demand: who needs what product? ............................... 13
3.2.1 Affordability/access to finance 13
3.2.2 Tenure preference 16
3.3 Changes in demand over time .................................................... 21
4 Housing Market Segments .............................................................. 24
4.1 Income ................................................................................... 25
4.1.1 Income bands that define the gap market 25
4.1.2 Income groups targeted by housing programmes 27
4.2 Tenure .................................................................................... 29
4.3 Differentiation within the market segments .................................. 31
4.3.1 Employment 31
4.3.2 Age 32
4.3.3 Qualification criteria for state assistance 34
5 A consolidated view of Housing Market Segments in the Western
Cape ............................................................................................... 36
References................................................................................................ 41

List of Tables
Table 1: Assumptions to inform the theoretical value of an affordable housing
product ....................................................................................................... 14
Table 2: Housing programmes by tenure status and income group ..................... 30
List of Figures
Figure 1: Provincial percentage of households receiving housing subsidies ............ 3
Figure 2: Number of houses built and sites serviced in the Western Cape between
2009 and 2014 .............................................................................................. 3
Figure 3: Number of houses built and sites serviced in the Western Cape
municipalities (excluding the City of Cape Town) between 2009 and 2014 ....... 4
Figure 4: Affordable suburbs by property value in the City of Cape Town .............. 6
Figure 5: Affordable suburbs by affordability ratio in the City of Cape Town .......... 7
Figure 6: Housing shortage/surplus by monthly income band in the City of Cape
Town (2011) ................................................................................................. 8
Figure 7: Factors influencing perceptions of property sales activities in the Western
Cape in early 2015 ........................................................................................ 9
Figure 8: Housing profile of households in South Africa and the Western Cape
(2011) ........................................................................................................ 10
Figure 9: Split of Western Cape households by monthly income band and dwelling
type (2011) ................................................................................................. 11
Figure 10: Split of inadequate housing situations in the Western Cape by monthly
income band and dwelling type (2011) ............................................................ 12
Figure 11: Percentage of households who deem their ‘RDP’ or state-subsidised
house to have weak or very weak walls and/or roof by province, 2013 ................ 12
Figure 12: Theoretical property affordability ..................................................... 14
Figure 13: Limits to the South African housing finance framework ...................... 15
Figure 14: Tenure status by income group across all households in the Western
Cape (2011) ................................................................................................ 17
Figure 15: Tenure status by inadequately housed income group in the Western
Cape (2011) ................................................................................................ 18
Figure 16: Tenure by dwelling type ................................................................. 19
Figure 17: Percentage growth in rental price bands in South Africa in 2014 ......... 20
Figure 18: Percentage growth in provincial rental price bands in South Africa in
2014 ........................................................................................................... 20
Figure 19: Household size distribution across Western Cape Municipalities ........... 22
Figure 20: Regional Gross Domestic Product growth per capita (2001 versus 2011)
.................................................................................................................. 24
Figure 21: Gini coefficients per district (2001 versus 2011) ................................ 24
Figure 22: Percentage of households granted bonds, by income group (2007-2014)
at constant 2012 prices ................................................................................. 26
Figure 23: Head of household employment status by dwelling type in the Western
Cape (2011) ................................................................................................ 31

Figure 24: Head of household employment status by location in the Western Cape
(2011) ........................................................................................................ 32
Figure 25: Dwelling type by age group of household head in South Africa and the
Western Cape (2011) .................................................................................... 33
Figure 26: Western Cape population pyramid projection .................................... 34
Figure 27: Housing market segments of the Western Cape ................................ 39

Western Cape Human Settlement Demand Study – Housing Market Segment Analysis
1
1 Introduction
Background
This housing market segment analysis report was compiled as the third deliverable
for the Western Cape Human Settlement Demand Study. Building on evidence
gathered through literature and available statistics, this report presents an analysis
of the housing market in South Africa and more specifically, the Western Cape. The
main purpose of this analysis is to propose a rational list of housing sub-markets
which takes cognisance of the income, tenure and qualification dimensions to these
sub-markets.
At the project’s scoping phase Steering Committee meeting, the team consulted the
Western Cape Government: Department of Human Settlements (WCG: DHS) on the
tentatively identified housing market sub-markets. These helped to frame and
articulate the sub-markets which the team then reshaped based on a review of
existing literature and data on these sub-markets as well as engagements with
sector experts.
Scope of the report
Much has been made of the ‘gap housing market’, but this is often a coarse
understanding of those earning too much to qualify for a subsidy, but not enough to
afford a bond. However, the demand is far more nuanced than this: it needs to
address other dimensions of affordability, desirability of different housing products
in specific locations, and whether these people would prefer to own or rent. Non-
qualifiers for housing subsidies also need to be factored in as a distinct market
segment. The market segmentation reviews the whole housing market including its
lower segments, the gap market and the higher income groups.
While the broader Western Cape Human Settlement Demand Study is intended as a
review of human settlements in the Western Cape, this phase of the study (and this
report) are only meant to analyse the housing markets in the province. In the next
phase of the study, a complete human settlements demand profiling exercise will
be done to capture the status of all the components of human settlements in the
province and its municipalities, thereby providing a more detailed picture of housing
demand in each municipality than is presented here.
Market segment framework
The definition of a ‘market’ is a place where the forces of supply and demand
interact. There are a number of dynamics at play on the supply- and demand-side
of the housing market in South Africa and the following two sections discuss these
dynamics in the current context of the Western Cape. Section 4 then uses these
dynamics as informants to define the different market segments, which are
consolidated into a framework for market segment analysis in the concluding
section.

Western Cape Human Settlement Demand Study – Housing Market Segment Analysis
2
2 Supply dynamics
2.1 State housing assistance through capital subsidies
One of the key commitments laid out by South Africa’s first democratic government
in 1994 was a promise to ensure housing access which was constitutionally
mandated in terms of Section 26 of the Constitution. Over time, the housing sector
has evolved to comprise a combination of open market forces, private sector firms,
government policies, financing and facilitative interventions, as well as inputs and
investments by the households (Financial and Fiscal Commission (FFC), 2013).
The South African government housing assistance takes the form of a capital
subsidy driven programme that is differentiated into different housing programmes.
Middle and higher income households tend to have their housing needs met
through the private sector. However the supply of housing stock to the low income
market has been dominated by the units delivered through the State housing
programmes.
In terms of housing delivery, the General Household Survey (2013) evidenced that
the change in the percentage of households that received housing subsidies in the
Western Cape was 10.7% between 2002 and 2013. This is surpassed only by the
Free State province where this figure was 17.1% (Figure 1). In aggregate, as
Figure 2 shows, the total number of houses built between 2009 and 2014 in the
Western Cape amounted to 64 489 (including those which were built through the
Individual Subsidy and other State Housing Programme) (Figure 2). The number of
sites serviced during this time amounted to 42 936 units. Viewed at a municipal
level as in Figure 3, it is notable that all municipalities have built homes and
serviced sites during this time period. The reason for the relatively smaller number
of homes built and sites serviced in Laingsburg seems to have to do with the rollout
of such delivery only setting in in late 2013. Note that this figure excludes the City
of Cape Town only because it distorts the comparability of the municipalities. The
City built 34 881 during this period and serviced 16 614 sites.

Western Cape Human Settlement Demand Study – Housing Market Segment Analysis
3
Figure 1: Provincial percentage of households receiving housing subsidies
Source: Statistics South Africa, General Household Survey, 2013
Figure 2: Number of houses built and sites serviced in the Western Cape between 2009 and 2014
Source: Western Cape Government: Department of Human Settlements, 2015
-
5 000
10 000
15 000
20 000
25 000
30 000
2009/10 2010/11 2011/12 2012/13 2013/14
Houses built
Sites serviced
Western Cape Human Settlement Demand Study – Housing Market Segment Analysis
4
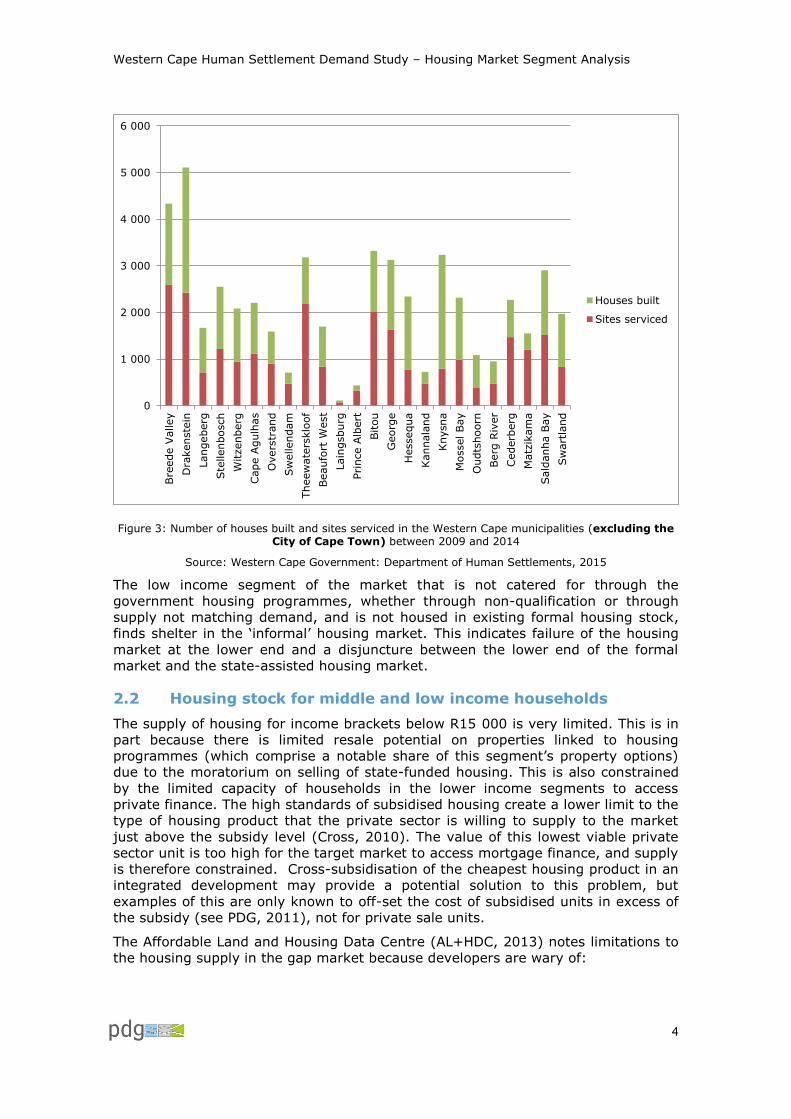
Figure 3: Number of houses built and sites serviced in the Western Cape municipalities (excluding the City of Cape Town) between 2009 and 2014
Source: Western Cape Government: Department of Human Settlements, 2015
The low income segment of the market that is not catered for through the
government housing programmes, whether through non-qualification or through
supply not matching demand, and is not housed in existing formal housing stock,
finds shelter in the ‘informal’ housing market. This indicates failure of the housing
market at the lower end and a disjuncture between the lower end of the formal
market and the state-assisted housing market.
2.2 Housing stock for middle and low income households
The supply of housing for income brackets below R15 000 is very limited. This is in
part because there is limited resale potential on properties linked to housing
programmes (which comprise a notable share of this segment’s property options)
due to the moratorium on selling of state-funded housing. This is also constrained
by the limited capacity of households in the lower income segments to access
private finance. The high standards of subsidised housing create a lower limit to the
type of housing product that the private sector is willing to supply to the market
just above the subsidy level (Cross, 2010). The value of this lowest viable private
sector unit is too high for the target market to access mortgage finance, and supply
is therefore constrained. Cross-subsidisation of the cheapest housing product in an
integrated development may provide a potential solution to this problem, but
examples of this are only known to off-set the cost of subsidised units in excess of
the subsidy (see PDG, 2011), not for private sale units.
The Affordable Land and Housing Data Centre (AL+HDC, 2013) notes limitations to
the housing supply in the gap market because developers are wary of:
0
1 000
2 000
3 000
4 000
5 000
6 000
Bre
ede V
alley
Dra
kenste
in
Langeberg
Ste
llenbosch
Witzenberg
Cape A
gulh
as
Overs
trand
Sw
ellendam
Theew
ate
rsklo
of
Beaufo
rt W
est
Lain
gsburg
Pri
nce A
lbert
Bitou
Georg
e
Hessequa
Kannala
nd
Knysna
Mossel Bay
Oudts
hoorn
Berg
Riv
er
Cederb
erg
Matz
ikam
a
Sald
anha B
ay
Sw
art
land
Houses built
Sites serviced

Western Cape Human Settlement Demand Study – Housing Market Segment Analysis
5
Market distortions caused by state subsidies which crowds out affordable
housing;
Administrative and procedural delays which undermine the margin;
Failed housing developments which undermine enthusiasm: affordability
ceiling narrows the space for success and demands greater market
precision; and,
Lack of credit for low income earners depresses effective demand.
While there is limited new housing stock being provided to the gap market for the
reasons provided above, there is also introduction of secondary stock through
houses in the gap market buying up stock occupied by lower income groups – so-
called ‘downward raiding’. While much evidence of downward raiding is anecdotal,
the increase in the value of Breaking New Ground (BNG) houses suggests that
these are being sold on to households with higher incomes (Lemanski, 2014).
Rising prices expose poorer houses to displacement through down-market raiding
(Cross, 2010). The moratorium placed on the sale of subsidised housing for eight
years was intended to prevent downward raiding. This will have less impact over
time as the restriction expires on the significant amount of units delivered in the
last five years, meaning that the shortage of housing stock may shift from the gap
to the subsidised market over time.
Information available to low income market segments about the availability of
cheaper housing stock on the market is also a barrier to entry. Information
channels to poor households are weak which inhibits their capacity to access such
housing (McGaffin, 2011). In spite of these challenges, some research suggests
the formal housing market is starting to work better. There is increased bank
finance for historically disadvantaged households as well as rising property prices
(ibid).
Evidence of affordability in the City of Cape Town1
To profile the affordability of housing, the Centre for Affordable Housing Finance in
Africa (CAHFA) and the South African Cities Network (SACN) (2014) developed an
affordability gap indicator. Given the average household in the City of Cape Town
earns R13 164/month the CAHFA and SACN (2014) suggest such a household can
afford a home to the value of R336 000. However, in the metro the average sales
price of a property is just over R1 million presenting an affordability gap. As Figure
4 shows, a notable share of properties in the City are valued above R500 000
(shown by the red bubbles) compared to a fairly smaller pool of more affordable
properties (i.e. between R250 000 and R500 000).
1 Data on affordability for other municipalities in the Western Cape was not available at the time of the study.

Western Cape Human Settlement Demand Study – Housing Market Segment Analysis
6
Figure 4: Affordable suburbs by property value in the City of Cape Town
Source: Centre for Affordable Housing Finance in Africa (CAHFA) and the South African Cities Network (SACN) (2014)
Illustrating affordability in terms of the affordability ratio (average house price
divided by average income), Figure 5 shows that there are a significant number of
areas in the metro which are less affordable (i.e. have a high affordability ratio).

Western Cape Human Settlement Demand Study – Housing Market Segment Analysis
7
Figure 5: Affordable suburbs by affordability ratio in the City of Cape Town
Source: Centre for Affordable Housing Finance in Africa (CAHFA) and the South African Cities Network (SACN) (2014)
Compared to the other metros in the country, the City of Cape Town has an
affordability ratio of 3.1 (meaning it takes on average 3.1 times the average
income to afford the average house). This, despite an above average sales price in
Cape Town, is below the national average across all the cities reviewed. This is due
to the higher income earning potential of households in Cape Town. However, when
considering affordability in terms of property value, it was found that only 44% of
properties in the metropolitan area can be classified as affordable. This is
substantially less than in the Manguang and Msunduzi metros which represented
ratios of 73% and 58% respectively. In effect, these affordability constraints affect
the availability of housing stock to households.
This finding was echoed by a study recently completed by the City of Cape Town on
the status of the Housing Market in the City which identified numerous shortages in
the stock of housing to households earning less than R12 800/month in 2011
(Figure 6). In contrast, for households earning in the upper end of the monthly
income spectrum, the housing stock appears more readily available.

Western Cape Human Settlement Demand Study – Housing Market Segment Analysis
8
Figure 6: Housing shortage/surplus by monthly income band in the City of Cape Town (2011)
Source: Hogarth (2015)
House price index in the Western Cape
The First National Bank (FNB) Western Cape House Price Index records that the
average house price of homes sold in the 4th quarter of 2014 was R1 273 303, with
an average house price inflation of 14.9% in the province in 2014 (the fastest rate
of the major provinces). FNB suggest that this house price inflation has inevitably
contributed to the deterioration in affordability of housing in the province.
Reflecting on the historical house price index in the province shows that in real
terms, the house price index in the 4th quarter of 2014 was 12% higher than that in
the 4th quarter of 2004. An estate agent survey conducted by FNB showed that
there are a number of factors determining property sales activities in the Western
Cape (Figure 7). These include, but are not limited to a shortage of housing stock
(29%), seasonality (64%) as well as investor/purchaser confidence (‘consumer
positive sentiment’, ‘economic stress/general pessimism, etc.).

Western Cape Human Settlement Demand Study – Housing Market Segment Analysis
9
Figure 7: Factors influencing perceptions of property sales activities in the Western Cape in early 2015
Source: First National Bank, 2015
3 Demand dynamics
Demand in the context of housing segments can be understood both in terms of the
quantum or magnitude of need as well as the profile of this need, i.e. the type of
housing product demanded.
3.1 Quantum of demand: who needs a house?
3.1.1 Housing adequacy
All households in the province are housed in some form of shelter. This shelter may
or may not be considered ‘adequate’. The City of Cape Town, in its Integrated
Human Settlement Framework demand modelling (2014), used the definition of
‘inadequate’ to include households in informal settlements, households in informal
backyard shacks, and overcrowded households2. This definition is consistent with
that used by Gardner (2015). In addition to inadequacy, some adequately housed
households may aspire to another type or location of housing, as their current
housing is ‘undesirable’. This type of demand, for one formal, or adequate, housing
type is what drives movement up the conventional housing ladder, discussed later
in this report.
While significant progress has been made in housing delivery since 1994, there are
still challenges to providing universal access to adequate housing. While the
number of households living in brick or concrete houses, as a percentage of all
types of main dwellings in South Africa, increased from 48% to 65%, there were
200 000 more households were living in informal dwellings in 2011 than in 1996
(FFC, 2013: 12). As Figure 8 shows, the Western Cape housing profile mirrored the
2 Defined as households with more than 2 people per room, which roughly equates to the U.S. Department of Housing and Urban Development (2007) definition of overcrowding as 2.5 people per habitable room. In this definition, traditional dwellings and other dwelling types (caravans, tents and other) are classified as adequate. There dwelling types form a very small proportion of the total in the Western Cape.

Western Cape Human Settlement Demand Study – Housing Market Segment Analysis
10
national housing profile in 2011 closely with the exception of slightly higher shares
of households living in informal dwellings other than in backyards, blocks of flats
and townhouse dwellings.
Figure 8: Housing profile of households in South Africa and the Western Cape (2011)
Source: Financial and Fiscal Commission, 2013 and Statistics South Africa, 2011
Figure 9 shows the split of dwelling types occupied by households in the various
monthly income bands for Western Cape households in 2011. It particularly
illustrates the relationship between lower income bands and housing deprivation
and it shows the impact of state housing programmes through the maintenance of
the majority of households in formal housing even in the lowest income bands.
62%
12%
0%
8%
16%
6%
1%
1%
1%
65%
9%
8%
5%
4%
5%
3%
1%
1%
0% 10% 20% 30% 40% 50% 60% 70%
House or concrete structure on aseparate stand
Informal dwelling/elsewhere
Traditional dwelling
Flat in a block of flats
Townhouse/cluster/semi-detached house
Informal dwelling (shack; in backyard)
House/flat/room in backyard
Room/flatlet on a shared property
Other
% of SA
% of WC

Western Cape Human Settlement Demand Study – Housing Market Segment Analysis
11
Figure 9: Split of Western Cape households by monthly income band and dwelling type (2011)
Source: Own analysis using Census 2011
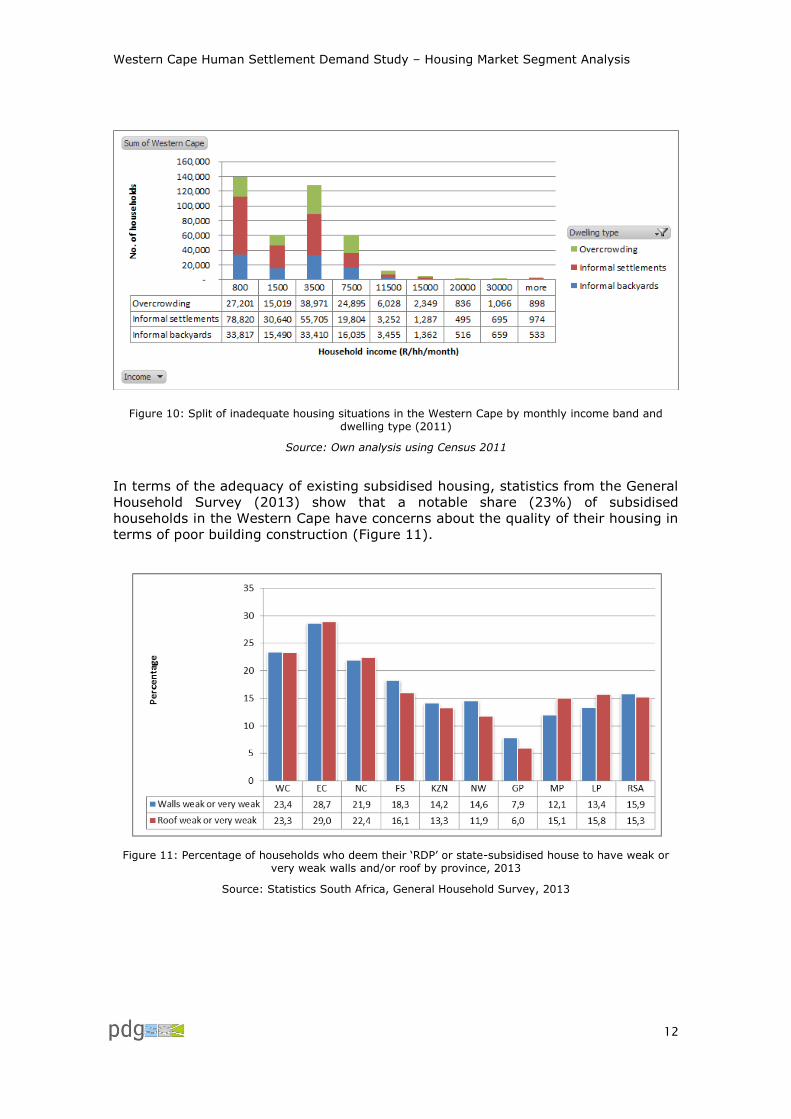
In Figure 10 the definition of ‘inadequate’ has been used to illustrate the extent of
the ‘backlog’ that exists in each of the income categories3, clearly showing a
concentration at the lower levels with informal settlements housing the greatest
portion of the demand in the lowest income brackets, but with a fairly even split
between informal settlements, informal backyard dwelling and overcrowding in the
R1 500 - R3 500 income group. The total extent of the ‘backlog’ when calculated in
this manner, for all income groups, is 414 212 households (for 2011).
3 Income brackets have been revised using a linear interpolation according to the proposed divisions of the market segments in the conclusion of this report.
Western Cape Human Settlement Demand Study – Housing Market Segment Analysis
12
Figure 10: Split of inadequate housing situations in the Western Cape by monthly income band and dwelling type (2011)
Source: Own analysis using Census 2011
In terms of the adequacy of existing subsidised housing, statistics from the General
Household Survey (2013) show that a notable share (23%) of subsidised
households in the Western Cape have concerns about the quality of their housing in
terms of poor building construction (Figure 11).
Figure 11: Percentage of households who deem their ‘RDP’ or state-subsidised house to have weak or very weak walls and/or roof by province, 2013
Source: Statistics South Africa, General Household Survey, 2013
Western Cape Human Settlement Demand Study – Housing Market Segment Analysis
13
3.2 Profile of demand: who needs what product?
The housing demand profile is understood to be related to: i. the affordability of a
household (i.e. its income level and thus eligibility for housing finance), and ii. a
household’s preferred tenure status (i.e. owning versus renting).
3.2.1 Affordability/access to finance
A household’s ability to demand a level of housing in the formal housing market
and to move through the housing ladder is dependent on its ability to pay for it.
The housing finance options available to households are thus primarily a function of
their monthly income.
In general, state housing finance caters for the lower end of household income
groups (earning between R0-R15 000/month) whereas the private sector tends to
cater for those in the upper end (earning above R15 000/month). Evidence from
the Financial and Fiscal Commission suggests that a household’s capacity to move
up the housing ladder is a direct function of its ability to access credit. In general,
households earning under R3 500/month find it hard to access credit and therefore
very difficult to move up the housing ladder (FFC, 2013: 38). It is for this reason
that such households are highly dependent on state-funded programmes to move
into the formal housing sector. Households earning below R3 500/month who
cannot access the bond market and are not served by a government housing
programme operate in the informal housing market. Property sales under R50 000,
which might occur in this income range, tend to be informal (Cross, 2010). Those
who cannot access the bond market are likely to either take part in a land invasion
or join a waiting list for a subsidy (McGaffin, 2011). It is also possible that such
households’ access unsecured loans as the FFC reports. However, waiting for a
subsidy is both a time consuming process and may move the household away from
a geographical area that meets its needs.
Of all South African households in the R3 500 to R7 000 monthly income bracket,
50% have access to some kind of formal credit but, only 3.4% have bonds (ibid).
Households in the R7 000 to R15 000 monthly income bracket, have better, but still
not complete, access to the bond market, particularly at the upper end of this
income bracket. This bracket is also supported by the Finance Linked Individual
Subsidy Programme (FLISP) subsidy in accessing credit.
For households earning above R15 000/month, much of the housing finance needs
are met by private sector banking institutions but even with this relatively high
income, households need to meet other criteria to be eligible for finance. Private
sector lending institutions are required to comply with the National Credit Act of
South Africa which necessitates they assess an applicant’s full credit situation as
well as ensuring applicants have declared all debt. Generally, banks are not
permitted to lend to households whose total bond repayments exceed 30% of their
proven income. Altogether, the Act seeks to avoid households overextending
themselves with debt.
The City of Cape Town has recently undertaken housing market analysis that uses
the following assumptions to calculate the theoretical value of the housing product
that is affordable to households based on their income as shown in Table 1
(Hogarth, 2015:8).

Western Cape Human Settlement Demand Study – Housing Market Segment Analysis
14
Table 1: Assumptions to inform the theoretical value of an affordable housing product
Indicator Assumed value
% of household income (on loan payments) 25%
Annual interest rate 10%
Home loan period (years) 20
Loan to Value (LTV) 90%
Source: Hogarth (2015)
Based on these assumptions, the theoretical affordability curve (ignoring ability to
access credit) is presented in Figure 12.
Figure 12: Theoretical property affordability
Source: Hogarth (2015)
Characterising the gap market
Rust (2012) defines the ‘gap’ or affordable housing market in South Africa as
represented by those households falling within the R3 500 and R15 000 income
groups. Households within this segment are generally eligible for the FLISP (about
15% of this segment’s population). Households earning below R15 000 monthly are
in part accessing private-finance through the bonded market, but this is on a
smaller scale than those earning above R15 000 (FFC, 2013). Because this market
relies on supplementing existing credit and approximately two thirds of these
households are unlikely to be able to access credit, they are therefore not able to
access the subsidy. This creates a ‘lower gap’ market. In the new FLISP there is
mention of the provision of serviced sites available to these households, who fail to
R 0
R 200,000
R 400,000
R 600,000
R 800,000
R 1,000,000
R 1,200,000
R 1,400,000
R 1,600,000
R 0
R 5
,00
0
R 1
0,0
00
R 1
5,0
00
R 2
0,0
00
R 2
5,0
00
R 3
0,0
00
R 3
5,0
00
R 4
0,0
00
R 4
5,0
00
R 5
0,0
00
Pro
pe
rty
valu
e a
ffo
rdab
le
Monthly household income
Theoretical property affordability

Western Cape Human Settlement Demand Study – Housing Market Segment Analysis
15
qualify for a bond, under the Integrated Residential Development Programme
(IRDP).
The Affordable Land & Housing Data Centre (AL+HDC) (2013) recognises the ‘gap’
market as those households who cannot easily access affordable housing. The gap
market is defined by limits to the affordability of loans granted to households in
different income groups and limits to the supply of affordable units that are
demanded by this income band (Figure 13).
Figure 13: Limits to the South African housing finance framework
Source: Centre for Affordable Housing Finance in Africa (2012)
Households in the gap market are heavily indebted, not only by mortgage debt. The
FFC (2013: 20) notes that:
“Low-income groups account for a significant proportion of total unsecured
lending (NCR, 2012), accounting for 60 per cent of the value of unsecured
credit in 2007, declining to 40 per cent in 2012. However, the extent to
which low-income households, especially those not eligible for fully
subsidised houses, use unsecured lending to contribute to their housing
needs is unclear.”
Defaulting is therefore high. The Financial Sector Charter originated loans between
January 2004 and December 2008 to households with a monthly income of between
R1 500 and R7 500 (in 2004). The FSC faces notable arrears (with arrears of 90
days or more) on loans undertaken through this facility (AL+HDC, 2013). Further to
this, the AL+HDC (2013) shows that potential private-sector investors in the gap
market are wary for a number of reasons including:
New markets are without track records meaning there’s an increasing sense
of risk associated with them;

Western Cape Human Settlement Demand Study – Housing Market Segment Analysis
16
Gap market households have different credit and financial management
patterns than the typical bonded household segment; and,
Market shifts elevate the risk of loan default.
There are however also significant opportunities being revealed by the gap market.
Financial Sector Charter (FSC) loans in the affordable market performed on par if
not better, than that of the higher end market (Affordable Land & Housing Data
Centre, 2013). This study by the AL+HDC (2013) also showed that 8% of FSC and
8.4% of non-FSC mortgages were in arrears in February 2012, indicating that
defaulting in the lower markets was lower than in the higher markets. Further to
this, mid-range loans (R100 000 – R200 000) tend to perform better than very high
or very low sized loans. At the end of 2014, Lightstone Property reported that the
low end affordable sector was a ‘winner’ in the housing market as most mortgage
lenders and estate agents are trying to penetrate this market (Lightstone Property,
2015).
While access to credit is fundamental to supporting a household’s movement
through the housing ladder, research suggests that increased credit increases
effective demand, which, without a requisite increase in supply, will simply increase
prices (FFC, 2013). Cross subsidisation in integrated developments can also
increase prices particularly in the medium income market (PDG, 2011).
The transaction costs of buying property, such as conveyancing and transfer duties,
are also disproportionately high for low income households relative to high income
households, at 27% for property costing R20 000 and 8% for property costing R5
million (Downing (2011) in McGaffin (2011)). In his recent budget speech however,
the Minister of Finance has begun to address this issue by promising to eliminate
transfer duties on properties below R750 000.
3.2.2 Tenure preference
While secure tenure is considered necessary for housing ‘adequacy’, the type of
tenure (ownership or rental) is an aspect of housing ‘desirability’ and therefore is
another dimension of housing demand. Outcome 8, which is one of 12 National
Outcomes of the Presidency’s National Outcomes Approach dealing with ‘sustainable
human settlements with an improved quality of household life’ recognises tenure as
a range of options for secure tenure including permission to occupy, recognition
through town planning scheme or by-law as well as traditional forms of secure
tenure, such as lease holding or the transfer of title deeds. The latter of these,
through the housing programmes, has been the standard means of the provision of
tenure in South Africa.
Tenure indicates the distribution of physical assets and can be understood in two
main ways. The first being that tenure relates to the legal ownership rights
attached to a property. In South Africa, securing such tenure is a long and complex
process. The second core form of tenure is as relates to tenure security which does
not equate to ownership but rather reflects on how tenure security in informal
settlements can develop through numerous factors (such as administrative
recognition or local community witnessing) and situations (Urban LandMark, 2010).
Data on tenure status is limited to formal tenure in terms of ownership or rental, as
recorded by the Census, which includes an indication of whether houses are bonded
or not. Figure 14 shows tenure across the different income groups the Census
measures. It is noticeable that a greater share of higher income households
(earning above R12 800 a month), own (fully paid or being paid off) as compared

Western Cape Human Settlement Demand Study – Housing Market Segment Analysis
17
to those below this threshold. The rapid increase in households in houses owned
but not yet paid off between R6 400-R12 800 a month indicates that this is the
income bracket at which housing finance becomes available. There is a consistent
share of low income households owning property which could possibly be a result of
inheritance or state housing provision.
Rent-free occupation is a significant part of the lower income markets, and only a
very small percentage of the higher income markets. Evidence from the Western
Cape Government: Department of Human Settlements (WCG: DHS) shows that of
households residing on farms, 57% of households earning between R1 –
R38 200/annum classify themselves as residing in ‘rent-free’ accommodation
(WCG: DHS, 2013). Rental is greater than 20% across all income groups,
suggesting the decision to rent is often influenced by factors other than income.
Experience from the City of Cape Town’s analysis of the Census data indicates that
the Census data around tenure of informal dwelling types (back yards and informal
backyard shacks) is unreliable4. It is surmised that there is often uncertainty on the
part of the occupant of the shack as to whether they own the dwelling or the land
on which it is located. A household may have paid for the materials, but still pay
rental for their ‘space’ in the settlement and have no formal tenure.
Figure 14: Tenure status by income group across all households in the Western Cape (2011)
Source: Own analysis using Census 2011
On investigating tenure status by inadequately housed households (i.e. household
dwelling types including 'traditional dwelling', 'informal dwelling', informal dwelling
4 Karen Small, City of Cape Town Development Information and Geographic Information Systems Department, Personal Communication.
0%
10%
20%
30%
40%
50%
60%
70%
80%
90%
100%
Other
Owned but not
yet paid off
Owned and
fully paid off
Occupied rent-
free
Rented

Western Cape Human Settlement Demand Study – Housing Market Segment Analysis
18
(shack)'), as shown in Figure 15, it is evident that a fairly similar story can be told.
While the rental tenure again represents a notable feature of inadequately housed
households, ownership is an equally dominant feature across all income groups.
Figure 15: Tenure status by inadequately housed income group in the Western Cape (2011)
Source: Own analysis using Census 2011
The dynamic between income level, housing type and tenure type provides some
insights into the housing market. Firstly, it indicates where formal housing credit
starts to become available. Secondly, it indicates that a large portion of low income
households, particularly those inadequately housed, occupy their shelter rent free,
which indicates an inability to pay rent and a strong dependence on social networks
as a survival mechanism5. Thirdly, the impact of the State housing programme,
providing low income households (<R3 200 per month) with debt-free freehold title
of formal property is evident.
It is important to distinguish between what formal and informal rental
accommodation comprises as there is perhaps a fine line between these. Gardner
(2011) suggests that small-scale private rental units include formally constructed
units (houses, flats, or rooms) whereas informally constructed units would include
shacks in backyards and informal settlements. This study thus proposes using a
definition of formal rental being the rental of a legally-owned formal structure or
room and informal rental being the rental of illegal or informal structures. As shown
in Figure 16, observing household tenure choices by dwelling type provides
interesting insights as households predominantly reside in formal structures in the
5 As mentioned earlier, this grouping also includes farm worker households, 57% of who classify their dwelling type as ‘rent free’ accommodation.
0%
10%
20%
30%
40%
50%
60%
70%
80%
90%
100%
Other
Owned but
not yet paidoff
Owned and
fully paid off
Occupied
rent-free
Rented

Western Cape Human Settlement Demand Study – Housing Market Segment Analysis
19
province (at least 50% of households) relative to those residing in informal
structures.
Figure 16: Tenure by dwelling type
Source: Own analysis using Census 2011
In terms of tenure preferences in the formal sector, research by Eighty 20 (2008)
showed that with the changes to credit law, the global financial crisis and increasing
interest rates, the ability of households to finance home ownership was expected to
decline. With the South African economy shifting towards the construction and
transport sectors and thereby requiring more mobility from employees in
elementary occupations, it is foreseen that more flexible and affordable housing
solutions in the rental market will be needed. This is particularly the case given that
the growing market of employees in these sectors are young adults for whom rental
tenure is likely more suitable than ownership.
0%
10%
20%
30%
40%
50%
60%
70%
80%
90%
100%
Rented Owned but
not yet
paid off
Occupied
rent-free
Owned and
fully paid
off
Other
Other
Caravan/tent
Room/flatlet on a property or largerdwelling/servants quarters/granny flat
Informal dwelling (shack; not inbackyard; e.g. in an informal/squatter
settlement or on a farm)
Informal dwelling (shack; in
backyard)
House/flat/room in backyard
Semi-detached house
Townhouse (semi-detached house in acomplex)
Cluster house in complex
Flat or apartment in a block of flats
Traditional dwelling/hut/structuremade of traditional materials
House or brick/concrete blockstructure on a separate stand or yardor on a farm
Western Cape Human Settlement Demand Study – Housing Market Segment Analysis
20
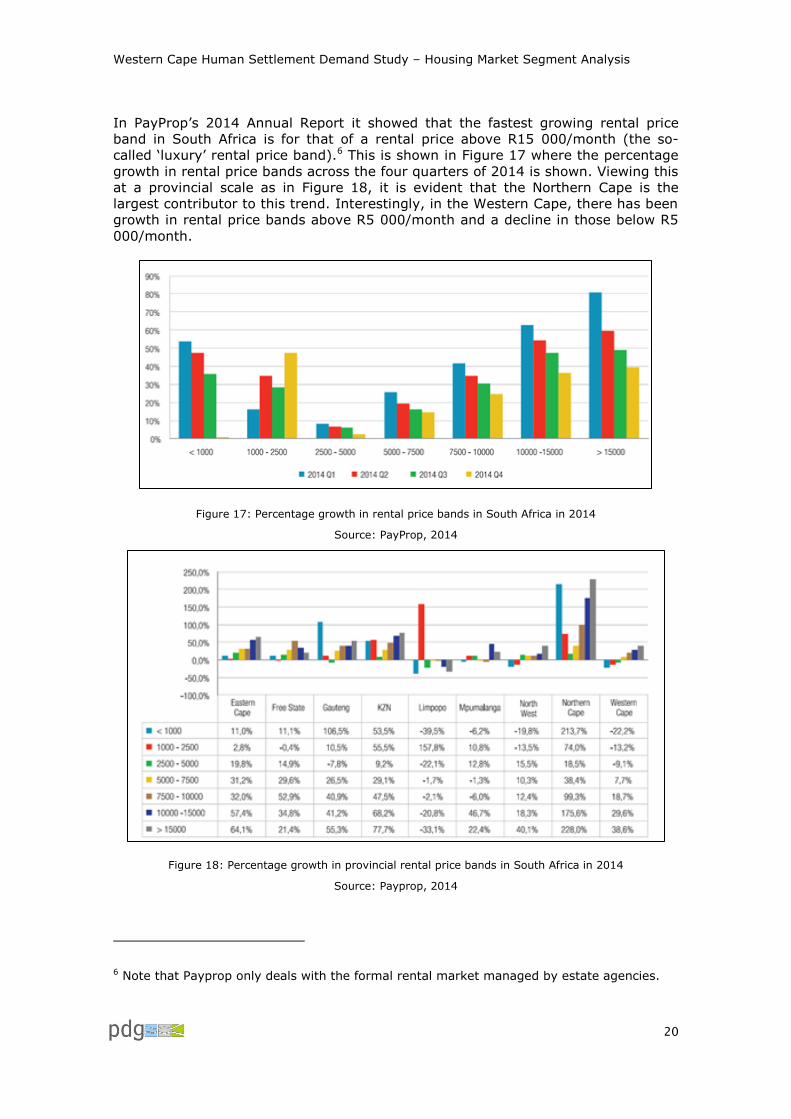
In PayProp’s 2014 Annual Report it showed that the fastest growing rental price
band in South Africa is for that of a rental price above R15 000/month (the so-
called ‘luxury’ rental price band).6 This is shown in Figure 17 where the percentage
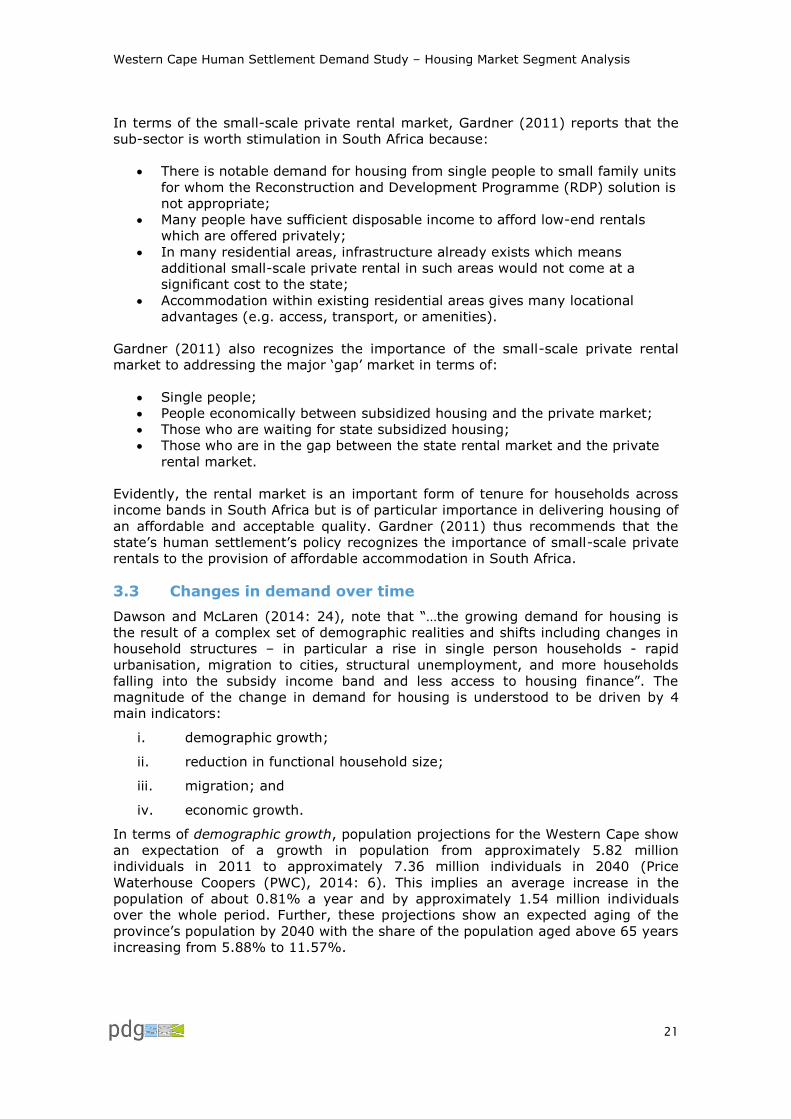
growth in rental price bands across the four quarters of 2014 is shown. Viewing this
at a provincial scale as in Figure 18, it is evident that the Northern Cape is the
largest contributor to this trend. Interestingly, in the Western Cape, there has been
growth in rental price bands above R5 000/month and a decline in those below R5
000/month.
Figure 17: Percentage growth in rental price bands in South Africa in 2014
Source: PayProp, 2014
Figure 18: Percentage growth in provincial rental price bands in South Africa in 2014
Source: Payprop, 2014
6 Note that Payprop only deals with the formal rental market managed by estate agencies.
Western Cape Human Settlement Demand Study – Housing Market Segment Analysis
21
In terms of the small-scale private rental market, Gardner (2011) reports that the
sub-sector is worth stimulation in South Africa because:
There is notable demand for housing from single people to small family units
for whom the Reconstruction and Development Programme (RDP) solution is
not appropriate;
Many people have sufficient disposable income to afford low-end rentals
which are offered privately;
In many residential areas, infrastructure already exists which means
additional small-scale private rental in such areas would not come at a
significant cost to the state;
Accommodation within existing residential areas gives many locational
advantages (e.g. access, transport, or amenities).
Gardner (2011) also recognizes the importance of the small-scale private rental
market to addressing the major ‘gap’ market in terms of:
Single people;
People economically between subsidized housing and the private market;
Those who are waiting for state subsidized housing;
Those who are in the gap between the state rental market and the private
rental market.
Evidently, the rental market is an important form of tenure for households across
income bands in South Africa but is of particular importance in delivering housing of
an affordable and acceptable quality. Gardner (2011) thus recommends that the
state’s human settlement’s policy recognizes the importance of small-scale private
rentals to the provision of affordable accommodation in South Africa.
3.3 Changes in demand over time
Dawson and McLaren (2014: 24), note that “…the growing demand for housing is
the result of a complex set of demographic realities and shifts including changes in
household structures – in particular a rise in single person households - rapid
urbanisation, migration to cities, structural unemployment, and more households
falling into the subsidy income band and less access to housing finance”. The
magnitude of the change in demand for housing is understood to be driven by 4
main indicators:
i. demographic growth;
ii. reduction in functional household size;
iii. migration; and
iv. economic growth.
In terms of demographic growth, population projections for the Western Cape show
an expectation of a growth in population from approximately 5.82 million
individuals in 2011 to approximately 7.36 million individuals in 2040 (Price
Waterhouse Coopers (PWC), 2014: 6). This implies an average increase in the
population of about 0.81% a year and by approximately 1.54 million individuals
over the whole period. Further, these projections show an expected aging of the
province’s population by 2040 with the share of the population aged above 65 years
increasing from 5.88% to 11.57%.
Western Cape Human Settlement Demand Study – Housing Market Segment Analysis
22
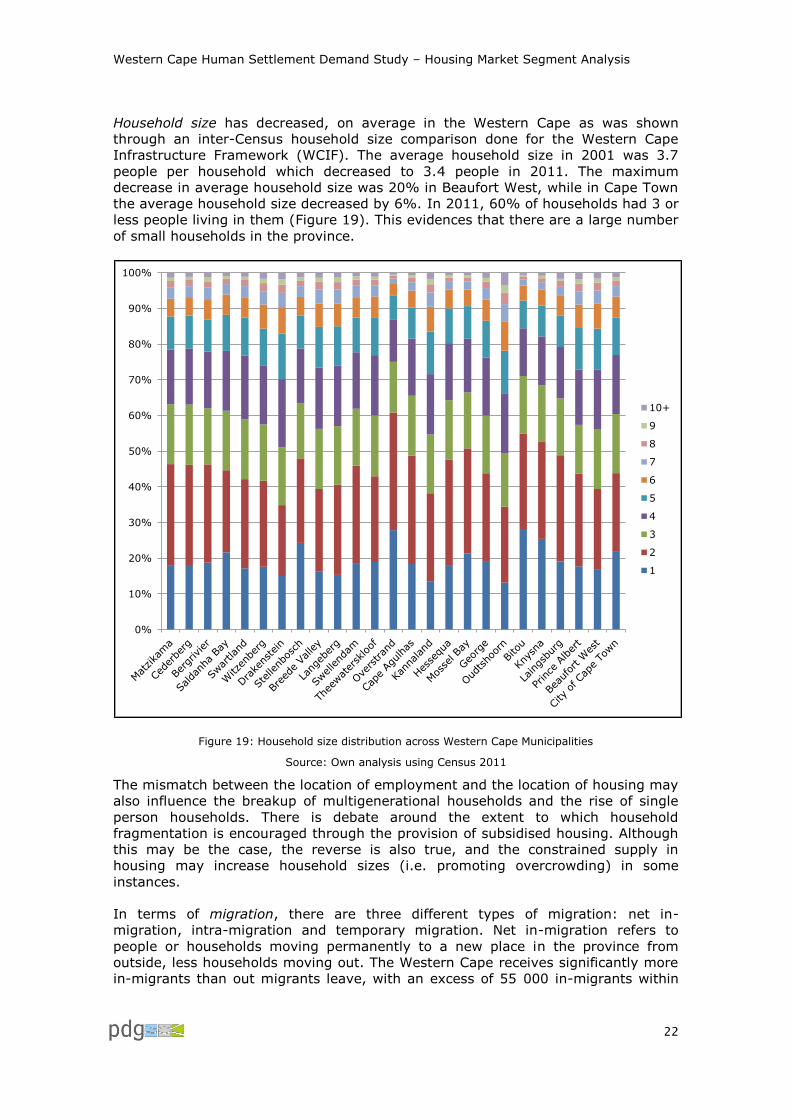
Household size has decreased, on average in the Western Cape as was shown
through an inter-Census household size comparison done for the Western Cape
Infrastructure Framework (WCIF). The average household size in 2001 was 3.7
people per household which decreased to 3.4 people in 2011. The maximum
decrease in average household size was 20% in Beaufort West, while in Cape Town
the average household size decreased by 6%. In 2011, 60% of households had 3 or
less people living in them (Figure 19). This evidences that there are a large number
of small households in the province.
Figure 19: Household size distribution across Western Cape Municipalities
Source: Own analysis using Census 2011
The mismatch between the location of employment and the location of housing may
also influence the breakup of multigenerational households and the rise of single
person households. There is debate around the extent to which household
fragmentation is encouraged through the provision of subsidised housing. Although
this may be the case, the reverse is also true, and the constrained supply in
housing may increase household sizes (i.e. promoting overcrowding) in some
instances.
In terms of migration, there are three different types of migration: net in-
migration, intra-migration and temporary migration. Net in-migration refers to
people or households moving permanently to a new place in the province from
outside, less households moving out. The Western Cape receives significantly more
in-migrants than out migrants leave, with an excess of 55 000 in-migrants within
0%
10%
20%
30%
40%
50%
60%
70%
80%
90%
100%
10+
9
8
7
6
5
4
3
2
1

Western Cape Human Settlement Demand Study – Housing Market Segment Analysis
23
2011 and less than 15 000 out-migrants resulting in a net in-migration of around
40 000 (Price Waterhouse Coopers (PWC), 2014). Both these numbers have
increased significantly since 2001, but in-migration at a far higher rate. The age
profile of migrants suggests that they are overwhelmingly between the ages of 15
and 39, and particularly between 20 and 30. This migration is mainly to urban
centres. Education and healthcare are also important drivers of migration to the
Western Cape (PWC, 2014), as well as high unemployment in neighbouring
provinces compared to the Western Cape.
Intra-migration refers to the permanent migration within the Western Cape.
According to PWC’s 2011-2040 Western Cape Population Projections there is a
migration trend from rural areas within the Western Cape into the City of Cape
Town Metropolitan Area.
Temporary migration, where migrants move into an area while retaining another
property elsewhere, adds another dynamic to the housing market. The primary
driver of temporary migration is employment seeking, with employment status and
the sufficiency of income to make a decent living in the future (in their place of
origin) determining their decision to return (Poswa and Levy, 2006). This, combined
with the evidence shown in Figure 24 in the following section suggests that
temporary migrants will most likely tend towards informal and central housing
opportunities, with some choosing to live in informal peripheral settlements or, if it
is affordable, in the formal and informal rental sectors.
Economic growth can also play a role in the income mobility of households, shifting
households upwards (or downwards in the case of economic contraction) between
income brackets. The 2014 Western Cape Provincial Economic Review Outlook
(PERO) showed that the provincial economy grew between 2001 and 2011 such
that population Regional Gross Domestic Product (GDPR) increased accordingly
from R37 496 in 2001 to R43 557 in 2011 (Figure 20).
This trend was observed across all districts with the exception of the West Coast
where this ratio remained constant. This measure does not provide an explicit
indication of household well-being but on review of the Gini coefficient in the
province over this same time, it was evident that income inequality declined from
0.63 to 0.58 in the Western Cape between 2001 and 2011 (Figure 21). This
downward trend was much the same across the province’s districts. Assuming this
improved income inequality was a result of enhanced economic activity in the
province, it potentially suggests an upward income mobility of households in the
province. The PERO 2014 also forecasts that GDPR will continue to expand in the
Western Cape with an average growth of 3% predicted between 2014 and 2019.

Western Cape Human Settlement Demand Study – Housing Market Segment Analysis
24
Figure 20: Regional Gross Domestic Product growth per capita (2001 versus 2011)
Source: Western Cape Provincial Treasury (2014: 122)
Figure 21: Gini coefficients per district (2001 versus 2011)
Source: Western Cape Provincial Treasury (2014: 124)
4 Housing Market Segments
The intersection of housing demand and supply defines the housing market. The
elements of supply and demand that have been discussed above can therefore be
used to define the housing market segments, and are discussed in this section in
relation to the data sources that are available for this purpose. The core dimensions
of the housing market segments are income (how a household’s income relates to

Western Cape Human Settlement Demand Study – Housing Market Segment Analysis
25
its affordability for different housing products) and tenure preference (what tenure
options are most suitable to serve a particular household’s needs). However, there
are 3 additional factors that can be used to further differentiate the market
segments:
Employment: Do households require permanent or flexible housing and
tenure arrangements to facilitate job seeking?
Age: What are the dwellings options opted for by households of different
age groups?
Qualification: What defines a household’s ability to access State housing
assistance?
Each of these dimensions is discussed below to characterise the market segments.
4.1 Income
4.1.1 Income bands that define the gap market
The two significant issues that define the gap market, and therefore define the gap
market ‘segment’ are the lower limit of prudent lending by banks (the ‘lending
limit’) and the lower limit of the value of a housing product that can be supplied by
the private sector, yet be sufficiently different to state-subsidised housing to
generate demand (the ‘supply limit’). While the supply limit is defined by a housing
product value, it is related through loan affordability to a corresponding income
level.
There is limited research which establishes the lending ceiling and floor which banks
impose on households in the gap market. This is possibly because the eligibility of
any household for a bond is dependent not only on income but on a combination of
household characteristics including: disposable income after expenses; a
household’s credit record; the ability it has to finance loan repayments (which
depends on the type of employment – permanent or temporary); as well as
demographic features which, based on historical trends, define a household’s risk
profile. It is thus a case by case analysis of a household’s bond eligibility.
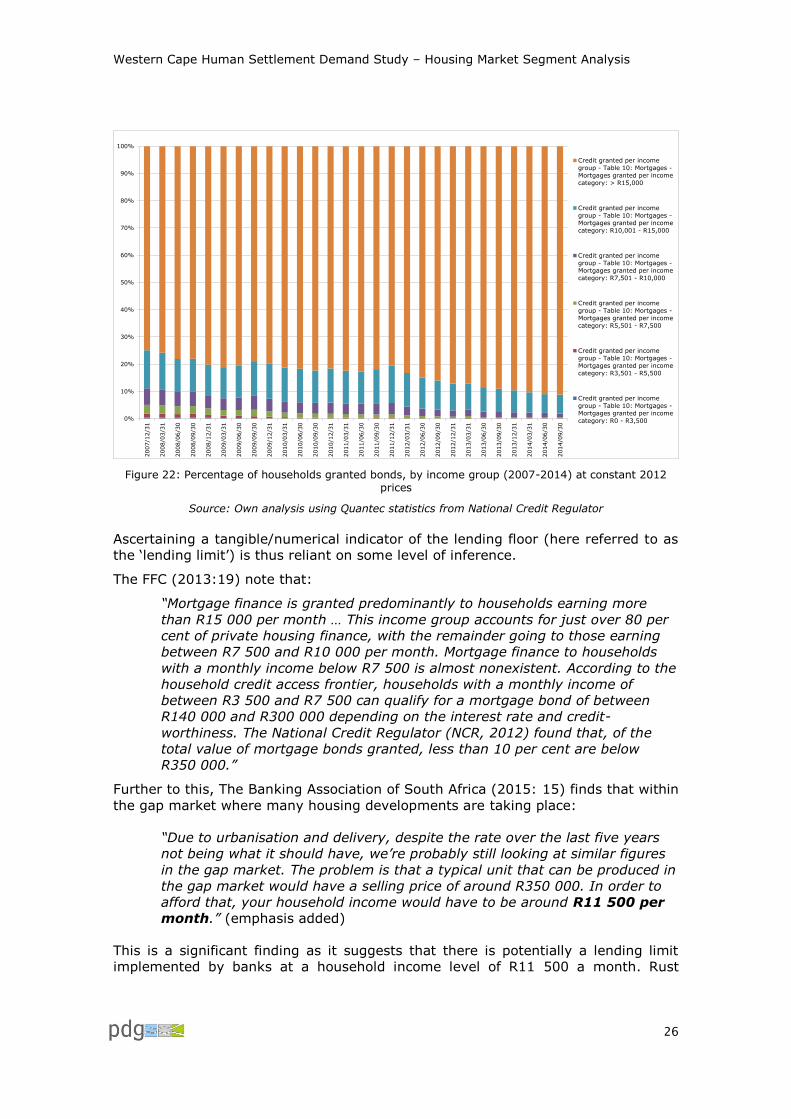
Statistics from the National Credit Regulator (Quantec, 2015) show a downturn in
the granting of bonds to household income groups below R15 000 in the Western
Cape. By the end of 2014, 91% of mortgages granted to households were granted
to households earning an income above R15 000/month (Figure 22).
This suggests more stringent eligibility criteria being imposed by banks and that
much of this seems to be driven by a household’s income earning potential. While
in 2007 there appeared to be relatively mixed allocation of bonds across all income
groups, by 2014, bond approval was granted predominantly to households earning
above R5 500/month. The use of real values (i.e. excluding inflationary
adjustments) for the income bands may explain part of the upward shift in the
lending patterns.
Western Cape Human Settlement Demand Study – Housing Market Segment Analysis
26
Figure 22: Percentage of households granted bonds, by income group (2007-2014) at constant 2012 prices
Source: Own analysis using Quantec statistics from National Credit Regulator
Ascertaining a tangible/numerical indicator of the lending floor (here referred to as
the ‘lending limit’) is thus reliant on some level of inference.
The FFC (2013:19) note that:
“Mortgage finance is granted predominantly to households earning more
than R15 000 per month … This income group accounts for just over 80 per
cent of private housing finance, with the remainder going to those earning
between R7 500 and R10 000 per month. Mortgage finance to households
with a monthly income below R7 500 is almost nonexistent. According to the
household credit access frontier, households with a monthly income of
between R3 500 and R7 500 can qualify for a mortgage bond of between
R140 000 and R300 000 depending on the interest rate and credit-
worthiness. The National Credit Regulator (NCR, 2012) found that, of the
total value of mortgage bonds granted, less than 10 per cent are below
R350 000.”
Further to this, The Banking Association of South Africa (2015: 15) finds that within
the gap market where many housing developments are taking place:
“Due to urbanisation and delivery, despite the rate over the last five years
not being what it should have, we’re probably still looking at similar figures
in the gap market. The problem is that a typical unit that can be produced in
the gap market would have a selling price of around R350 000. In order to
afford that, your household income would have to be around R11 500 per
month.” (emphasis added)
This is a significant finding as it suggests that there is potentially a lending limit
implemented by banks at a household income level of R11 500 a month. Rust
0%
10%
20%
30%
40%
50%
60%
70%
80%
90%
100%2007/1
2/3
1
2008/0
3/3
1
2008/0
6/3
0
2008/0
9/3
0
2008/1
2/3
1
2009/0
3/3
1
2009/0
6/3
0
2009/0
9/3
0
2009/1
2/3
1
2010/0
3/3
1
2010/0
6/3
0
2010/0
9/3
0
2010/1
2/3
1
2011/0
3/3
1
2011/0
6/3
0
2011/0
9/3
0
2011/1
2/3
1
2012/0
3/3
1
2012/0
6/3
0
2012/0
9/3
0
2012/1
2/3
1
2013/0
3/3
1
2013/0
6/3
0
2013/0
9/3
0
2013/1
2/3
1
2014/0
3/3
1
2014/0
6/3
0
2014/0
9/3
0
Credit granted per income
group - Table 10: Mortgages -
Mortgages granted per income
category: > R15,000
Credit granted per income
group - Table 10: Mortgages -
Mortgages granted per income
category: R10,001 - R15,000
Credit granted per income
group - Table 10: Mortgages -
Mortgages granted per income
category: R7,501 - R10,000
Credit granted per income
group - Table 10: Mortgages -
Mortgages granted per income
category: R5,501 - R7,500
Credit granted per income
group - Table 10: Mortgages -
Mortgages granted per income
category: R3,501 - R5,500
Credit granted per income
group - Table 10: Mortgages -
Mortgages granted per income
category: R0 - R3,500

Western Cape Human Settlement Demand Study – Housing Market Segment Analysis
27
(2012) indicates the cheapest newly built house costs approximately R249 000. If
one applies the affordability curve indicated in Figure 12, this equates to a monthly
household income of R9 612. However, given the increase in house prices since
2012 and the recent increase in subsidy quantum and minimum standards, the cost
of a newly built house is likely to be closer to the affordability equivalent of R11 500
per month, which is R297 921. This would suggest that there is little, if any
difference between the supply and the lending limits and these need not be
differentiated from one another.
4.1.2 Income groups targeted by housing programmes
The fact that the state housing programmes are defined by income qualification
criteria means that, although they are a supply intervention, they also define a
category of demand. These programmes are documented in the National Housing
Code. These relate primarily to the lower end of the housing market, i.e.
households earning between R0-R15 000/month. The programmes are targeted at
different income segments to ensure the specific nature of housing demand in these
segments is met. The market segments at the lower end of the income spectrum
are therefore defined by the income limits to the various housing programmes.
Two key housing programmes are the IRDP and Upgrading Informal Settlements
Programme (UISP). The IRDP promotes mixed used, mixed income projects
involving the private sector in low income and affordable housing provision. It
provides for a range of incomes and housing types and other non-IRDP subsidy
instruments such as FLISP. This Upgrading Informal Settlements Programme
provides for in situ upgrading of informal settlements and, as a last resort,
relocations. Grants are made available to municipalities to enable them to upgrade
informal settlements. This programme makes use of the Consolidation Grant, the
People’s Housing Process Consolidation and the FLISP for the provision of top
structures.
Household monthly income: <R3 500
Institutional subsidies: This is a subsidy given to approved housing institutions
to acquire residential property and manage it. The value per unit is linked to the top
structure subsidy, at approximately R110 947. The institution then provides rental
or rent-to-buy to households earning below R3 500. Beneficiaries of rent-to-buy
projects must rent for at least four years. If the beneficiary declines to buy in a
rent-to-buy project the beneficiary may apply for a housing subsidy in another
project, and another beneficiary take up their vacant space. It provides rental
housing accommodation to the lower end of the market and grant funding to social
housing institutions. It also provides affordable rental within or outside
restructuring zones.
Community Residential Units: This programme provides rental housing in
publicly and grey (public and private components) owned hostels, and in publicly
owned rental stock for households earning below R3 500 per month (though in the
Western Cape it is targeted at income groups between R800 and R3 500/month).
Individual subsidy programme: Credit linked individual subsidies allow
beneficiaries to purchase existing houses, linked to credit from a financial
institution. The financial institution applies for the subsidy on behalf of the
beneficiary. Non-credit linked subsidies allow beneficiaries to acquire property
entirely from the subsidy. The subsidy is paid to the seller. These subsidies are
targeted at household earning less than R3 500 per month, and have a value of

Western Cape Human Settlement Demand Study – Housing Market Segment Analysis
28
R160 573. Parties benefitting from the Individual subsidy programme are also
permitted to purchase houses built through the National Housing Programme if the
sale is legally compliant.
Consolidation subsidy: The consolidation subsidy is targeted at owners of
serviced sites, earning under R3 500, for the construction of a top structure. It is
targeted at beneficiaries who have already received state assistance to acquire a
serviced residential site under pre-1994 state housing schemes.
Enhanced People’s Housing Process: The Enhanced People’s Housing Process
provides a subsidy to build a top structure on serviced and owned sites, with the
subsidy set at R110 947. This programme allows active participation by the
beneficiaries over both the housing process and product and targets households
with an income under R3 500.
Farm Residents Housing Assistance Programme: This programme makes
provision for either rental or owned housing for farmworkers where it is not feasible
for these workers to commute daily from the nearest town to the farm where they
work. This programme supports households with an income of under R3 500.
Household monthly income: R1 500 - R7 500
Social housing programme: The social housing programme provides rental
accommodation to low to medium income persons through accredited social
housing institutions. This programme only provides housing in approved
“Restructuring Zones”, aimed at increasing densities on well-located land. The value
of the grant differs depending on the number of units in a project for households
earning between R1 500 and R7 500/month.
Household monthly income: R3 501 - R7 000
Finance Linked Individual Housing Subsidy Programme: The Finance Linked
Subsidy Programme (FLISP) assists beneficiaries to acquire improved residential
property or to obtain vacant serviced residential stands linked to home building
contracts with home builders registered with the National Home Builders
Registration Council, or the construction of a residential dwelling assisted by a
homebuilder registers with the NHBRC on a serviced stand that is already owned by
the beneficiary. Households in the income group R3 501 to R7 000 can apply for
FLISP or to be allocated a free serviced stand under the re-adjusted IRDP.
Enhanced Extended Discount Benefit Scheme: This programme is available to
beneficiaries who took occupation of a house before 15 March 1994. These units
can now be bought at a discount to the maximum of the top structure subsidy for
the under R3 500 household income category or R7 500 for the R3 500 to R7 000
household income category. Existing debtors can also use the programme to pay
the balance owed on properties they purchased from the state or on rental arrears.
The aim is to extend home ownership and transform home ownership profiles.
Household monthly income: R7 001 - R15 000
Finance Linked Individual Housing Subsidy Programme: The Finance Linked
Subsidy Programme (FLISP) assists beneficiaries to acquire improved residential
property, obtain vacant serviced residential stands, or construct residential
dwelling. Qualifying households earning between R7 000 and R15 000 qualify for
financial assistance linked to the repayment of a bond. This subsidy is attached to
the beneficiary and is used to decrease the mortgage bond.

Western Cape Human Settlement Demand Study – Housing Market Segment Analysis
29
4.2 Tenure
From the literature referenced earlier, it is clear that there are a wide range of
tenure options. However, for the purposes of defining market ‘segments’ it is
possible to simplify the range into insecure and secure tenure, and ownership and
rental. As insecure tenure is not a desirable situation, it is not included as a
dimension of the ‘market’. For ownership to be secure, it should through necessity
be formal, but for rental, a range of informal and formal rental options may be
acceptable.7 ‘Rent to buy’ is classified primarily as a rental option (although as a
means to achieve ownership). As for the income bands, the demand for either
ownership or rental are also influenced through the supply of these tenure options
through the State housing programmes and within the affordable and bonded
market segments.
The housing programmes that deliver formal ownership8 to the lower end of the
income spectrum are:
Integrated Residential Development Programme;
Upgrading Informal Settlements Programme (where a range of alternative
tenure options may be appropriate);
Enhanced People’s Housing Process;
Individual subsidies;
Finance Linked Subsidy Programme;
Farm Residents Programme.
Those housing programmes that deliver rental tenure comprise:
Institutional Subsidy Programme;
Community Residential Units (CRU);
Social Housing Programme;
Farm Residents Programme.
Those households within the income bands covered by the above programmes, but
that do not qualify; will have a preference for ownership or rental, although
evidence suggests that rental is far more common through the inability of low
income households to purchase serviced land, even if they are able to afford to
construct their own top structure.
Affordability is a key challenge, as 60% of South Africans earn less than R3
500/month with a rental affordability of less than R1 000/month. There is little
formal stock available in this segment. As Section 3.2.2 showed, rental tenure is a
significant proportion of the market across all income groups but appears to be
more of a default option for those in the lower end of the market due potentially to
the unaffordability of ownership.
7 As mentioned earlier, this study thus proposes using a definition of formal rental being the rental of a legally-owned formal structure or room and informal rental being the rental of illegal or informal structures.
8 There are a range of housing programmes that presuppose ownership, such as the consolidation subsidy and the extended discount benefit scheme, which are ignored in this discussion.

Western Cape Human Settlement Demand Study – Housing Market Segment Analysis
30
In terms of the formal rental market, communications with PayProp suggest that
the formal rental market may begin from household incomes of R30 0009. PayProp
also indicated that there are households who would otherwise be eligible for access
to housing finance through the bonded market, who have to revert to the formal
rental market because of non-compliance with lending institution requirements
under the National Credit Act. As an example, if a household earning enough to
access mortgage finance does not pass the credit clearance undertaken by a
lending institution, it cannot be granted housing finance.
In terms of the small-scale private rental market, Gardner (2011: 4) suggests that:
“Of the 2.4-million South African households that rent their primary
accommodation, 850 000 (35%) occupy small-scale private rental units.
This equates to approximately 10% of all South African households.”
Rentals within this market were estimated to be around R147/month for informal
small-scale private dwellings in 2006 relative to rentals of R291/month for formal
dwellings. The small-scale private rental market represents an important form of
accommodation to households in South Africa. It provides flexible accommodation
opportunities for households waiting for subsidised houses. It is also a means of a
safety net for many marginalised households that cannot access better
accommodation, because it might be unavailable or too costly (ibid: 6).
Representing the key programmes and/or housing segments in a more simplified
fashion shows the income groups covered through the various
programmes/segments relative to those which are perhaps less represented (Table
2).
Table 2: Housing programmes by tenure status and income group
Tenure status and related housing programmes
Monthly income (Rands)
0-800 801 - 1 500
1 501 -3 500
3 501 - 7 500
7 501 - 15 000
>15 000
Owned
Subsidised x x x
FLISP x x
GAP x x x
Non-qualifiers x x x x x
Bonded x
Rental
Non Qualifiers x x x x x
Informal Rental x x x x
CRU x x
Social Housing x x x
Formal Rental x x x
Source: Own representation
There do not appear to be any data sources that allow one to differentiate tenure
preference from current tenure arrangement, and therefore the statistics around
9 Caution should be exercised in interpreting this as a firm income limit however as Payprop only deals with the formal rental market managed through estate agencies. It thus excludes privately rented housing which may have a different minimum income band. In theory, there is no minimum limit to formal rental, as landlords may charge as little as they choose for a formal rental unit.

Western Cape Human Settlement Demand Study – Housing Market Segment Analysis
31
current tenure arrangements would have to be used as a proxy for tenure
preference.
4.3 Differentiation within the market segments
4.3.1 Employment
An additional aspect of housing demand is the impact that employment, more
specifically the lack thereof, has on the type and location of housing and the tenure
arrangement. While it is not considered as an independent dimension for the sake
of the market segmentation undertaken in the next section, it is worth
understanding how it correlates to the choice of dwelling. In light of the evidence
shown by Cross (2010), a household’s choice of housing is often a function of their
employment status. Employment status is not only about affordability of housing
options, but also which housing options and locations provide the required flexibility
and mobility for job-seekers.
In the Western Cape, there is evidence to suggest that the employment status of
the household head could be linked to their dwelling options, as approximately 50-
60% of household heads residing in formal dwellings are employed (Figure 23).
Notably, the share of household heads residing in informal dwellings that are
unemployed is larger when contrasted to the unemployed living in other dwelling
types. Surprisingly, there is not a noticeably greater share of unemployed
household heads residing in traditional dwelling types, but this is a relatively small
proportion of the population in the Western Cape.
Figure 23: Head of household employment status by dwelling type in the Western Cape (2011)
Source: Own analysis using Census 2011
As there is not a particularly strong differential trend across the choice of dwelling
type by the household head’s employment status, this dimension is not explored as
0% 20% 40% 60% 80% 100%
House or concrete structure on a separate
stand
Traditional dwelling
Flat in a block of flats
Cluster house in complex
Townhouse/cluster/semi-detached house
Semi-detached house
House/flat/room in backyard
Informal dwelling (shack; in backyard)
Informal dwelling/elsewhere
Room/flatlet on a shared property
Caravan/tent
Other
Employed
Unemployed
Discouraged
work-seeker
Other not
economicallyactive

Western Cape Human Settlement Demand Study – Housing Market Segment Analysis
32
part of the housing market segment. It is however an important indicator but is an
exogenous factor influencing the housing market.
An alternative view of employment by settlement type shows that only 2% of rural
household heads in the Western Cape are unemployed (Figure 24). This indicates
that employment status is only relevant in urban areas.
Figure 24: Head of household employment status by location in the Western Cape (2011)
Source: Own analysis using Census 2011
4.3.2 Age
One of the key qualification criteria for state-housing assistance is that an individual
must be 18 years or older. Therefore the age profile of households can have
important implications for future housing demand. Age is also of interest since the
national minister’s announcements of the planned prioritization of housing delivery
to individuals over the age of 40.
In the Western Cape, there is evidence to suggest that the age group of the
household head could be linked to their current housing situation, as approximately
70-80% of household heads aged above 40 years are residing in formal dwellings
(Figure 25). The picture is not much different at a national scale however there is a
fair proportion of household heads aged above 40 years residing in informal
dwellings.
In contrast, for household heads aged between 18-39 years old, the choice of
dwelling at the provincial and national level is quite different. Whereas household
heads in this age group in the Western Cape appear to reside in a mix of dwelling
types, nationally, there is a greater dominance of such household heads living in
formal dwellings. There is also evidence to suggest a fairly greater share of
household heads in this age group is living in informal dwellings. What Figure 25
indicates is that there is a far greater demand in the age group 18-39 than the age
group above 40. 33% of household heads in the 18-39 age group are inadequately
housed (excluding overcrowding), while only 10% in the higher age group. The
lower age group represents 69% of the backlog in the province.
0%
10%
20%
30%
40%
50%
60%
70%
80%
90%
100%
Urban Rural
Age less than 15 years
Other not economicallyactive
Discouraged work-seeker
Unemployed
Employed

Western Cape Human Settlement Demand Study – Housing Market Segment Analysis
33
Figure 25: Dwelling type by age group of household head in South Africa and the Western Cape (2011)
Source: Own analysis using Census 2011
Projections by PWC (2014) show that that the Western Cape population aged 65
years and above will rise by 6% between 2011 and 2040 (Figure 26). Further to
this, the population is expected to age considerably between 2011 and 2040 as
evidenced by the narrowing of the pyramid. This has important implications for
housing demand planning going forward as should the national minister enact a
policy favouring individuals aged 40 years and above, this may have different policy
implications in the Western Cape to that at the national scale.
0%
10%
20%
30%
40%
50%
60%
70%
80%
90%
100%
HH head
aged 18-39years
HH head
aged >40years
HH head
aged 18-39years
HH head
aged >40years
WC SA
Other
Caravan/tent
Room/flatlet on a sharedproperty
Informal dwelling/elsewhere
Informal dwelling (shack; inbackyard)
House/flat/room in backyard
Semi-detached house
Townhouse/cluster/semi-detached house
Cluster house in complex
Flat in a block of flats
Traditional dwelling
House or concrete structure on aseparate stand

Western Cape Human Settlement Demand Study – Housing Market Segment Analysis
34
Figure 26: Western Cape population pyramid projection
Source: Price Waterhouse Coopers (2014)
4.3.3 Qualification criteria for state assistance
The eligibility of households in various income groups to access housing finance
made available through the State and private sector, is dependent on them meeting
certain qualification criteria. In the case of state funding, these criteria are defined
by national policy and, as in the Western Cape, have been customised to match the
typical demand need/profile of provincial households.
The research has highlighted the need to define those low-income households that
do not qualify for State assistance as a distinct market segment. These households
are therefore defined by looking at the qualification criteria for the various
programmes.
The general qualification criteria for state housing programmes in the R0 - R3 500
household income band in the Western Cape can be distinguished in terms of those
which are essential for applicants to meet and those which are preferential. These
are, respectively:
Essential criteria:
1. South African resident(*);
2. 18 years old and above(*);
3. Not have previously benefited from a government housing subsidy
assistance;
4. Did not previously own residential property;
5. Married or cohabiting or with financial dependents(*);
6. Household income between R0-3500 per month (*).

Western Cape Human Settlement Demand Study – Housing Market Segment Analysis
35
The essential criteria which the Census 2011 can provide descriptive information on
are those with stars (*) next to them. In contrast, with regards to criteria 3 and 4
however, these can only be established with reference to the Housing Subsidy
System (HSS) and Deeds office records on a person-by-person assessment. This
would require that an individual’s Identification Number is screened through the
HSS and Deeds office records to pinpoint their previous qualification for housing
assistance or housing ownership status. Given that the study only have access to
aggregate information from the HSS, only a high-level assessment can be done to
understand the aggregate extent of government housing subsidy assistance by a
few selected parameters (such as type of subsidy granted, average age of applying
and qualifying applicants as well as the gender of the applicant).
For households falling within the FLISP household income band of R3 500 and R15
000, in addition to the essential criteria, the additional qualifying criteria for FLISP
is that on accessing the subsidy it must be attached to a mortgage bond.
Preferential criteria:
7. Military veterans (single without dependents) with household income of less
than R125 000 per annum (*income only);
8. Aged and disabled persons10(with or without financial dependents)(*);
9. Beneficiaries of Land Restitution Programme.
As with the essential criteria, there are limits to the analysis of the preferential
criteria in terms of data availability. While the income level of a household, the age
and disability status of individuals can be ascertained from Census 2011, the
veteran status and Land Restitution beneficiary status would rely on a person-by-
person assessment of official government records. It would thus not be possible to
analyse these within the demand analysis unless aggregate statistics on the
number of such individuals can be obtained for the Western Cape. This would
provide at least an overview of the potential housing demand which might arise
from these groupings in the province.
In addition to criteria 1-5, applicants for other state housing programmes in the
province need to comply to additional essential criteria as follows:
Social Housing Programme: Household income between R1 500 and R7
500 per month. Households can apply for individual subsidies if exiting
Social Housing Programme.
Finance Linked Subsidy Programme: Household income up to R15 000
per month.
Enhanced Extended Discount Benefit Scheme: Household income up to
R7 000.
In all instances, it is possible to review the potential recipients of these
programmes through an assessment of the various income bands. However, as
mentioned in the previous section, these income bands do not correspond to those
in the Census 2011. The Census data has therefore been adjusted to place
households into income bands that more closely resemble the housing/human
settlement income bands.
10 In the Western Cape quotas are assigned to these groups as well as for older farm residents’ who have resided on their farms for at least 10 of the last 13 years.
Western Cape Human Settlement Demand Study – Housing Market Segment Analysis
36
Non-Qualifiers
Parties who do not qualify for housing within the aforementioned essential criteria,
are then classified as ‘non-qualifiers’. Non-South African citizens comprise a
significant share of non-qualifiers in inadequate housing in South Africa. Non-South
African citizens do not qualify for any of the housing programmes, whether they are
refugees, asylum seekers or other migrants. This forms a significant gap in the
housing supply. According to Landau and Segatti (2009), 70% of non-South African
citizen urban migrants live in privately rented inner city flats. 64% of these non-
citizens are in sub-tenancy arrangements, much of which is overcrowded (ibid).
Identifying non-qualifiers would presumably entail characterising those households
who are not eligible for state-assistance (due to non-compliance with the
aforementioned criteria) as well as those households who fall outside of the
requisite income bands.
5 A consolidated view of Housing Market Segments in
the Western Cape
Supply dynamics
Between 2009 and 2014, 107 425 houses and serviced sites were provided in the
Western Cape – an average of 21 485 opportunities per year. When compared to
the calculated ‘backlog’ in 2011 of 329 072 households earning less than R3 500
per month (including non-qualifiers), it is clear that the State-driven supply at the
lower end of the market will take some time to catch up to demand and there are
still households who are not catered for through these programmes who revert to
the ‘informal’ housing market.
In addition, the affordability of property in the Western Cape is declining and
generating a shortage of housing stock in the province particularly as available to
those in lower income brackets. Despite the number of state-provided housing
supply options to meet the demand of households which are unable to access the
bonded market, the shortage of housing stock in the gap market perpetuates a
cycle of rising prices and supply shortage.
The formal housing market serving households earning above R15 000 per month
appears to be functioning well, although the affordability ratio in Cape Town is high.
Demand dynamics
In terms of the demand for housing, using Census 2011 statistics, this study shows
that there is still a notable share of households in the Western Cape residing in
inadequate housing, and not all of these are in the lowest income brackets.
Approximately 21% of ‘inadequately’ housed households earn more than R3 500
per month and 6% earn more than R7 500 per month. The lowest (monthly)
income households in the province are concentrated in informal settlements but
there is a fairly even split of households across informal settlements, informal
backyard dwellings and overcrowding in the R1 500-R3 500 monthly income band.
The total backlog across all income groups in the province is calculated to be 414
212 households.
This report shows that there is a number of housing demand dimensions which
drive the choice of dwelling by household and influence a household’s ability to
access a specific housing segment. The primary dimensions of demand explored
relate to income, qualification criteria and tenure. Further considerations which

Western Cape Human Settlement Demand Study – Housing Market Segment Analysis
37
influence housing demand are employment status and age. These dimensions in
themselves determine a household’s placement in the housing ladder.
Tenure
In the case of the Western Cape a greater share of higher income households own
(fully paid or being paid off) as compared to lower income brackets. The rapid
increase in households in houses owned but not yet paid off between R6 400-R12
800 a month indicates that this is the income bracket at which housing finance
becomes available. Rent free occupation is a significant part of the lower income
markets, and only a very small percentage of the higher income markets. Rental is
a significant proportion of the market across income groups, suggesting the
decision to rent is often influenced by factors other than income, and the data
suggests that 20% of households across all income groups would prefer to rent
than to own.
Qualification criteria
Households that fall into the requisite income categories, but do not qualify for
housing subsidies should be considered a separate housing ‘market’. While the
numbers of households meeting some of the qualification criteria are simple to
determine using Census data (e.g. household head ages above 18 years), others
are more difficult (e.g. previous access to a subsidy; previous ownership of a
property) are more difficult to quantify and would have to be estimated using proxy
percentages from the Western Cape Housing Demand Database.
Access to credit is also a qualification for the FLISP programme. Approximately two
thirds of households falling within the FLISP income brackets would not qualify for
credit required to access the subsidy. This may be improved through the new FLISP
provision that allows beneficiaries to access a serviced site instead of a house,
thereby reducing the amount of credit required.
Income
The income bands at the lower end of the housing market are determined by the
income qualification criteria for the state housing programmes. These are different
for each programme and differ in terms of ownership and rental programmes as
profiled below. In addition, the evidence suggests that the supply limit and the
lending limit coincide at a household income of around R11 500. The market above
R15 000 is not eligible for state assistance. Although households in this bracket
may struggle with stock availability and credit, the evidence suggests that there is
both credit available and a willingness to develop housing in this market. Resale
and downward raiding also present supply options in this market. Nevertheless, the
data for the demand profiles will be presented for household incomes of R20 000
and R30 000 per month in the event that further evidence suggests that these
households require some type of market intervention.
The proposed income brackets for the market segment analysis are therefore:
Ownership
Monthly household income of less than R3 500: Subsidized market;
(qualifiers and non-qualifiers);
Monthly household income between R3 500 and R11 500: Gap market
(Household eligible for FLISP but unable to access stock or credit; non-
qualifiers for FLISP because of qualification criteria or inability to access
credit);
Monthly household income between R11 500 and R 15 000: Finance linked
subsidy market (Households eligible for FLISP and who can access credit;

Western Cape Human Settlement Demand Study – Housing Market Segment Analysis
38
Non-qualifiers who can access credit; non-qualifiers who cannot access
credit);
Monthly household income above R15 000: Households who can access
mortgage finance in the bonded market.
Rental
Monthly household income of less than R3 500: Subsidized rental market
(CRU rental housing recipients; non-qualifiers)
Monthly household income between R1 500 and R7 500: Social Housing
market (Qualifiers and non-qualifiers)
Monthly household income above R7 500: Formal rental market (Households
who can become eligible for housing in the formal rental market).
Employment status and age
While these two elements are not perceived as ‘market segments’ they do appear
to be exogenous and/or endogenously influencing a household’s placement in the
housing ladder and their housing preferences. Employment is important in terms of
a policy response in that job-seekers prefer cheap, flexible and well-located housing
options. Age is relevant in determining the quantum of the backlog if subsidy policy
dictates age brackets for qualification or preference. Age is also important in the
degree to which the qualifying cohort changes over time. Demographic trends
indicate that the growth in household head’s aged over 18 years will decrease, but
growth in household head’s aged above 40 years will increase over time.
Housing market segments in the Western Cape
Combining these demand dimensions visually provides an image of the housing
segments operational in the Western Cape (Figure 27).

Western Cape Human Settlement Demand Study – Housing Market Segment Analysis
39
Figure 27: Housing market segments of the Western Cape
Source: Own representation
Given these dimensions, there are a number of State housing finance mechanisms
available to households for meeting their housing demand. In the tenure ownership
segment of the housing market, a number of housing subsidy programmes are in
place for households earning below R3 500/month. For households earning between
R3 500 and R15 000/month, the FLISP programme is available and beyond R15
000 households are expected to revert to the bonded market. However, not all
households within the FLISP income band are able to access it due to the lending
limit (household income of R11 500). Such households then represent part of the
‘gap’ market whose needs are partially being met through Financial Sector Charter
loans.
In terms of the rental market, there are also a number of State housing
programmes including CRU which relates to households earning between R800 and
R3 500/month and Social Housing which relates to households earning between R1
500-R7 500/month. It is still not fully clear what the income band boundary
between the formal and informal rental markets is.
While there are thus a number of programmes which households can access to
meet their demand, there are also notable limitations to their capacity to access
such opportunities. If a household does not meet the qualification criteria of state-
funding or those of lending institutions, they fall into a category of ‘non-qualifiers’.
It is inferred, on the basis of the literature reviewed, that many of these non-
qualifiers are reverting to residence in informal dwellings (such as shacks or
traditional housing) to meet their demand. Some such non-qualifiers include, but
are not limited to, non-South African citizens or parties who may have previously
benefited from state housing programmes.
Ten
ure
& q
ualificatio
n
Ow
ne
rship
Ren
tal
R 3
50
0
R 1
5 0
00
R1
1 5
00
Non-qualifiers
R 1
50
0
R 8
00
R 7
50
0CRU
Social Housing
Non-qualifiers /Informal rental
Bonded
Formal rental
Gap
Subsidy FLISPAged 18-39years
Aged 40
years and
above
Income
Western Cape Human Settlement Demand Study – Housing Market Segment Analysis
40
For the housing demand profile exercise an attempt will be made to populate the
above housing market demand ‘cube’ for each municipality and the province as a
whole in order to better inform policy responses.

Western Cape Human Settlement Demand Study – Housing Market Segment Analysis
41
References
Affordable Land & Housing Data Centre. 2013. Tracking the Affordable Housing
Market with CPA Credit Data: How credit data informs – and can expand –
affordable housing options. Powerpoint presentation by AL+HDC in
collaboration with the Centre for Affordable Housing Finance in Africa.
Centre for Affordable Housing Finance in Africa (CAHFA) and the South African
Cities Network (SACN). 2014. Findings: City of Cape Town. This report formed
part of a series of reports on ‘Understanding Housing Markets in South Africa:
Expanding Affordable Housing Market opportunities’.
Cross, C. 2010. Shack settlements as entry to the labour market. Paper presented
to ULM conference 2010. Human Sciences Research Council.
Dawson, H and McLaren, D. 2014. Monitoring the right of access to adequate
housing in South Africa: An analysis of the policy effort, resource allocation and
expenditure and enjoyment of the right to housing. Working Paper 8, Studies in
Poverty and Inequality Institute.
Department of Housing. 2004. Breaking New Ground – A comprehensive plan for
the development of sustainable human settlements. Available from -
http://abahlali.org/files/Breaking%20new%20ground%20New_Housing_Plan_C
abinet_approved_version.pdf. (Accessed 23 August 2013).
Department of Human Settlements. 2009. Simplified Guide to the National Housing
Code: The Policy Context.
Department of Human Settlements. 2009. The National Housing Code – Simplified
Guide to the National Housing Code: The Policy Context. Available from -
http://www.dhs.gov.za/content.php?pagename=National-Housing-Code
(Accessed 23 August 2013).
Downie, L. 2011. Urban Pro-Poor Registrations: Complex Simple: The Overstrand
Project. Potchefstroom Electronic Law Journal, Vol. 14. No.3. 2011.
Eighty 20. 2008. Supply and Demand of rental accommodation in South Africa. The
Social Housing Foundation.
Financial and Fiscal Commission. 2013. Exploring alternative finance and policy
options for effective and sustainable delivery of housing in South Africa.
Midrand, Johannesburg, South Africa.
First National Bank. 2015. Property Barometer: Western Cape Residential Property
Review. 11 February 2015.
Gardner, D. 2011. Small-scale Private Rental in South Africa. Part of a series of
case studies developed as a teaching and learning resource for studies in urban
land markets, Urban LandMark.
Gardner, D. 2015. Gauteng Integrated Infrastructure Masterplan Framework:
Human Settlements – Status Quo Report. Version 2.0. Unpublished report.
Hogarth, K. 2015. Analysis of The Cape Town Housing Market: Supply, Demand
And Housing Submarkets - Methodology And Preliminary Findings. Unpublished
report produced by the Spatial Planning and Urban Design Unit of the City of
Cape Town.
Landau, L and Segatti, A (2009) Human Development Impacts of Migration: South
Africa Case Study. UNDP Human Research Paper 2009/05.

Western Cape Human Settlement Demand Study – Housing Market Segment Analysis
42
Lightstone Property. 2015. Residential Property Indices. Published 28 January
2015.
McGaffin, R. 2011. Market Failure in the Housing Sector…some issues to consider.
Urban Land Markets Programme Southern Africa.
National Treasury. 2015. Budget Speech. Speech by Finance Minister Nhlanhla
Nene to the Parliament of the Republic of South Africa on 25 February 2015.
Available at
http://www.treasury.gov.za/documents/national%20budget/2015/speech/spee
ch.pdf (accessed 28 February 2015).
PayProp. 2014. PayProp Rental Index: Annual Market Report 2014.
PDG (Palmer Development Group). 2011. Urban LandMark Land Release
Assessment Tool: Comparison between the findings of the Western Cape and
Gauteng case studies. A study completed by PDG for Urban LandMark.
Poswa, N and Levy, R. 2006. Migration study in Monwabisi Park (Endlovini),
Khayelitsha. City of Cape Town Strategic Development Information and GIS
Department. Available at
https://www.capetown.gov.za/en/stats/CityReports/Documents/Other%20City
%20Reports/Migration_Study_in_Monwabisi_Park_712200614556_359.pdf
(Accessed 3 March 2015).
Presidency. 2010. For Outcome 8 Delivery Agreements: Sustainable Human
Settlements and Improved Quality of Household Life. Available from –
http://www.thepresidency.gov.za/pebble.asp?relid=2542 (Accessed 23 August
2013).
Presidency. 2012. National Development Plan 2030 - Our future – make it work:
Executive Summary. Available from - http://www.info.gov.za/issues/national-
development-plan/
Price Waterhouse Coopers. 2014. Western Cape Population Projections 2011-2040.
Report compiled for the Western Cape Department of Social Development.
(Accessed 23 August 2013).
Quantec. 2015. National Credit Regulator Quarterly Statistics. Accessed via Western
Cape Government: Department of Economic Development and Tourism.
Rust, K (2012) Perspectives on South Africa’s Affordable Housing Market: Current
trends and issues. Centre for Affordable Housing Finance in Africa.
Shisaka Development Management Services. 2011. Housing Subsidy Assets -
Exploring the Performance of Government Subsidised Housing in
South Africa: Timeline Analysis. Available from -
http://www.housingfinanceafrica.org/wp-content/uploads/2011/12/RDP-
Assets-Timeline-Analysis_Final_April11.pdf. (Accessed 30 July 2013).
Statistics South Africa. 2013. General household survey 2013. Statistical release
P0318.
The Banking Association South Africa. 2015. SA’s housing challenge: What’s being
done to solve the problem?. Available online at -
https://www.joomag.com/magazine/banker-sa-january-2015-edition-
12/0368065001420456453?page=17
Urban LandMark. 2010. Incrementally Securing Tenure: An approach for Informal
Settlement Upgrading in South Africa. Report written by Dan Smit and Gemey
Abrahams.

Western Cape Human Settlement Demand Study – Housing Market Segment Analysis
43
U.S Department of Housing and Urban Development: Office of Policy Development
& Research. 2007. Measuring Overcrowding in Housing. Available online at -
http://www.huduser.org/publications/pdf/measuring_overcrowding_in_hsg.pdf
Western Cape Government: Department of Human Settlements (WCG: DHS). Date
unknown. Housing programmes. Powerpoint presentation shared with project
team.
Western Cape Government: Department of Human Settlements. 2013a. Municipal
guidelines for responding to farm residents housing needs in the Western Cape.
Western Cape Government: Department of Human Settlements. 2013b.
Enhancements to the national norms and standards for the construction of
stand-alone residential dwellings and engineering services and adjustment of
the housing subsidy quantum.
Western Cape Government: Department of Human Settlements. 2015. Housing
delivery statistics (performance of municipalities): 2009-2014. Data as
provided to study project team by WCG: DHS on 17 March 2015.
Western Cape Government: Provincial Treasury. 2014. Provincial Economic Review
and Outlook 2014. Business Information and Data Management.


