Page 1
s‐
Western Riverside Water and Wastewater Financing Authority Local Agency Revenue Refunding Bonds 2013 Series A-1 and A-2 Prepared for:
March 2019
www.webbmfinance.com
Annual Disclosure Report for Fiscal Year Ending June 30, 2018
Page 2
Table of Contents
Sections
Section 1. District Profile _____________________________________________________ 1
Section 2. Fund Information __________________________________________________ 10
Section 3. Assessed Value Information _________________________________________ 17
Section 4. Payment History __________________________________________________ 25
Section 5. Special Tax Information _____________________________________________ 37
Section 6. Material Events ___________________________________________________ 41
Appendices
Appendix A. Debt Service Schedules
2013 Series A-1 and A-2 Bonds CUSIP Numbers
Year CUSIP Year CUSIP Year CUSIP Year CUSIP
2019 95942TEA1 2023 95942TEE3 2027 95942TEJ2 2031 95942TEN3
2020 95942TEB9 2024 95942TEF0 2028 95942TEK9 2033 95942TEP8
2021 95942TEC7 2025 95942TEG8 2029 95942TEL7 2035 95942TEQ6
2022 95942TED5 2026 95942TEH6 2030 95942TEM5 2037 95942TER4
The information herein for the Community Facilities Districts (the “CFDs”) included in this disclosure for Eastern
Municipal Water District, (the “District”) was prepared by Webb Municipal Finance, LLC and Eastern Municipal
Water District, as Administrators. Except as otherwise noted all information is current as of September 2, 2018.
Page 3
Section 1 District Profile
Western Riverside Water and Wastewater Financing Authority, Local Agency Revenue Refunding Bonds, 2013 Series A-1 and A-2
Annual Disclosure Report for Fiscal Year Ending June 30, 2018
1
Western Riverside Water and Wastewater Financing Authority
Local Agency Revenue Refunding Bonds, 2013 Series A-1 and A-2
CFD 2002-04 IA 3 (Sheffield/Rancho Bella Vista)
Project Location: The property within Improvement Area 3 of CFD 2002-04 is located in the City of Temecula
southeast of Willows Avenue, west of Seraphina Road and north of Rita Way, and is comprised of approximately
35 gross acres. CFD 2002-04 IA 3 is fully developed and consists of 130 single family detached homes.
Project Description: The project includes payments to the District of Improvement Area 3’s proportionate share
of the costs of the District’s water, sewer and sewer treatment facilities.
CFD 2002-04 IA 4 (Sheffield/Rancho Bella Vista)
Project Location: The property within Improvement Area 4 of CFD 2002-04 is located on the west side of
Interstate 215, north of Newport Road and south of Ridgemoor Road, in the City of Menifee and is comprised of
approximately 13 gross acres. CFD 2002-04 IA 4 is fully developed and consists of 52 single family detached
homes.
Project Description: The project includes payments to the District of Improvement Area 4’s proportionate share
of the costs of the District’s water, sewer and sewer treatment facilities and payments to Menifee Union School
District of Improvement Area 4’s proportionate share of the costs for educational facilities.
CFD 2002-09 (Woodside Homes)
Project Location: The property within CFD 2002-09 is located in the City of Menifee, and is located on the west
side of Interstate 215, south of Newport Road. CFD 2002-09 includes approximately 62 gross acres located in
three tracts which have been subdivided into 243 lots zones for development as single-family residences. CFD
2002-09 is fully developed and consists of 243 single family detached homes.
Project Description: The project includes the acquisition or construction of certain water and sewer system
improvements that are required in order to provide water and sewer service to CFD 2002-09 and the acquisition
of capacity in improvements provided through the District’s water and sewer Financial Participation Charge
Program.
CFD 2003-12 IA A (Temecula Creek)
Project Location: The property within Improvement Area A of CFD 2003-12 is located in an unincorporated
portion of Riverside County known as Temecula Valley, south of Highway 79 and Temecula Creek Road and
contains approximately 46 gross acres. CFD 2003-12 IA A is fully developed and consists of 120 single family
detached homes.
Project Description: The project includes the acquisition of water and sewer facilities, payments to the District
for Improvement Area A’s proportionate share of the costs of the District’s sewer and sewer treatment facilities,
the construction of improvements to Highway 79 and the construction of storm drain and electrical system
improvements.
Page 4
Section 1 District Profile
Western Riverside Water and Wastewater Financing Authority, Local Agency Revenue Refunding Bonds, 2013 Series A-1 and A-2
Annual Disclosure Report for Fiscal Year Ending June 30, 2018
2
CFD 2003-12 IA B (Temecula Creek)
Project Location: The property within Improvement Area B of CFD 2003-12 is located in the Temecula Valley area
of Riverside County, south of Highway 79 and on both sides of Temecula Creek Road, and contains
approximately 41 acres. CFD 2003-12 IA B is fully developed and consists of 124 single family detached homes.
Project Description: The project includes the acquisition of water and sewer facilities, payments to the District
for Improvement Area B’s proportionate share of the costs of the District’s sewer and sewer treatment facilities,
the construction of improvements to Highway 79 and the construction of storm drain and electrical system
improvements.
CFD 2003-14 IA A (Clinton Keith/Meadowlark Village)
Project Location: The property within Improvement Area A of CFD 2003-14 is located approximately one-half
mile east of Interstate 215 in the City of Murrieta and contains approximately 11 gross acres. CFD 2003-14 IA A is
fully developed and consists of 144 single family detached homes.
Project Description: The project includes the acquisition or construction of certain water and sewer system
improvements by or for the District that are required in order to provide water and sewer service to the
property within Improvement Area A and payments to the District of Improvement Area A’s proportionate share
of the costs of the District’s water, sewer and sewer treatment facilities.
CFD 2003-14 IA B (Clinton Keith/Meadowlark Village)
Project Location: The property within Improvement Area B of CFD 2003-14 is located approximately one-half
mile east of Interstate 215 in the City of Murrieta and contains approximately 31 gross acres. CFD 2003-14 IA B is
fully developed and consists of 227 single family detached homes.
Project Description: The project includes the acquisition or construction of certain water and sewer system
improvements by or for the District that are required in order to provide water and sewer service to the
property within Improvement Area B and payments to the District of Improvement Area B’s proportionate share
of the costs of the District’s water, sewer and sewer treatment facilities.
CFD 2003-14 IA C (Clinton Keith/Meadowlark Village)
Project Location: The property in Improvement Area C of CFD 2003-14 is located approximately one-half mile
east of Interstate 215 in the City of Murrieta and contains approximately 17 gross acres. CFD 2003-14 IA C is fully
developed and consists of 108 single family detached homes.
Project Description: The project includes (i) the acquisition or construction of certain water and sewer system
improvements by or for the District that are required in order to provide water and sewer service to the
property within Improvement Area C and payments to the District of Improvement Area C’s proportionate share
of the costs of the District’s water, sewer and sewer treatment facilities, and (ii) the acquisition or construction
of certain school facilities by or for the Menifee Union School District.
Page 5
Section 1 District Profile
Western Riverside Water and Wastewater Financing Authority, Local Agency Revenue Refunding Bonds, 2013 Series A-1 and A-2
Annual Disclosure Report for Fiscal Year Ending June 30, 2018
3
CFD 2003-15 IA A (Morgan Valley)
Project Location: The property within Improvement Area A of CFD 2003-15 consists of two developments, “The
Meadows” and “The Vineyards,” located in the Morgan Valley Area of Riverside County near the City of
Temecula and includes approximately 84 gross acres. The Meadows is located at the southern terminus of
Butterfield Stage Ranch Road in the City of Temecula, and The Vineyards is located at the southern terminus of
El Chimisal Road in unincorporated Riverside County. CFD 2003-15 IA A is fully developed and consists of 143
single family detached homes.
Project Description: The project includes: (i) the construction, purchase, modification, expansion, improvement,
or rehabilitation of sewer facilities including the acquisition of capacity in the sewer system of the District, and
all appurtenances and appurtenant work in connection with the foregoing and any other expense incidental to
the construction, acquisition, modification, expansion, or rehabilitation of the improvements and (ii) the
construction, purchase, modification, expansion, improvement or rehabilitation of portions of Butterfield Stage
Road, El Chimisal Road and Anza Road and the Anza 42” storm drain for Riverside County.
CFD 2003-16 (Promontory Park)
Project Location: The property within CFD 2003-16 is located in the City of Moreno Valley, south of Cactus
Avenue and north of John F. Kennedy Drive, between Moreno Beach Drive and Oliver Street, and consists of
portions of two subdivisions. The northern portion contains approximately 132 gross acres and the southern
portion contains approximately 24 gross acres. CFD 2003-16 is fully developed and consists of 404 single family
detached homes.
Project Description: The project includes the acquisition or construction of certain water and sewer system
improvements by or for the District that are required in order to provide water and sewer service to the
property within CFD 2003-16 and the acquisition of capacity in improvements provided through the District’s
Sewer Financial Participation Charge Program.
CFD 2003-19 IA A (Eastridge/Westridge)
Project Location: The property within Improvement Area A of CFD 2003-19 is located in the City of Menifee,
approximately one mile southeast of Interstate 215, and contains approximately 30 gross acres. CFD 2003-19 IA
A is fully developed and consists of 100 single family detached homes.
Project Description: The project includes (i) the acquisition or construction of certain water and sewer system
improvements by or for the District that are required in order to provide water and sewer service to the
property within the Improvement Area A and payments to the District of Improvement Area A’s proportionate
share of the costs of the District’s water, sewer, and sewer treatment facilities, (ii) the acquisition or
construction of certain park improvements by or for Valley-Wide Recreation & Park District, and (iii) the
acquisition or construction of certain school facilities by or for Menifee Union School District.
CFD 2003-19 IA B (Eastridge/Westridge)
Project Location: The property within Improvement Area B of CFD 2003-19 is located in the City of Menifee,
approximately 1.25 miles southeast of Interstate 215, and contains approximately 60 gross acres. CFD 2003-19
IA B is fully developed and consists of 192 single family detached homes.
Project Description: The project includes (i) the acquisition or construction of certain water and sewer system
improvements by or for the District that are required in order to provide water and sewer service to the
property within Improvement Area B and payments to the District of Improvement Area B’s proportionate share
of the costs of the District’s water, sewer, and sewer treatment facilities, (ii) the acquisition or construction of
Page 6
Section 1 District Profile
Western Riverside Water and Wastewater Financing Authority, Local Agency Revenue Refunding Bonds, 2013 Series A-1 and A-2
Annual Disclosure Report for Fiscal Year Ending June 30, 2018
4
certain park improvements by or for Valley-Wide Recreation & Park District, and (iii) the acquisition or
construction of certain school facilities by or for Menifee Union School District.
CFD 2003-20 IA A (Corman Leigh Communities)
Project Location: The property within Improvement Area A of CFD 2003-20 is located in the City of Moreno
Valley and contains approximately 25 gross acres. CFD 2003-20 IA A is fully developed and consists of 114 single
family detached homes.
Project Description: The project includes payments to the District of Improvement Area A’s proportionate share
of the costs of the District’s water, sewer, and sewer treatment facilities.
CFD 2003-25 IA D (Pacific Communities)
Project Location: The property in Improvement Area D of CFD 2003-25 is located in the City of Moreno Valley
and consists of approximately 28 net acres in a development known as Iris III. CFD 2003-25 IA D is fully
developed and consists of 181 single family detached homes.
Project Description: The project includes the construction, purchase, modification, expansion, improvement or
rehabilitation of water and sewer facilities including the acquisition of capacity in the water and sewer systems
of the District with onsite and offsite, and all appurtenances and appurtenant work in connection with the
foregoing.
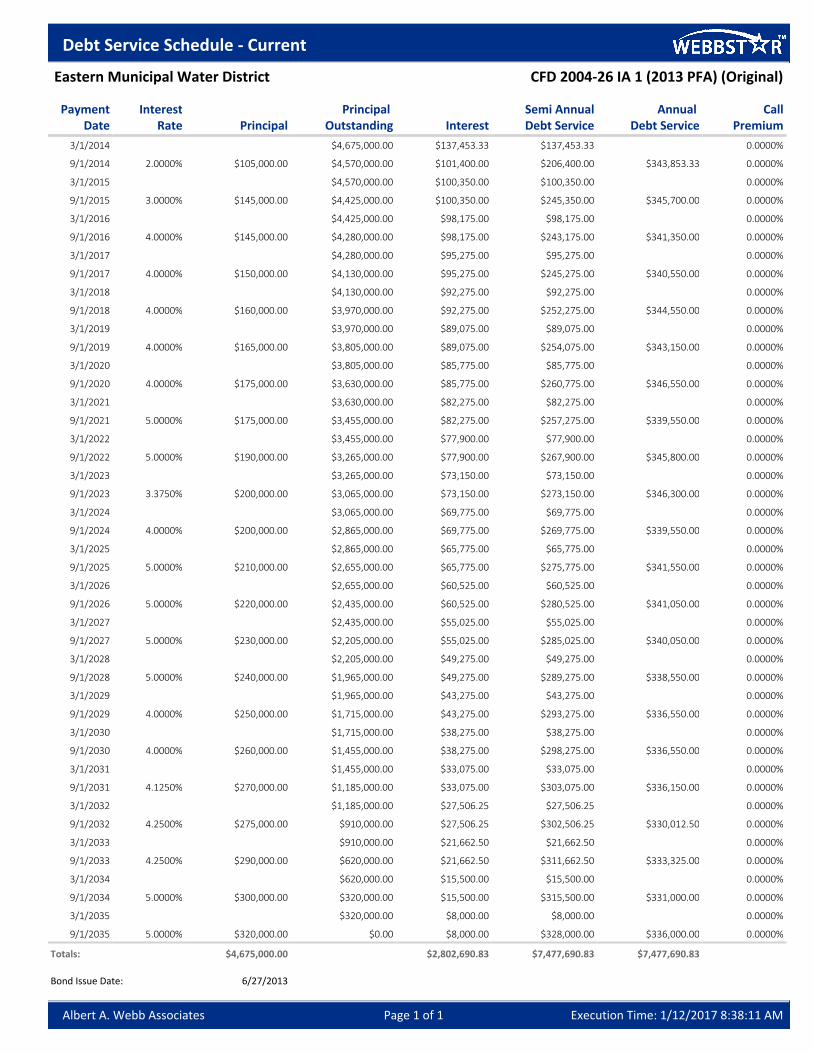
CFD 2004-26 IA 1 (Lennar San Jacinto)
Project Location: The property within Improvement Area 1 of CFD 2004-26 is located in the City of San Jacinto, at
the southeast corner of Sanderson Avenue and 7th Street, and contains approximately 90 gross acres. CFD 2004-
26 IA 1 is fully developed and consists of 337 single family detached homes.
Project Description: The project includes (i) the acquisition or construction of certain water and sewer system
improvements by or for the District that are required in order to provide water and sewer service to the
property within Improvement Area 1 and payments to the District of Improvement Area 1’s proportionate share
of the costs of the District’s water, sewer, and sewer treatment facilities and (ii) the acquisition or construction
of certain city facilities by or for the City of San Jacinto.
CFD 2004-26 IA 2 (Lennar San Jacinto)
Project Location: The property within Improvement Area 2 of CFD 2004-26 is located in the City of San Jacinto,
south of W 7th St between S Lyon Avenue and Pine Avenue, and contains approximately 63 gross acres. CFD
2004-26 IA 2 is being developed and upon buildout is expected to consist of 203 single family detached homes.
Project Description: The project includes (i) the acquisition or construction of certain water and sewer system
improvements by or for the District that are required in order to provide water and sewer service to the
property within Improvement Area 2 and payments to the District of Improvement Area 2’s proportionate share
of the costs of the District’s water, sewer, and sewer treatment facilities and (ii) the acquisition or construction
of certain city facilities by or for the City of San Jacinto.
Page 7
Section 1 District Profile
Western Riverside Water and Wastewater Financing Authority, Local Agency Revenue Refunding Bonds, 2013 Series A-1 and A-2
Annual Disclosure Report for Fiscal Year Ending June 30, 2018
5
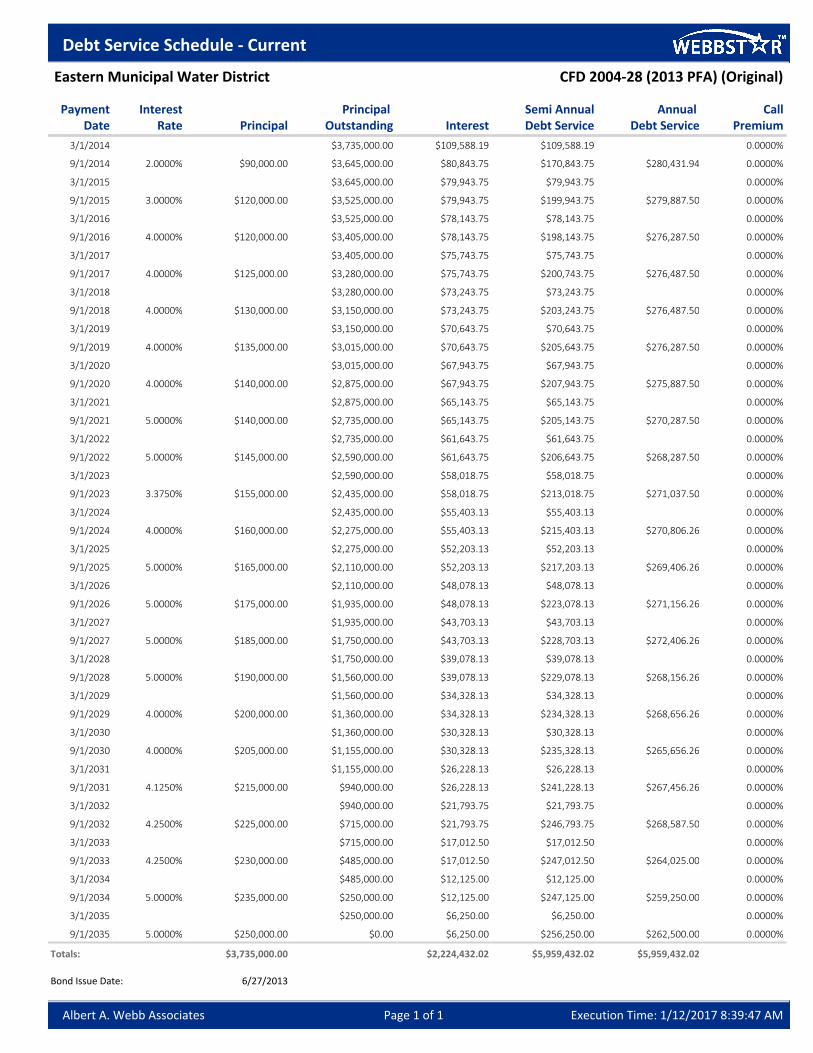
CFD 2004-28 (Quinta Do Lago)
Project Location: The property within CFD 2004-28 is located in the French Valley area of Riverside County at the
southeast side of Winchester Road between Algarve Avenue and Skyview Road, and contains approximately 60
gross acres. CFD 2004-28 is fully developed and consists of 215 single family detached homes.
Project Description: The project includes (i) the acquisition or construction of certain water and sewer system
improvements by or for the District that are required in order to provide water and sewer service to the
property within CFD 2004-28 and the acquisition of capacity in improvements provided through the District’s
Sewer Financial Participation Charge Program, (ii) the acquisition or construction of certain park improvements
by or for Valley-Wide Recreation & Park District, and (iii) the prepayment of the District’s Assessment District
No. 6 assessment lien applicable to the property within CFD 2004-28.
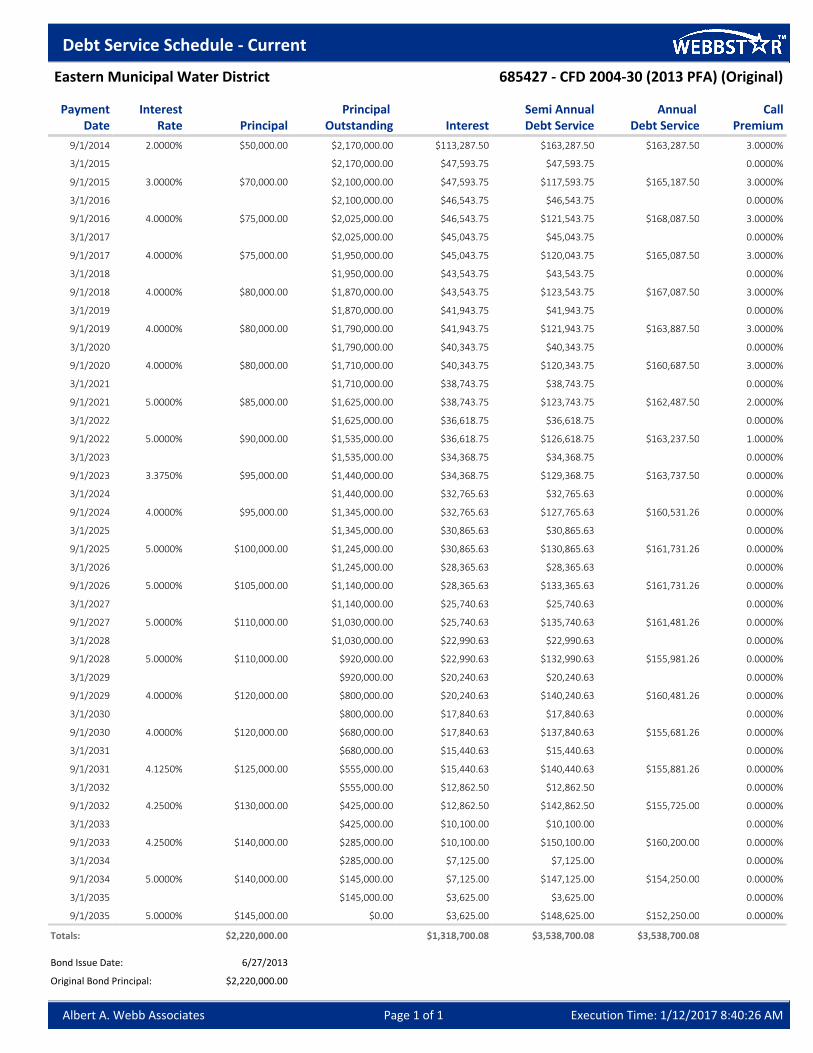
CFD 2004-30 (Barrington Heights)
Project Location: The property within CFD 2004-30 is located in the City of Menifee at the southeast corner of
Tate Road and Tally Road, and contains approximately 172 gross acres. CFD 2004-30 is fully developed and
consists of 193 single family detached homes.
Project Description: The project includes: (i) the acquisition or construction of certain water and sewer system
improvements by or for the District that are required in order to provide water and sewer service to the
property within CFD 2004-30 and the acquisition of capacity in improvements provided through the District’s
Sewer Financial Participation Charge Program and (ii) the acquisition or construction of certain park
improvements by or for Valley-Wide Recreation & Park District.
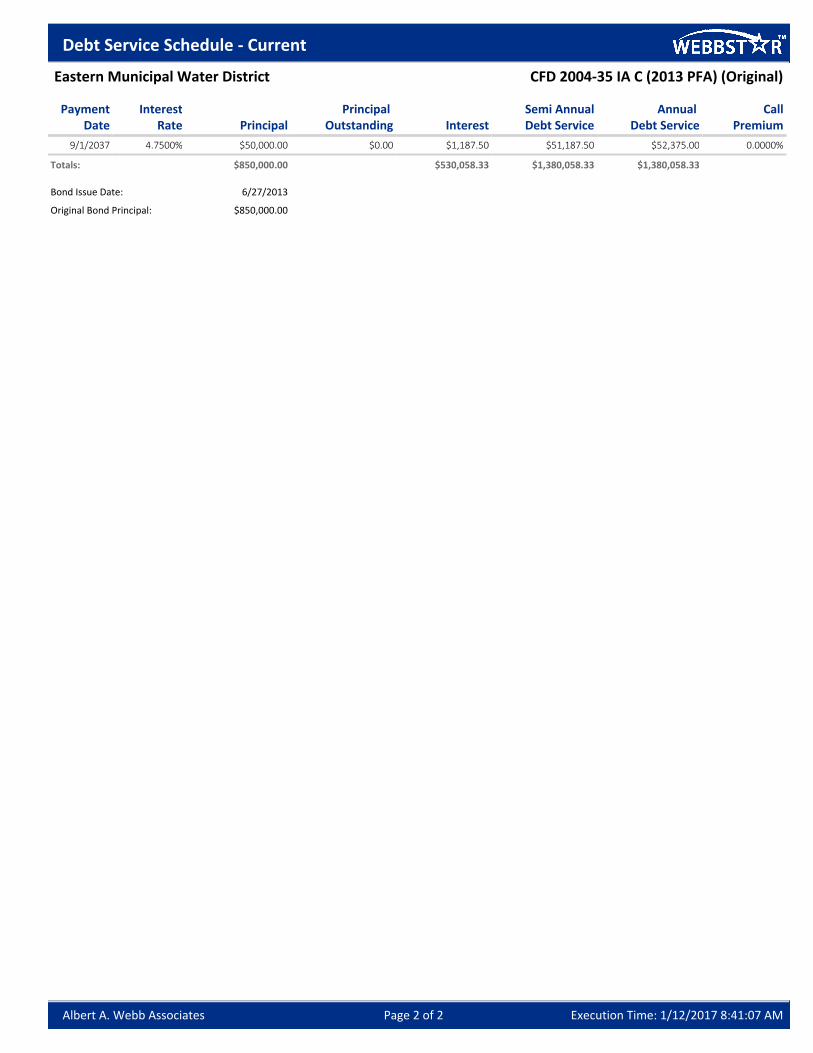
CFD 2004-35 IA C (Mountain Gate)
Project Location: The property within Improvement Area C of CFD 2004-35 is located on the west side of San
Jacinto Avenue, just south of the Ramona Expressway in the City of San Jacinto, and contains approximately 20
acres. CFD 2004-35 IA C is fully developed and consists of 77 single family detached homes.
Project Description: The project includes the acquisition of capacity in the water and sewer systems of the
District, both onsite and off-site, and all appurtenances and appurtenant work in connection with the foregoing,
including the cost of engineering, planning, designing, materials testing, coordination, construction staking,
construction management and supervision for the improvements and any other expense incidental to the
construction, acquisition, modification, expansion or rehabilitation of such improvements.
CFD 2004-36 (Adeline’s Farm)
Project Location: The property within CFD 2004-36 is located in an unincorporated area of Riverside County,
north of Benton Road, between Pourroy Road and Washington Street, and is comprised of approximately 137
gross acres. CFD 2004-36 is fully developed and consists of 371 single family detached homes.
Project Description: The project includes the construction, purchase, modification, expansion, improvement or
rehabilitation of water and sewer facilities including the acquisition of capacity in the water and sewer systems
of the District, both onsite and offsite, and all appurtenances and appurtenant work in connection with the
foregoing.
Page 8
Section 1 District Profile
Western Riverside Water and Wastewater Financing Authority, Local Agency Revenue Refunding Bonds, 2013 Series A-1 and A-2
Annual Disclosure Report for Fiscal Year Ending June 30, 2018
6
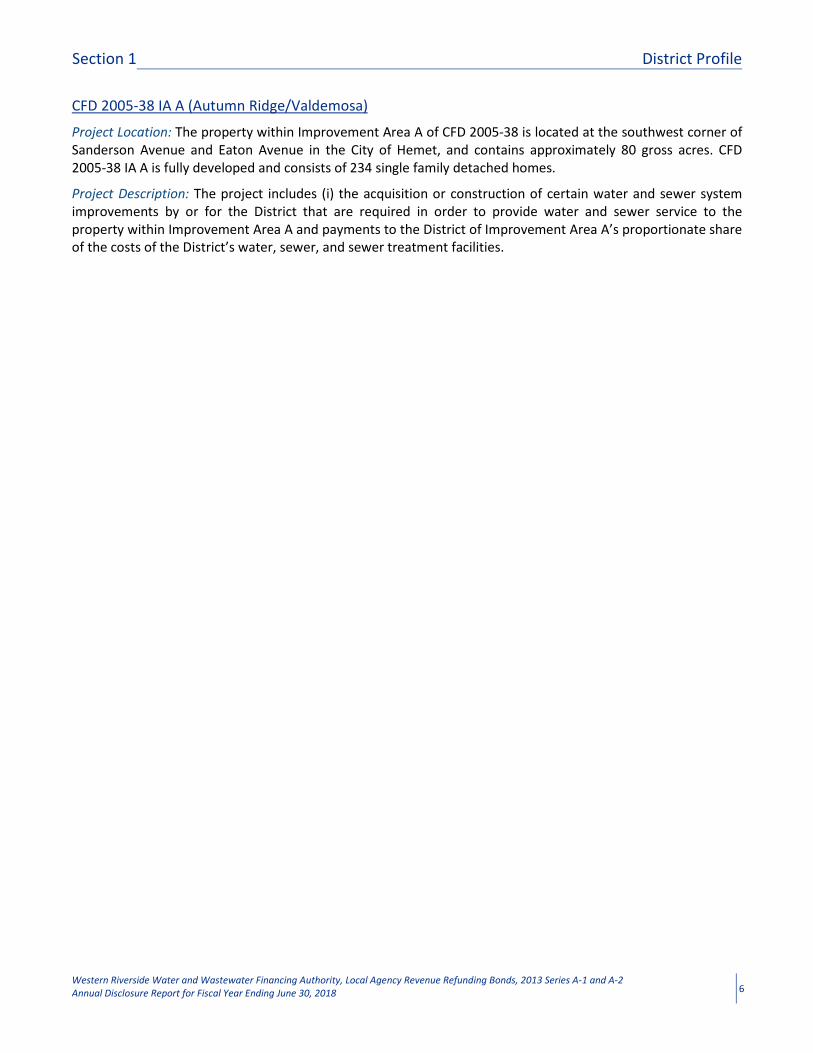
CFD 2005-38 IA A (Autumn Ridge/Valdemosa)
Project Location: The property within Improvement Area A of CFD 2005-38 is located at the southwest corner of
Sanderson Avenue and Eaton Avenue in the City of Hemet, and contains approximately 80 gross acres. CFD
2005-38 IA A is fully developed and consists of 234 single family detached homes.
Project Description: The project includes (i) the acquisition or construction of certain water and sewer system
improvements by or for the District that are required in order to provide water and sewer service to the
property within Improvement Area A and payments to the District of Improvement Area A’s proportionate share
of the costs of the District’s water, sewer, and sewer treatment facilities.
Page 9
Section 1 District Profile
Western Riverside Water and Wastewater Financing Authority, Local Agency Revenue Refunding Bonds, 2013 Series A-1 and A-2
Annual Disclosure Report for Fiscal Year Ending June 30, 2018
7
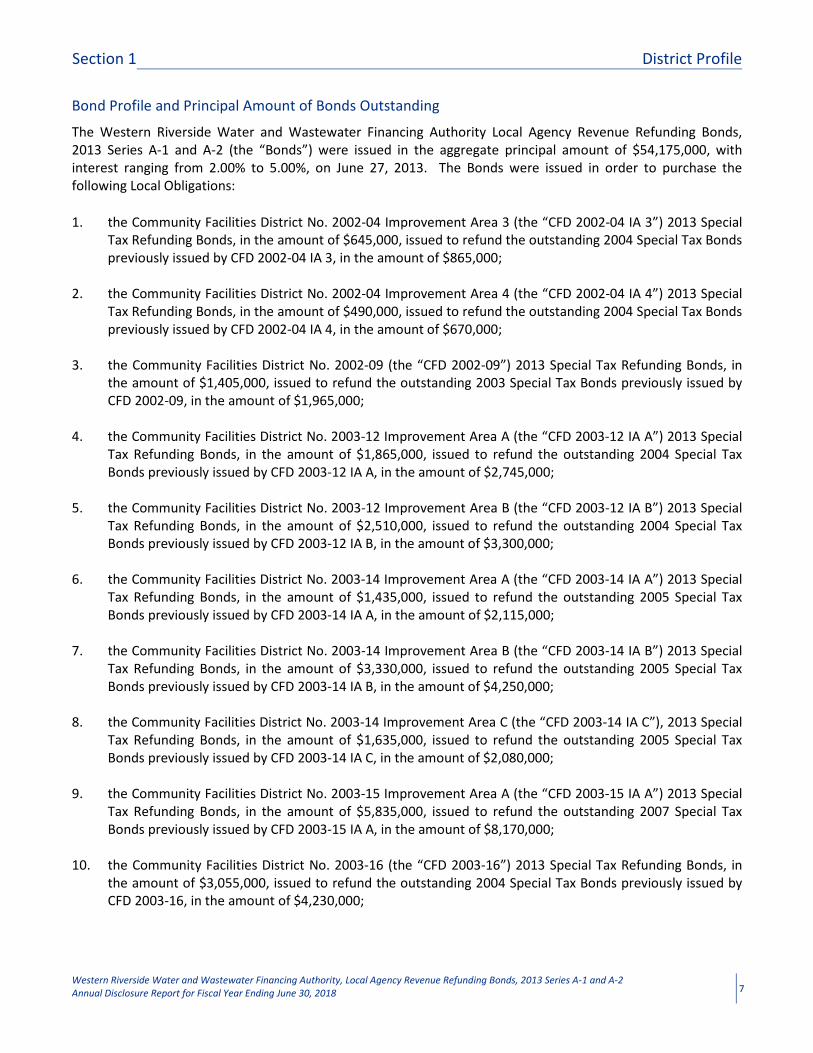
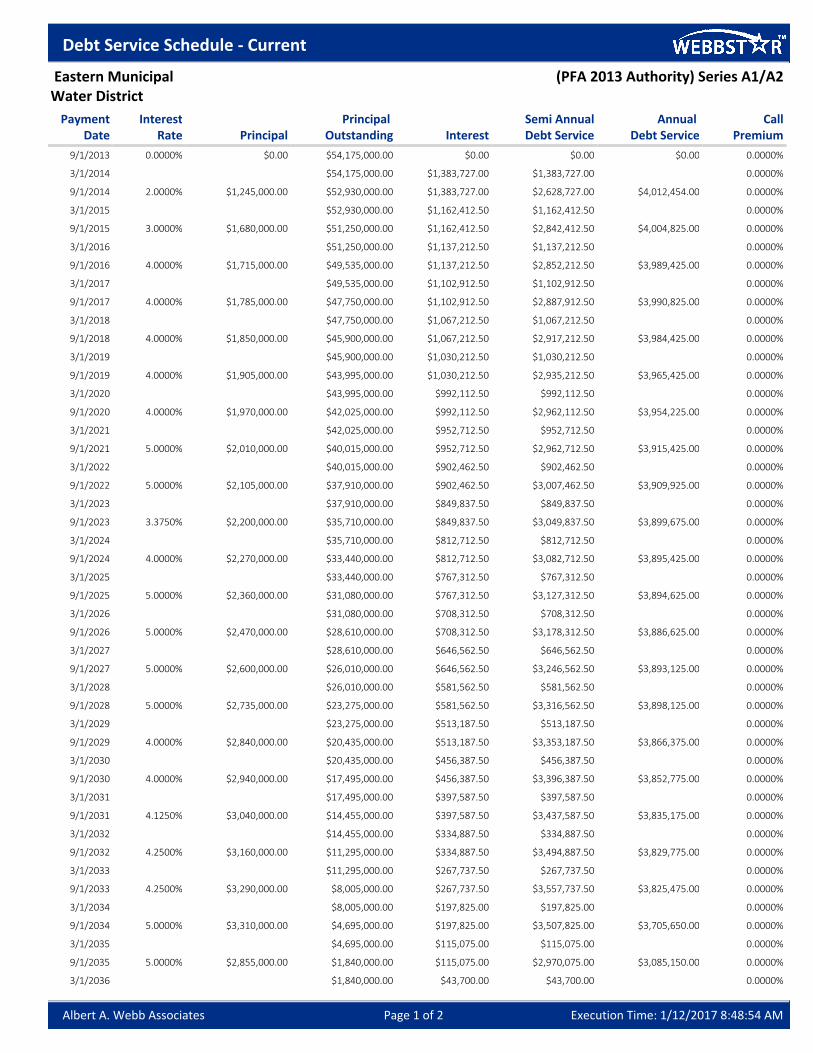
Bond Profile and Principal Amount of Bonds Outstanding
The Western Riverside Water and Wastewater Financing Authority Local Agency Revenue Refunding Bonds,
2013 Series A-1 and A-2 (the “Bonds”) were issued in the aggregate principal amount of $54,175,000, with
interest ranging from 2.00% to 5.00%, on June 27, 2013. The Bonds were issued in order to purchase the
following Local Obligations:
1. the Community Facilities District No. 2002-04 Improvement Area 3 (the “CFD 2002-04 IA 3”) 2013 Special
Tax Refunding Bonds, in the amount of $645,000, issued to refund the outstanding 2004 Special Tax Bonds
previously issued by CFD 2002-04 IA 3, in the amount of $865,000;
2. the Community Facilities District No. 2002-04 Improvement Area 4 (the “CFD 2002-04 IA 4”) 2013 Special
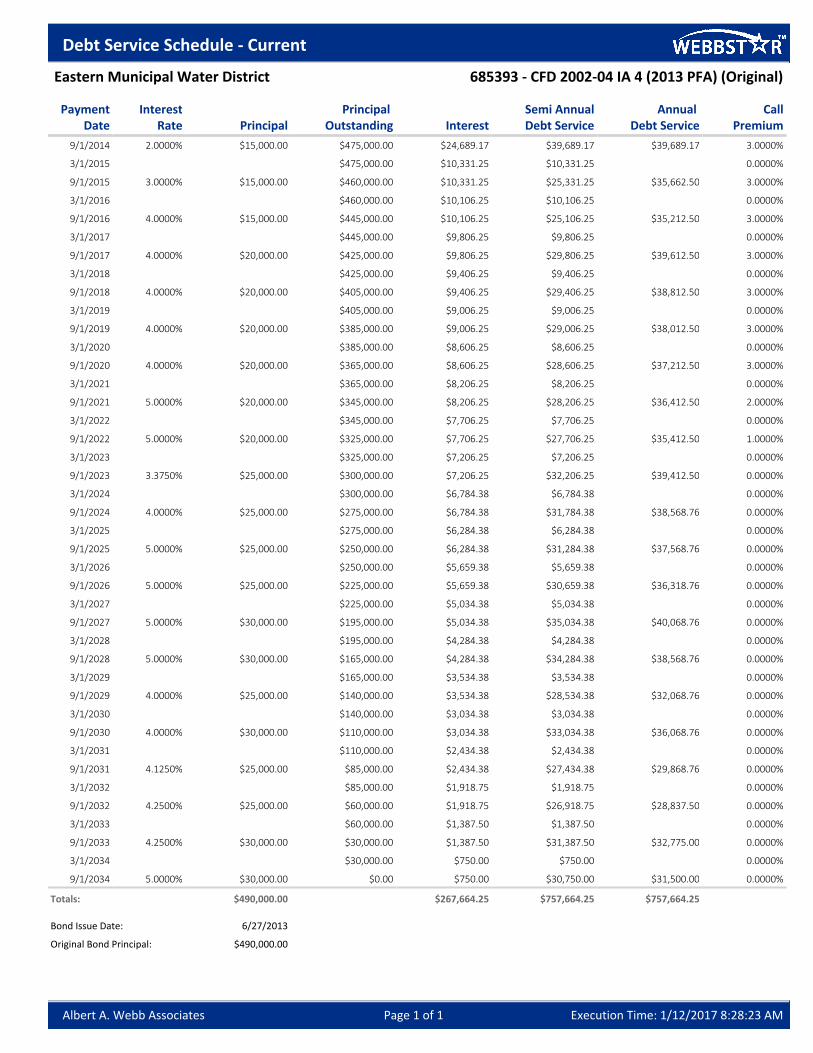
Tax Refunding Bonds, in the amount of $490,000, issued to refund the outstanding 2004 Special Tax Bonds
previously issued by CFD 2002-04 IA 4, in the amount of $670,000;
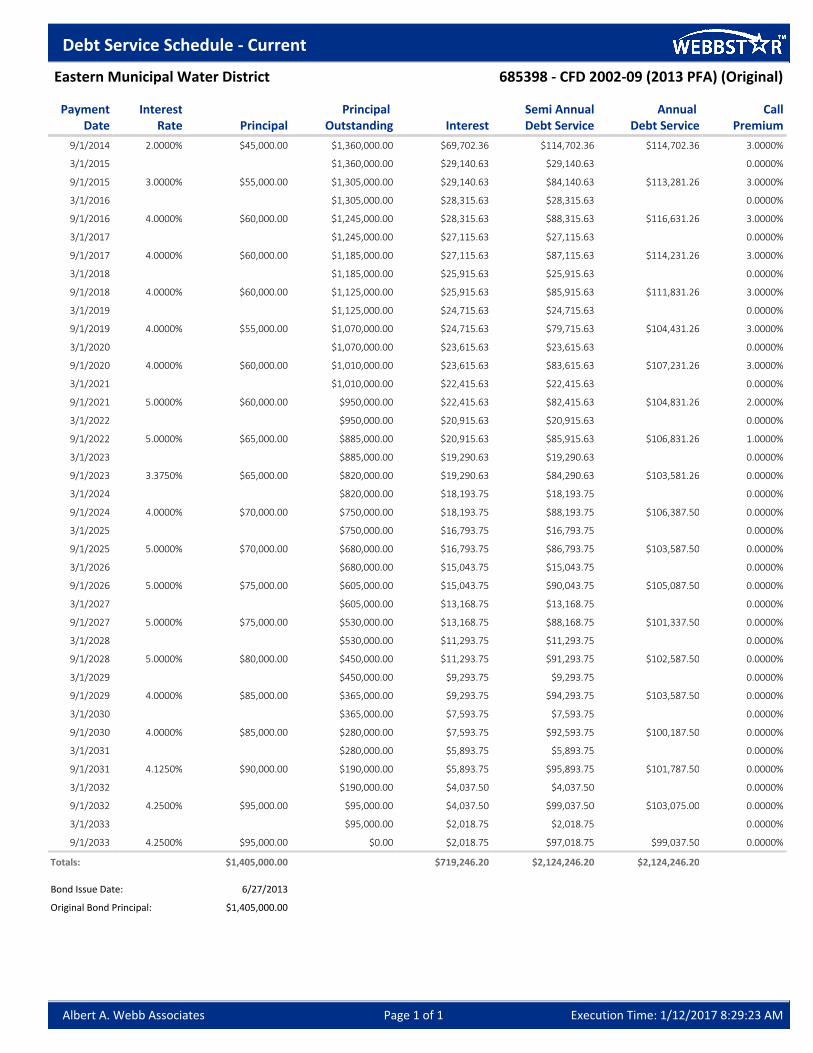
3. the Community Facilities District No. 2002-09 (the “CFD 2002-09”) 2013 Special Tax Refunding Bonds, in
the amount of $1,405,000, issued to refund the outstanding 2003 Special Tax Bonds previously issued by
CFD 2002-09, in the amount of $1,965,000;
4. the Community Facilities District No. 2003-12 Improvement Area A (the “CFD 2003-12 IA A”) 2013 Special
Tax Refunding Bonds, in the amount of $1,865,000, issued to refund the outstanding 2004 Special Tax
Bonds previously issued by CFD 2003-12 IA A, in the amount of $2,745,000;
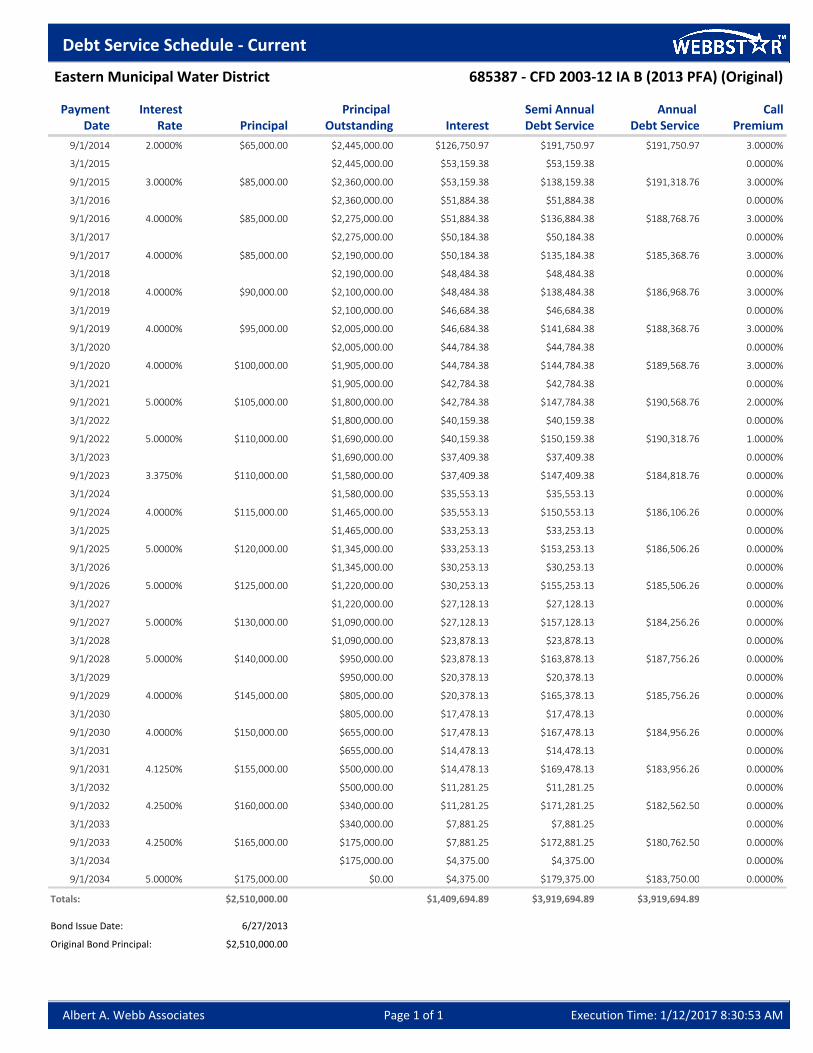
5. the Community Facilities District No. 2003-12 Improvement Area B (the “CFD 2003-12 IA B”) 2013 Special
Tax Refunding Bonds, in the amount of $2,510,000, issued to refund the outstanding 2004 Special Tax
Bonds previously issued by CFD 2003-12 IA B, in the amount of $3,300,000;
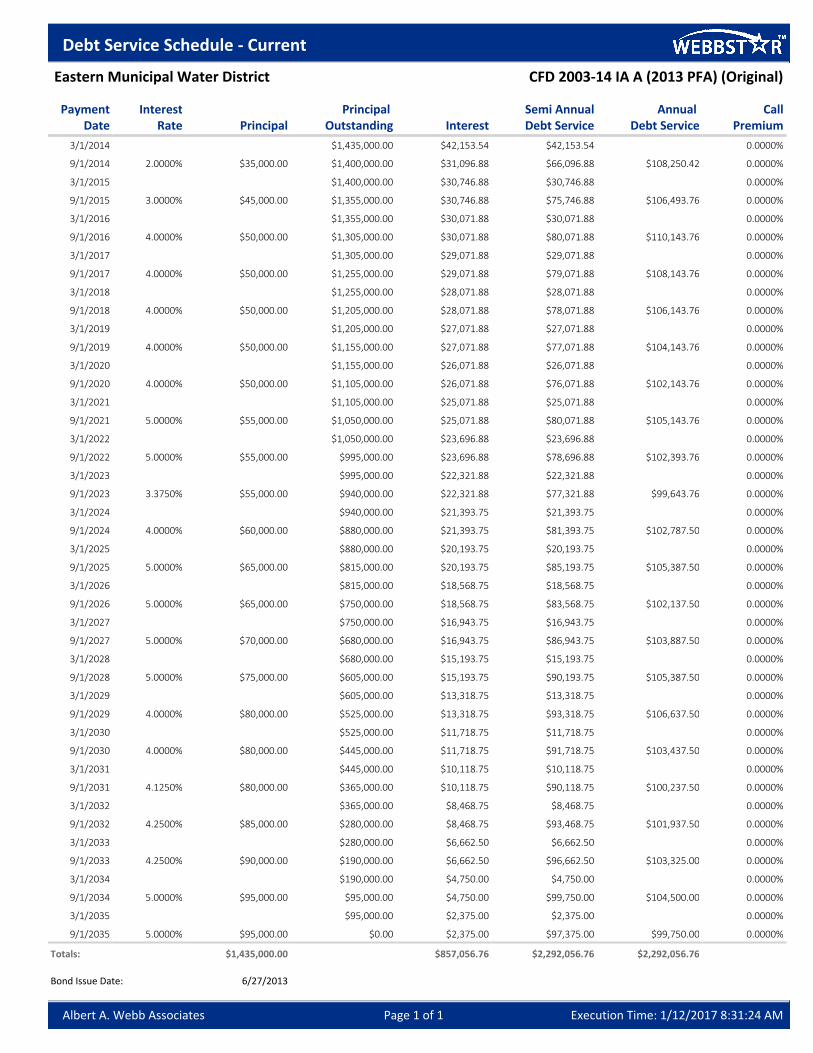
6. the Community Facilities District No. 2003-14 Improvement Area A (the “CFD 2003-14 IA A”) 2013 Special
Tax Refunding Bonds, in the amount of $1,435,000, issued to refund the outstanding 2005 Special Tax
Bonds previously issued by CFD 2003-14 IA A, in the amount of $2,115,000;
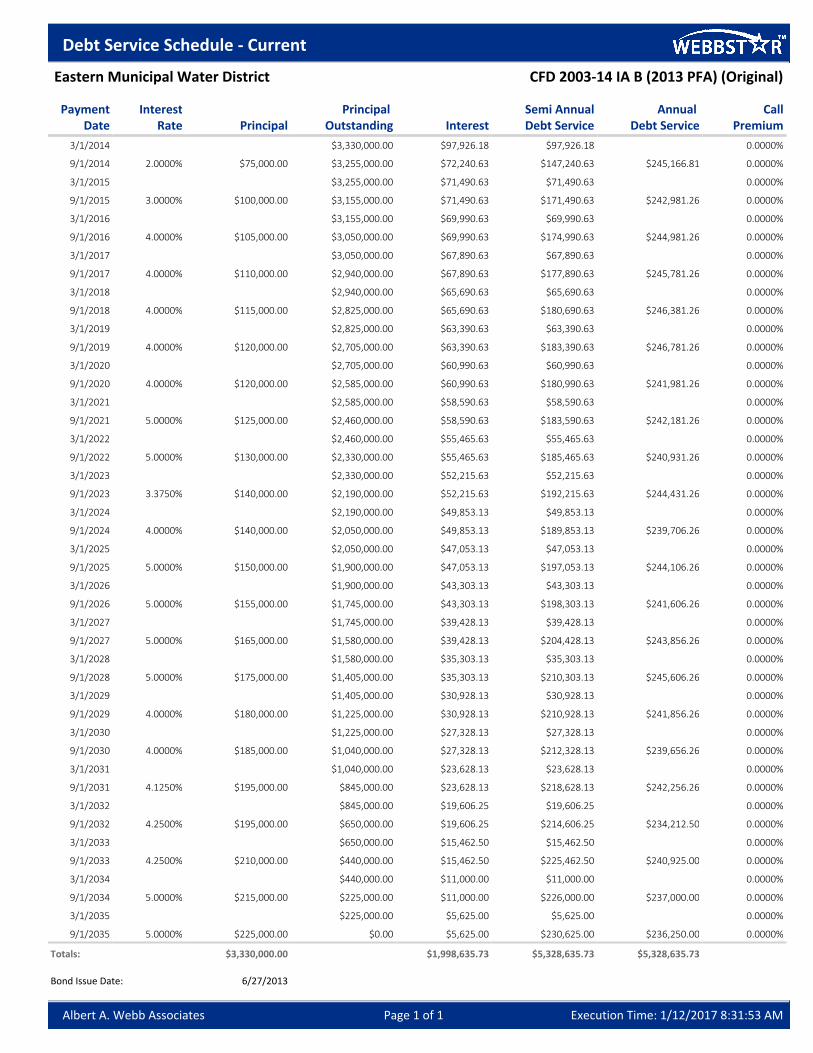
7. the Community Facilities District No. 2003-14 Improvement Area B (the “CFD 2003-14 IA B”) 2013 Special
Tax Refunding Bonds, in the amount of $3,330,000, issued to refund the outstanding 2005 Special Tax
Bonds previously issued by CFD 2003-14 IA B, in the amount of $4,250,000;
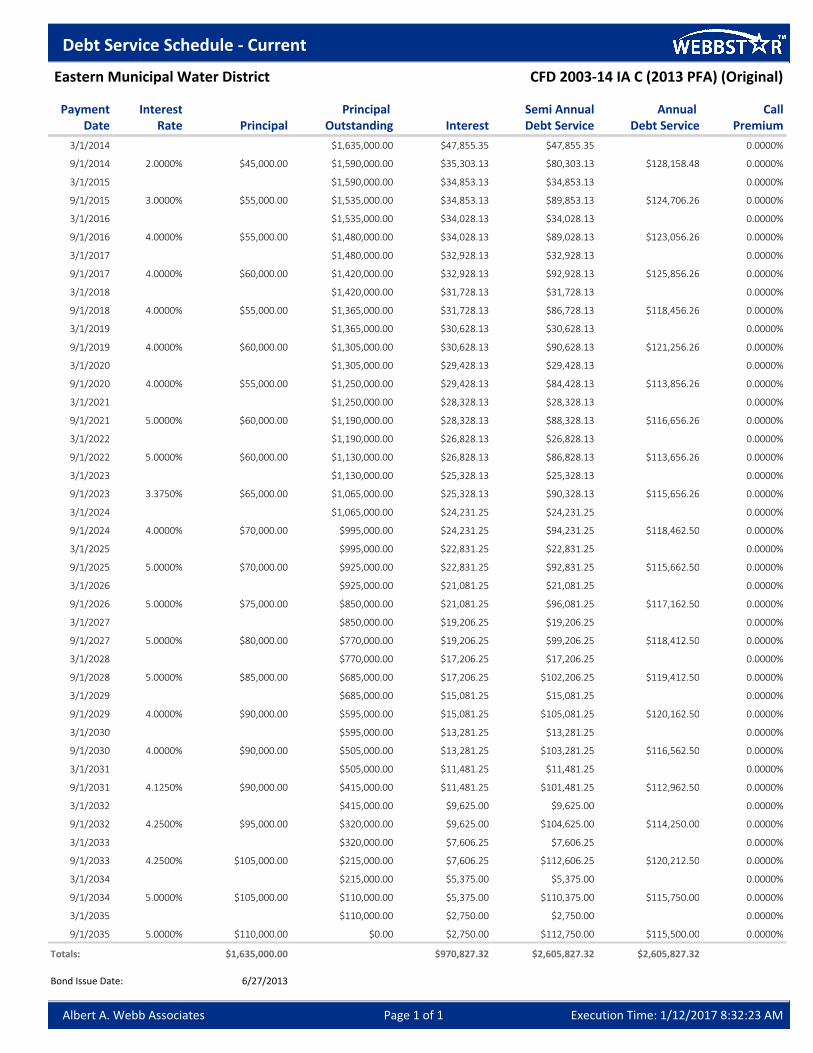
8. the Community Facilities District No. 2003-14 Improvement Area C (the “CFD 2003-14 IA C”), 2013 Special
Tax Refunding Bonds, in the amount of $1,635,000, issued to refund the outstanding 2005 Special Tax
Bonds previously issued by CFD 2003-14 IA C, in the amount of $2,080,000;
9. the Community Facilities District No. 2003-15 Improvement Area A (the “CFD 2003-15 IA A”) 2013 Special
Tax Refunding Bonds, in the amount of $5,835,000, issued to refund the outstanding 2007 Special Tax
Bonds previously issued by CFD 2003-15 IA A, in the amount of $8,170,000;
10. the Community Facilities District No. 2003-16 (the “CFD 2003-16”) 2013 Special Tax Refunding Bonds, in
the amount of $3,055,000, issued to refund the outstanding 2004 Special Tax Bonds previously issued by
CFD 2003-16, in the amount of $4,230,000;
Page 10
Section 1 District Profile
Western Riverside Water and Wastewater Financing Authority, Local Agency Revenue Refunding Bonds, 2013 Series A-1 and A-2
Annual Disclosure Report for Fiscal Year Ending June 30, 2018
8
11. the Community Facilities District No. 2003-19 Improvement Area A (the “CFD 2003-19 IA A”) 2013 Special
Tax Refunding Bonds, in the amount of $2,035,000, issued to refund the outstanding 2005 Special Tax
Bonds previously issued by CFD 2003-19 IA A, in the amount of $2,605,000;
12. the Community Facilities District No. 2003-19 Improvement Area B (the “CFD 2003-19 IA B”) 2013 Special
Tax Refunding Bonds, in the amount of $3,705,000, issued to refund the outstanding 2005 Special Tax
Bonds previously issued by CFD 2003-19 IA B, in the amount of $5,190,000;
13. the Community Facilities District No. 2003-20 Improvement Area A (the “CFD 2003-20 IA A”) 2013 Special
Tax Refunding Bonds, in the amount of $1,405,000, issued to refund the outstanding 2005 Special Tax
Bonds previously issued by CFD 2003-20 IA A, in the amount of $1,800,000;
14. the Community Facilities District No. 2003-25 Improvement Area D (the “CFD 2003-25 IA D”) 2013 Special
Tax Refunding Bonds, in the amount of $3,070,000, issued to refund the outstanding 2006 Special Tax
Bonds previously issued by CFD 2003-25 IA D, in the amount of $3,975,000;
15. the Community Facilities District No. 2004-26 Improvement Area 1 (the “CFD 2004-26 IA 1”) 2013 Special
Tax Refunding Bonds, in the amount of $4,675,000, issued to refund the outstanding 2005 Special Tax
Bonds previously issued by CFD 2004-26 IA 1, in the amount of $6,000,000;
16. the Community Facilities District No. 2004-26 Improvement Area 2 (the “CFD 2004-26 IA 2”) 2013 Special
Tax Refunding Bonds, in the amount of $2,780,000, issued to refund the outstanding 2005 Special Tax
Bonds previously issued by CFD 2004-26 IA 2, in the amount of $3,500,000;
17. the Community Facilities District No. 2004-28 (the “CFD 2004-28”) 2013 Special Tax Refunding Bonds, in
the amount of $3,735,000, issued to refund the outstanding 2005 Special Tax Bonds previously issued by
CFD 2004-28, in the amount of $4,700,000;
18. the Community Facilities District No. 2004-30 (the “CFD 2004-30”) 2013 Special Tax Refunding Bonds, in
the amount of $2,220,000, issued to refund the outstanding 2005 Special Tax Bonds previously issued by
CFD 2004-30, in the amount of $2,815,000;
19. the Community Facilities District No. 2004-35 Improvement Area C (the “CFD 2004-35 IA C”) 2013 Special
Tax Refunding Bonds, in the amount of $850,000, issued to refund the outstanding 2007 Special Tax Bonds
previously issued by CFD 2004-35 IA C, in the amount of $1,180,000;
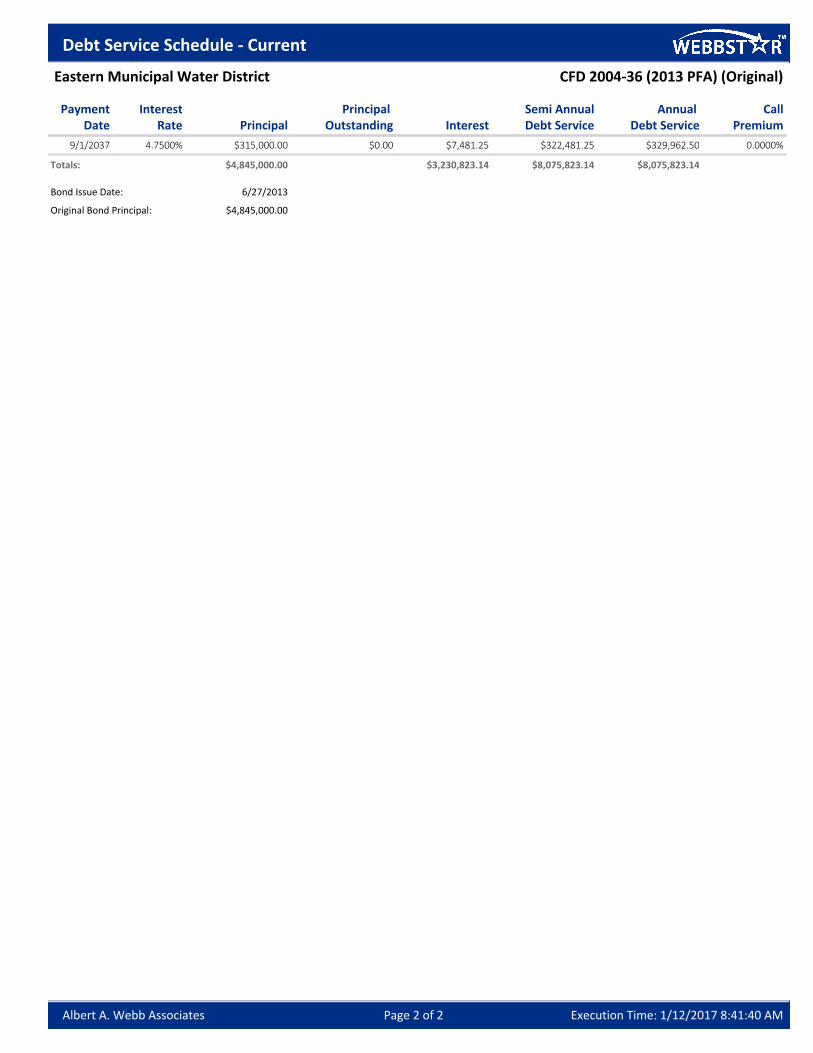
20. the Community Facilities District No. 2004-36 (the “CFD 2004-36”) 2013 Special Tax Refunding Bonds, in
the amount of $4,845,000, issued to refund the outstanding 2007 Special Tax Bonds previously issued by
CFD 2004-36, in the amount of $5,675,000; and
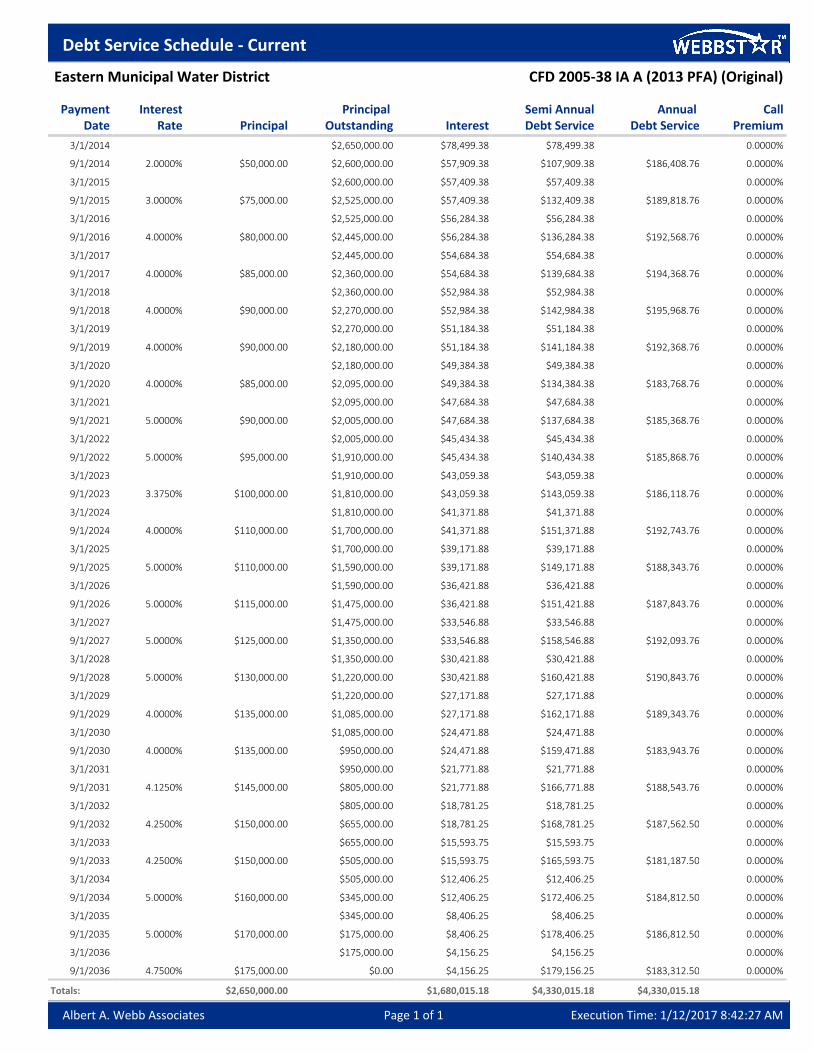
21. the Community Facilities District No. 2005-38 Improvement Area A (the “CFD 2005-38 IA A”) 2013 Special
Tax Refunding Bonds, in the amount of $2,650,000, issued to refund the outstanding 2006 Special Tax
Bonds previously issued by CFD 2005-38 IA A, in the amount of $3,750,000.
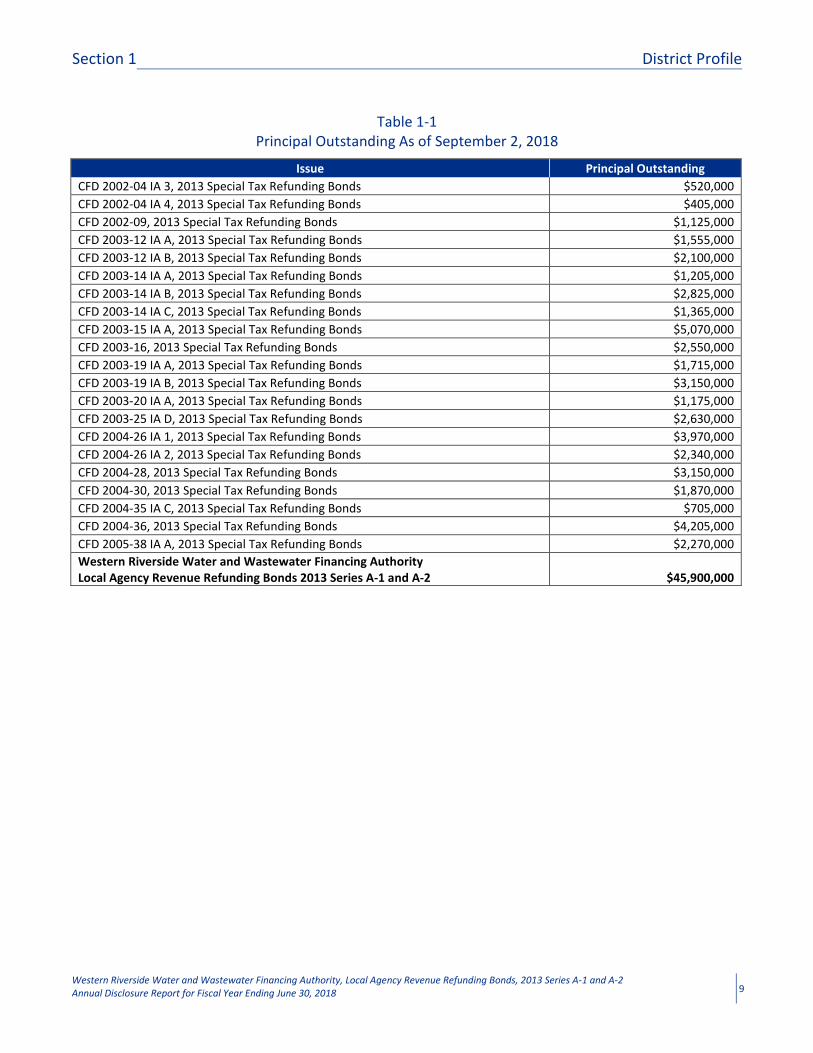
Interest on the Bonds is payable semi-annually on March 1 and September 1. The final maturity of the Bonds is
September 1, 2035 and September 1, 2037 for Series A-1 and A-2, respectively. The principal amount of Bonds
outstanding as of September 2, 2018, are presented in Table 1-1.
Page 11
Section 1 District Profile
Western Riverside Water and Wastewater Financing Authority, Local Agency Revenue Refunding Bonds, 2013 Series A-1 and A-2
Annual Disclosure Report for Fiscal Year Ending June 30, 2018
9
Table 1-1
Principal Outstanding As of September 2, 2018
Issue Principal Outstanding
CFD 2002-04 IA 3, 2013 Special Tax Refunding Bonds $520,000
CFD 2002-04 IA 4, 2013 Special Tax Refunding Bonds $405,000
CFD 2002-09, 2013 Special Tax Refunding Bonds $1,125,000
CFD 2003-12 IA A, 2013 Special Tax Refunding Bonds $1,555,000
CFD 2003-12 IA B, 2013 Special Tax Refunding Bonds $2,100,000
CFD 2003-14 IA A, 2013 Special Tax Refunding Bonds $1,205,000
CFD 2003-14 IA B, 2013 Special Tax Refunding Bonds $2,825,000
CFD 2003-14 IA C, 2013 Special Tax Refunding Bonds $1,365,000
CFD 2003-15 IA A, 2013 Special Tax Refunding Bonds $5,070,000
CFD 2003-16, 2013 Special Tax Refunding Bonds $2,550,000
CFD 2003-19 IA A, 2013 Special Tax Refunding Bonds $1,715,000
CFD 2003-19 IA B, 2013 Special Tax Refunding Bonds $3,150,000
CFD 2003-20 IA A, 2013 Special Tax Refunding Bonds $1,175,000
CFD 2003-25 IA D, 2013 Special Tax Refunding Bonds $2,630,000
CFD 2004-26 IA 1, 2013 Special Tax Refunding Bonds $3,970,000
CFD 2004-26 IA 2, 2013 Special Tax Refunding Bonds $2,340,000
CFD 2004-28, 2013 Special Tax Refunding Bonds $3,150,000
CFD 2004-30, 2013 Special Tax Refunding Bonds $1,870,000
CFD 2004-35 IA C, 2013 Special Tax Refunding Bonds $705,000
CFD 2004-36, 2013 Special Tax Refunding Bonds $4,205,000
CFD 2005-38 IA A, 2013 Special Tax Refunding Bonds $2,270,000
Western Riverside Water and Wastewater Financing Authority
Local Agency Revenue Refunding Bonds 2013 Series A-1 and A-2 $45,900,000
Page 12
Section 2 Fund Information
Western Riverside Water and Wastewater Financing Authority, Local Agency Revenue Refunding Bonds, 2013 Series A-1 and A-2
Annual Disclosure Report for Fiscal Year Ending June 30, 2018
10
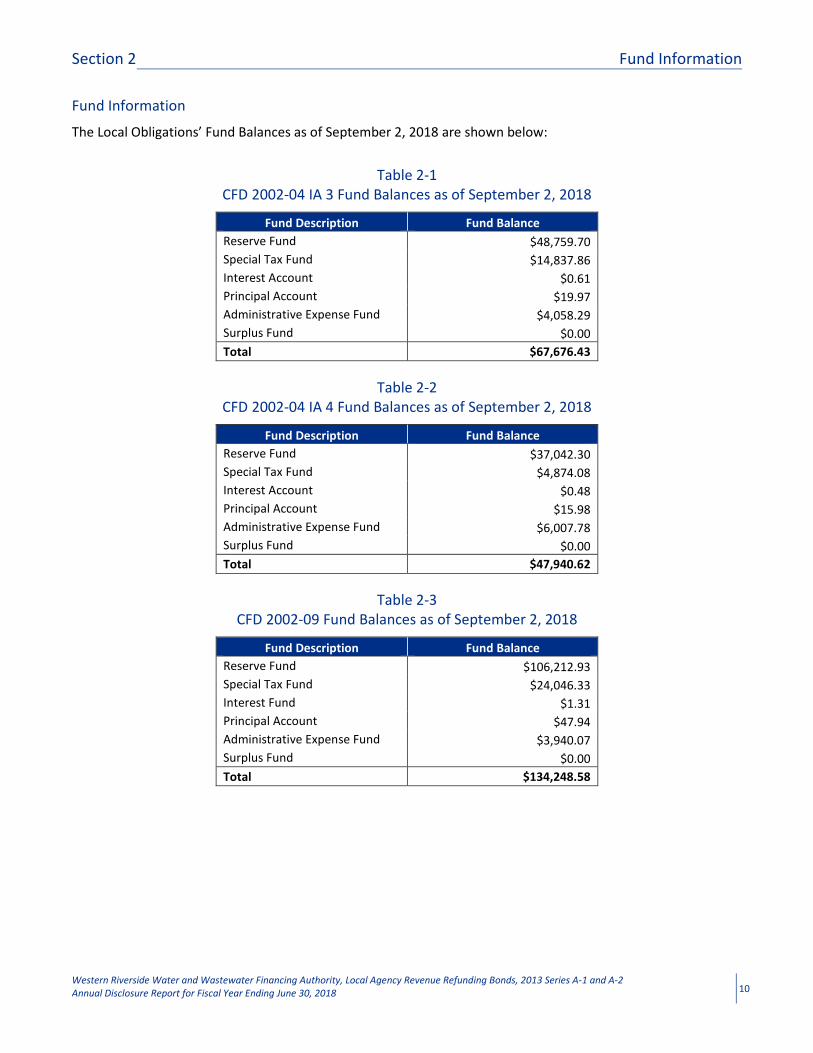
Fund Information
The Local Obligations’ Fund Balances as of September 2, 2018 are shown below:
Table 2-1
CFD 2002-04 IA 3 Fund Balances as of September 2, 2018
Fund Description Fund Balance
Reserve Fund $48,759.70
Special Tax Fund $14,837.86
Interest Account $0.61
Principal Account $19.97
Administrative Expense Fund $4,058.29
Surplus Fund $0.00
Total $67,676.43
Table 2-2
CFD 2002-04 IA 4 Fund Balances as of September 2, 2018
Fund Description Fund Balance
Reserve Fund $37,042.30
Special Tax Fund $4,874.08
Interest Account $0.48
Principal Account $15.98
Administrative Expense Fund $6,007.78
Surplus Fund $0.00
Total $47,940.62
Table 2-3
CFD 2002-09 Fund Balances as of September 2, 2018
Fund Description Fund Balance
Reserve Fund $106,212.93
Special Tax Fund $24,046.33
Interest Fund $1.31
Principal Account $47.94
Administrative Expense Fund $3,940.07
Surplus Fund $0.00
Total $134,248.58
Page 13
Section 2 Fund Information
Western Riverside Water and Wastewater Financing Authority, Local Agency Revenue Refunding Bonds, 2013 Series A-1 and A-2
Annual Disclosure Report for Fiscal Year Ending June 30, 2018
11
Table 2-4
CFD 2003-12 IA A Fund Balances as of September 2, 2018
Fund Description Fund Balance
Reserve Fund $140,987.33
Special Tax Fund $37,282.54
Interest Account $1.82
Principal Account $55.93
Administrative Expense Fund $4,136.39
Surplus Fund $0.00
Total $182,464.01
Table 2-5
CFD 2003-12 IA B Fund Balances as of September 2, 2018
Fund Description Fund Balance
Reserve Fund $189,747.07
Special Tax Fund $49,428.02
Interest Account $2.45
Principal Account $71.91
Administrative Expense Fund $4,376.33
Surplus Fund $0.00
Total $243,625.78
Table 2-6
CFD 2003-14 IA A Fund Balances as of September 2, 2018
Fund Description Fund Balance
Reserve Fund $108,480.78
Special Tax Fund $49,675.88
Interest Account $1.42
Principal Account $39.95
Administrative Expense Fund $3,916.41
Surplus Fund $0.00
Total $162,114.44
Table 2-7
CFD 2003-14 IA B Fund Balances as of September 2, 2018
Fund Description Fund Balance
Reserve Fund $251,736.14
Special Tax Fund $88,177.71
Interest Account $3.32
Principal Account $91.88
Administrative Expense Fund $4,349.47
Surplus Fund $0.00
Total $344,358.52
Page 14
Section 2 Fund Information
Western Riverside Water and Wastewater Financing Authority, Local Agency Revenue Refunding Bonds, 2013 Series A-1 and A-2
Annual Disclosure Report for Fiscal Year Ending June 30, 2018
12
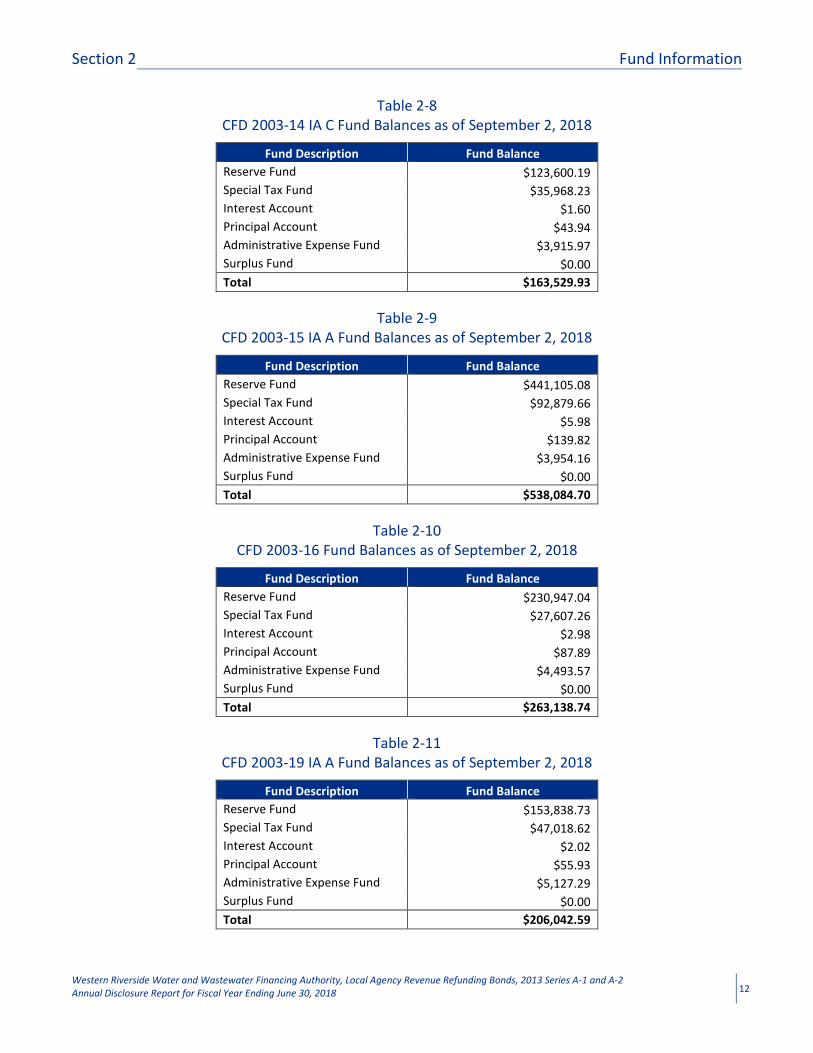
Table 2-8
CFD 2003-14 IA C Fund Balances as of September 2, 2018
Fund Description Fund Balance
Reserve Fund $123,600.19
Special Tax Fund $35,968.23
Interest Account $1.60
Principal Account $43.94
Administrative Expense Fund $3,915.97
Surplus Fund $0.00
Total $163,529.93
Table 2-9
CFD 2003-15 IA A Fund Balances as of September 2, 2018
Fund Description Fund Balance
Reserve Fund $441,105.08
Special Tax Fund $92,879.66
Interest Account $5.98
Principal Account $139.82
Administrative Expense Fund $3,954.16
Surplus Fund $0.00
Total $538,084.70
Table 2-10
CFD 2003-16 Fund Balances as of September 2, 2018
Fund Description Fund Balance
Reserve Fund $230,947.04
Special Tax Fund $27,607.26
Interest Account $2.98
Principal Account $87.89
Administrative Expense Fund $4,493.57
Surplus Fund $0.00
Total $263,138.74
Table 2-11
CFD 2003-19 IA A Fund Balances as of September 2, 2018
Fund Description Fund Balance
Reserve Fund $153,838.73
Special Tax Fund $47,018.62
Interest Account $2.02
Principal Account $55.93
Administrative Expense Fund $5,127.29
Surplus Fund $0.00
Total $206,042.59
Page 15
Section 2 Fund Information
Western Riverside Water and Wastewater Financing Authority, Local Agency Revenue Refunding Bonds, 2013 Series A-1 and A-2
Annual Disclosure Report for Fiscal Year Ending June 30, 2018
13
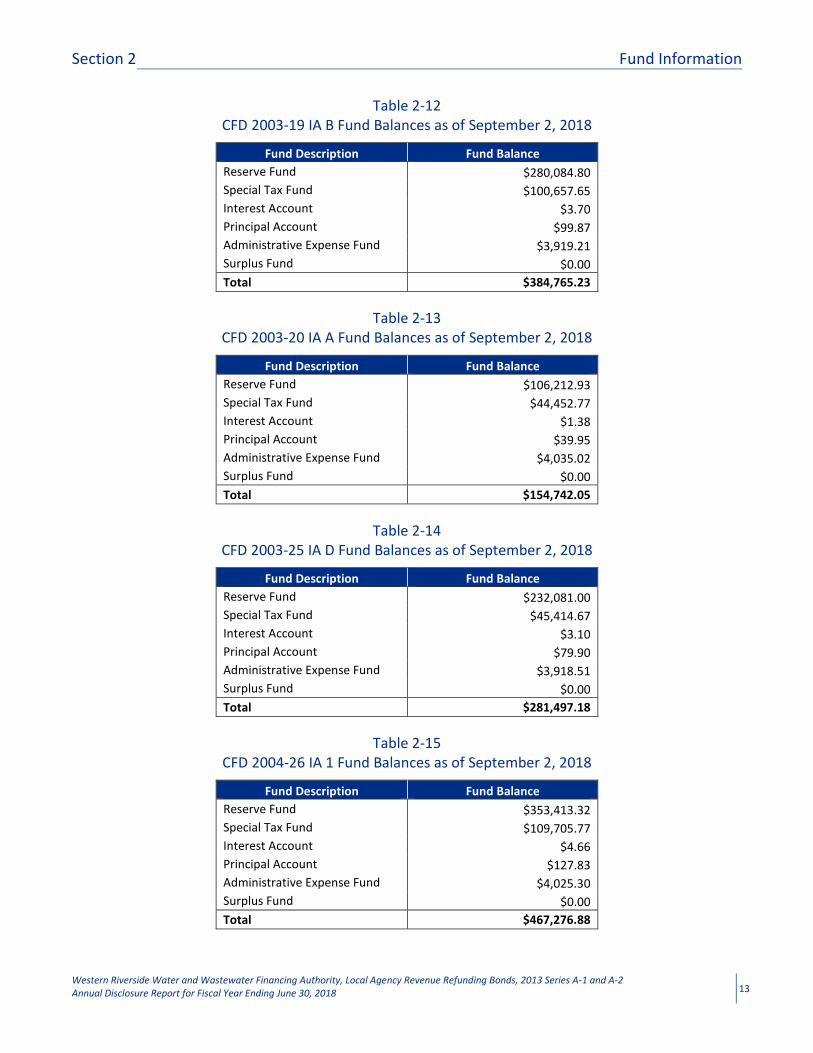
Table 2-12
CFD 2003-19 IA B Fund Balances as of September 2, 2018
Fund Description Fund Balance
Reserve Fund $280,084.80
Special Tax Fund $100,657.65
Interest Account $3.70
Principal Account $99.87
Administrative Expense Fund $3,919.21
Surplus Fund $0.00
Total $384,765.23
Table 2-13
CFD 2003-20 IA A Fund Balances as of September 2, 2018
Fund Description Fund Balance
Reserve Fund $106,212.93
Special Tax Fund $44,452.77
Interest Account $1.38
Principal Account $39.95
Administrative Expense Fund $4,035.02
Surplus Fund $0.00
Total $154,742.05
Table 2-14
CFD 2003-25 IA D Fund Balances as of September 2, 2018
Fund Description Fund Balance
Reserve Fund $232,081.00
Special Tax Fund $45,414.67
Interest Account $3.10
Principal Account $79.90
Administrative Expense Fund $3,918.51
Surplus Fund $0.00
Total $281,497.18
Table 2-15
CFD 2004-26 IA 1 Fund Balances as of September 2, 2018
Fund Description Fund Balance
Reserve Fund $353,413.32
Special Tax Fund $109,705.77
Interest Account $4.66
Principal Account $127.83
Administrative Expense Fund $4,025.30
Surplus Fund $0.00
Total $467,276.88
Page 16
Section 2 Fund Information
Western Riverside Water and Wastewater Financing Authority, Local Agency Revenue Refunding Bonds, 2013 Series A-1 and A-2
Annual Disclosure Report for Fiscal Year Ending June 30, 2018
14
Table 2-16
CFD 2004-26 IA 2 Fund Balances as of September 2, 2018
Fund Description Fund Balance
Reserve Fund $210,158.07
Special Tax Fund $60,177.66
Interest Account $2.75
Principal Account $79.90
Administrative Expense Fund $3,919.51
Surplus Fund $0.00
Total $274,337.89
Table 2-17
CFD 2004-28 Fund Balances as of September 2, 2018
Fund Description Fund Balance
Reserve Fund $282,352.62
Special Tax Fund $58,665.37
Interest Account $3.70
Principal Account $103.87
Administrative Expense Fund $3,943.63
Surplus Fund $0.00
Total $345,069.19
Table 2-18
CFD 2004-30 Fund Balances as of September 2, 2018
Fund Description Fund Balance
Reserve Fund $167,824.10
Special Tax Fund $35,795.48
Interest Account $2.20
Principal Account $63.92
Administrative Expense Fund $3,944.65
Surplus Fund $0.00
Total $207,630.35
Table 2-19
CFD 2004-35 IA C Fund Balances as of September 2, 2018
Fund Description Fund Balance
Reserve Fund $64,256.90
Special Tax Fund $21,956.47
Interest Account $0.83
Principal Account $23.97
Administrative Expense Fund $3,907.65
Surplus Fund $0.00
Total $90,145.82
Page 17
Section 2 Fund Information
Western Riverside Water and Wastewater Financing Authority, Local Agency Revenue Refunding Bonds, 2013 Series A-1 and A-2
Annual Disclosure Report for Fiscal Year Ending June 30, 2018
15
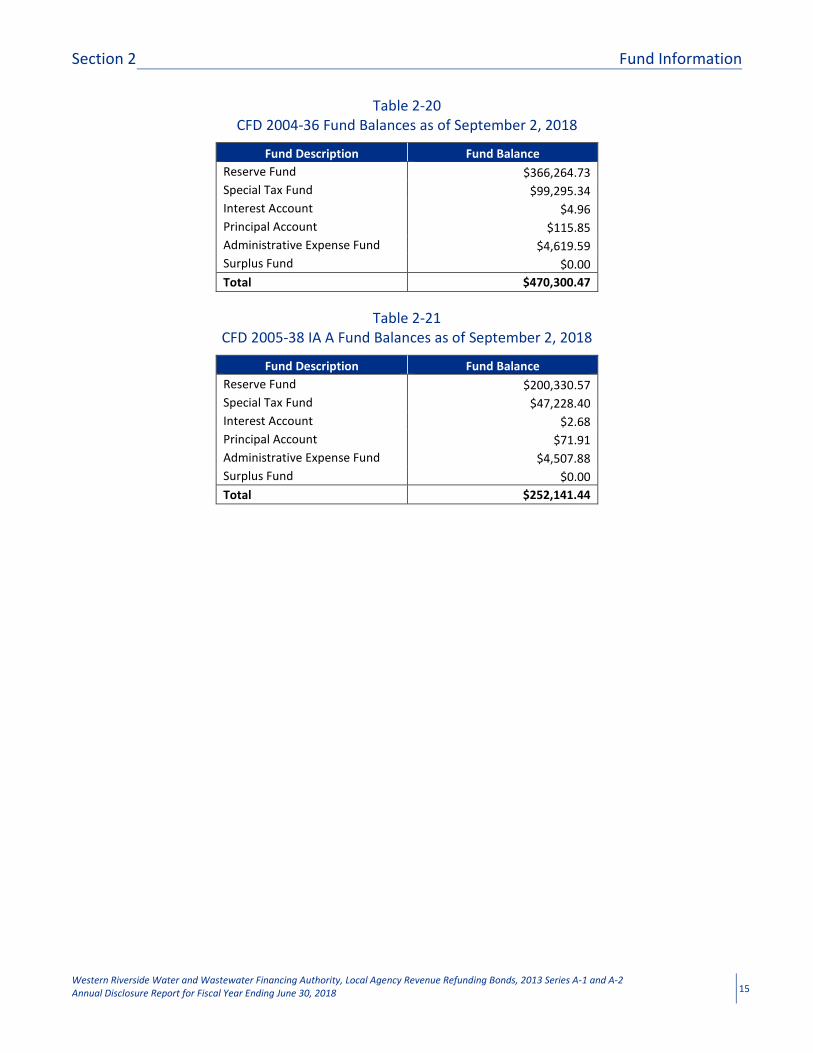
Table 2-20
CFD 2004-36 Fund Balances as of September 2, 2018
Fund Description Fund Balance
Reserve Fund $366,264.73
Special Tax Fund $99,295.34
Interest Account $4.96
Principal Account $115.85
Administrative Expense Fund $4,619.59
Surplus Fund $0.00
Total $470,300.47
Table 2-21
CFD 2005-38 IA A Fund Balances as of September 2, 2018
Fund Description Fund Balance
Reserve Fund $200,330.57
Special Tax Fund $47,228.40
Interest Account $2.68
Principal Account $71.91
Administrative Expense Fund $4,507.88
Surplus Fund $0.00
Total $252,141.44
Page 18
Section 2 Fund Information
Western Riverside Water and Wastewater Financing Authority, Local Agency Revenue Refunding Bonds, 2013 Series A-1 and A-2
Annual Disclosure Report for Fiscal Year Ending June 30, 2018
16
Reserve Fund Requirement and Reserve Fund Balance
The Reserve Fund is established and maintained at the Authority level. The Reserve Fund must be maintained at
the Reserve Requirement, which is defined as; at any date of calculation, an amount equal to the lowest of (i)
10% of the initial principal amount of the Bonds, (ii) maximum annual debt service on the outstanding bonds, or
(iii) 125% of average annual debt service on the Outstanding Bonds. The following table illustrates the Reserve
Requirement and Reserve Account Balance of each CFD, as of September 2, 2018.
Table 2-22
Reserve Requirements and Account Balances
District Reserve Requirement Fund Balance
CFD 2002-04 IA 3 $47,211.80 $48,759.70
CFD 2002-04 IA 4 $35,866.33 $37,042.30
CFD 2002-09 $102,841.20 $106,212.93
CFD 2003-12 IA A $136,511.63 $140,987.33
CFD 2003-12 IA B $183,723.43 $189,747.07
CFD 2003-14 IA A $105,037.10 $108,480.78
CFD 2003-14 IA B $243,744.63 $251,736.14
CFD 2003-14 IA C $119,676.42 $123,600.19
CFD 2003-15 IA A $427,102.07 $441,105.08
CFD 2003-16 $223,615.57 $230,947.04
CFD 2003-19 IA A $148,955.05 $153,838.73
CFD 2003-19 IA B $271,193.35 $280,084.80
CFD 2003-20 IA A $102,841.20 $106,212.93
CFD 2003-25 IA D $224,713.52 $232,081.00
CFD 2004-26 IA 1 $342,194.04 $353,413.32
CFD 2004-26 IA 2 $203,486.51 $210,158.07
CFD 2004-28 $273,389.25 $282,352.62
CFD 2004-30 $162,496.42 $167,824.10
CFD 2004-35 IA C $62,217.10 $64,256.90
CFD 2004-36 $354,637.46 $366,264.73
CFD 2005-38 IA A $193,970.95 $200,330.57
Total $3,965,425.00 $4,095,436.33
The Reserve Fund is fully funded.
Rate and Method of Apportionment
There have been no changes to the Rate and Method of Apportionment of the Special Tax for any CFD included
in the bond refunding.
Prepayment of Special Taxes
There have been no prepayments during Fiscal Year 2017-18 of Special Taxes for any parcel within any CFD
included in the bond refunding.
Page 19
Section 3 Assessed Value Information
Western Riverside Water and Wastewater Financing Authority, Local Agency Revenue Refunding Bonds, 2013 Series A-1 and A-2
Annual Disclosure Report for Fiscal Year Ending June 30, 2018
17
Assessed Valuation History
The assessed valuation history, by CFD, is shown below:
Table 3-1
CFD 2002-04 IA 3 Assessed Valuation History
Fiscal Year
Land Assessed
Value
Improvement Assessed
Value
Total Assessed
Valuation
2009/10 $9,038,000 $29,645,000 $38,683,000
2010/11 $8,786,778 $29,998,099 $38,784,877
2011/12 $8,415,499 $30,187,287 $38,602,786
2012/13 $8,306,466 $30,447,926 $38,754,392
2013/14 $8,267,585 $31,705,007 $39,972,592
2014/15 $9,459,076 $36,432,258 $45,891,334
2015/16 $9,724,110 $37,208,918 $46,933,028
2016/17 $10,253,059 $38,168,205 $48,421,264
2017/18 $10,961,273 $39,874,120 $50,835,393
2018/19 $11,534,392 $40,998,462 $52,532,854
Table 3-2
CFD 2002-04 IA 4 Assessed Valuation History
Fiscal Year
Land Assessed
Value
Improvement Assessed
Value
Total Assessed
Valuation
2009/10 $3,064,000 $9,060,000 $12,124,000
2010/11 $2,920,834 $8,375,608 $11,296,442
2011/12 $2,906,591 $8,252,122 $11,158,713
2012/13 $2,971,118 $8,164,187 $11,135,305
2013/14 $3,194,373 $8,553,726 $11,748,099
2014/15 $3,726,294 $10,088,125 $13,814,419
2015/16 $3,919,086 $10,688,036 $14,607,122
2016/17 $4,167,404 $11,226,024 $15,393,428
2017/18 $4,399,951 $11,728,300 $16,128,251
2018/19 $4,717,748 $12,550,023 $17,267,771
Page 20
Section 3 Assessed Value Information
Western Riverside Water and Wastewater Financing Authority, Local Agency Revenue Refunding Bonds, 2013 Series A-1 and A-2
Annual Disclosure Report for Fiscal Year Ending June 30, 2018
18
Table 3-3
CFD 2002-09 Assessed Valuation History
Fiscal Year
Land Assessed
Value
Improvement Assessed
Value
Total Assessed
Valuation
2009/10 $13,384,392 $45,266,852 $58,651,244
2010/11 $14,102,256 $45,640,644 $59,742,900
2011/12 $13,472,200 $42,432,973 $55,905,173
2012/13 $13,775,592 $42,420,936 $56,196,528
2013/14 $14,284,956 $43,924,467 $58,209,423
2014/15 $16,280,126 $52,522,746 $68,802,872
2015/16 $17,096,894 $56,351,103 $73,447,997
2016/17 $17,760,216 $58,761,994 $76,522,210
2017/18 $18,466,254 $61,793,965 $80,260,219
2018/19 $19,168,729 $65,066,443 $84,235,172
Table 3-4
CFD 2003-12 IA A Assessed Valuation History
Fiscal Year
Land Assessed
Value
Improvement Assessed
Value
Total Assessed
Valuation
2009/10 $9,654,000 $28,592,900 $38,246,900
2010/11 $9,741,047 $30,254,018 $39,995,065
2011/12 $10,192,163 $31,986,439 $42,178,602
2012/13 $9,582,808 $30,168,107 $39,750,915
2013/14 $10,611,750 $33,587,405 $44,199,155
2014/15 $11,899,048 $38,072,962 $49,972,010
2015/16 $12,501,211 $39,704,312 $52,205,523
2016/17 $13,093,421 $41,426,282 $54,519,703
2017/18 $13,775,575 $42,348,991 $56,124,566
2018/19 $14,839,549 $43,858,617 $58,698,166
Table 3-5
CFD 2003-12 IA B Assessed Valuation History
Fiscal Year
Land Assessed
Value
Improvement Assessed
Value
Total Assessed
Valuation
2009/10 $10,275,000 $29,854,000 $40,129,000
2010/11 $9,691,439 $29,991,765 $39,683,204
2011/12 $10,240,118 $32,418,737 $42,658,855
2012/13 $9,953,479 $31,581,965 $41,535,444
2013/14 $10,301,065 $32,661,612 $42,962,677
2014/15 $12,110,635 $38,034,465 $50,145,100
2015/16 $12,399,075 $39,026,747 $51,425,822
2016/17 $13,017,276 $41,086,508 $54,103,784
2017/18 $13,509,815 $41,780,905 $55,290,720
2018/19 $14,283,768 $43,475,093 $57,758,861
Page 21
Section 3 Assessed Value Information
Western Riverside Water and Wastewater Financing Authority, Local Agency Revenue Refunding Bonds, 2013 Series A-1 and A-2
Annual Disclosure Report for Fiscal Year Ending June 30, 2018
19
Table 3-6
CFD 2003-14 IA A Assessed Valuation History
Fiscal Year
Land Assessed
Value
Improvement Assessed
Value
Total Assessed
Valuation
2009/10 $5,689,000 $14,336,740 $20,025,740
2010/11 $5,289,849 $12,429,186 $17,719,035
2011/12 $5,713,905 $13,357,781 $19,071,686
2012/13 $5,464,975 $12,916,785 $18,381,760
2013/14 $5,614,292 $13,533,444 $19,147,736
2014/15 $6,454,780 $16,720,439 $23,175,219
2015/16 $6,502,084 $17,254,459 $23,756,543
2016/17 $6,798,339 $18,904,375 $25,702,714
2017/18 $6,769,912 $20,623,144 $27,393,056
2018/19 $6,820,214 $22,382,331 $29,202,545
Table 3-7
CFD 2003-14 IA B Assessed Valuation History
Fiscal Year
Land Assessed
Value
Improvement Assessed
Value
Total Assessed
Valuation
2009/10 $15,318,033 $31,530,422 $46,848,455
2010/11 $13,325,884 $27,643,409 $40,969,293
2011/12 $13,882,963 $29,117,952 $43,000,915
2012/13 $13,738,389 $29,022,264 $42,760,653
2013/14 $14,732,075 $31,287,223 $46,019,298
2014/15 $16,402,095 $36,307,840 $52,709,935
2015/16 $16,676,902 $37,930,998 $54,607,900
2016/17 $17,198,245 $40,498,145 $57,696,390
2017/18 $17,711,290 $43,897,717 $61,609,007
2018/19 $18,492,460 $46,480,383 $64,972,843
Table 3-8
CFD 2003-14 IA C Assessed Valuation History
Fiscal Year
Land Assessed
Value
Improvement Assessed
Value
Total Assessed
Valuation
2009/10 $7,762,737 $16,578,746 $24,341,483
2010/11 $6,996,662 $15,454,751 $22,451,413
2011/12 $6,853,560 $15,810,097 $22,663,657
2012/13 $6,703,412 $15,461,619 $22,165,031
2013/14 $7,074,859 $16,555,275 $23,630,134
2014/15 $8,150,366 $19,394,474 $27,544,840
2015/16 $8,291,511 $20,560,718 $28,852,229
2016/17 $8,366,515 $21,312,515 $29,679,030
2017/18 $8,714,147 $22,883,468 $31,597,615
2018/19 $9,035,056 $24,110,089 $33,145,145
Page 22
Section 3 Assessed Value Information
Western Riverside Water and Wastewater Financing Authority, Local Agency Revenue Refunding Bonds, 2013 Series A-1 and A-2
Annual Disclosure Report for Fiscal Year Ending June 30, 2018
20
Table 3-9
CFD 2003-15 IA A Assessed Valuation History
Fiscal Year
Land Assessed
Value
Improvement Assessed
Value
Total Assessed
Valuation
2009/10 $12,911,696 $47,961,134 $60,872,830
2010/11 $12,317,986 $47,017,264 $59,335,250
2011/12 $12,587,843 $48,997,068 $61,584,911
2012/13 $13,288,198 $52,823,438 $66,111,636
2013/14 $13,362,629 $54,777,617 $68,140,246
2014/15 $14,835,230 $60,966,783 $75,802,013
2015/16 $16,361,663 $66,306,008 $82,667,671
2016/17 $17,034,350 $69,484,008 $86,518,358
2017/18 $17,777,311 $70,941,358 $88,718,669
2018/19 $19,300,847 $72,481,179 $91,782,026
Table 3-10
CFD 2003-16 Assessed Valuation History
Fiscal Year Land Assessed
Value
Improvement Assessed
Value
Total Assessed
Valuation
2009/10 $16,383,034 $77,241,772 $93,624,806
2010/11 $17,004,588 $73,510,976 $90,515,564
2011/12 $17,603,823 $74,593,203 $92,197,026
2012/13 $16,945,513 $70,030,313 $86,975,826
2013/14 $18,500,978 $74,537,326 $93,038,304
2014/15 $20,764,001 $86,270,141 $107,034,142
2015/16 $21,629,810 $91,763,922 $113,393,732
2016/17 $22,112,690 $96,075,914 $118,188,604
2017/18 $22,662,022 $100,188,584 $122,850,606
2018/19 $23,654,444 $106,569,894 $130,224,338
Table 3-11
CFD 2003-19 IA A Assessed Valuation History
Fiscal Year
Land Assessed
Value
Improvement Assessed
Value
Total Assessed
Valuation
2009/10 $6,639,278 $18,113,873 $24,753,151
2010/11 $6,338,021 $16,993,568 $23,331,589
2011/12 $6,313,206 $16,641,181 $22,954,387
2012/13 $6,292,162 $16,152,194 $22,444,356
2013/14 $6,508,259 $16,220,550 $22,728,809
2014/15 $7,522,333 $19,326,537 $26,848,870
2015/16 $7,757,742 $20,313,174 $28,070,916
2016/17 $8,015,858 $21,402,887 $29,418,745
2017/18 $8,337,025 $22,927,620 $31,264,645
2018/19 $8,544,052 $23,839,193 $32,383,245
Page 23
Section 3 Assessed Value Information
Western Riverside Water and Wastewater Financing Authority, Local Agency Revenue Refunding Bonds, 2013 Series A-1 and A-2
Annual Disclosure Report for Fiscal Year Ending June 30, 2018
21
Table 3-12
CFD 2003-19 IA B Assessed Valuation History
Fiscal Year
Land Assessed
Value
Improvement Assessed
Value
Total Assessed
Valuation
2009/10 $14,510,750 $31,494,490 $46,005,240
2010/11 $13,577,361 $30,735,523 $44,312,884
2011/12 $13,641,325 $30,279,475 $43,920,800
2012/13 $13,324,729 $29,429,992 $42,754,721
2013/14 $13,580,931 $29,850,731 $43,431,662
2014/15 $15,630,744 $35,281,754 $50,912,498
2015/16 $15,932,086 $37,307,547 $53,239,633
2016/17 $16,335,364 $38,896,081 $55,231,445
2017/18 $16,916,618 $41,959,781 $58,876,399
2018/19 $17,335,719 $45,078,065 $62,413,784
Table 3-13
CFD 2003-20 IA A Assessed Valuation History
Fiscal Year
Land Assessed
Value
Improvement Assessed
Value
Total Assessed
Valuation
2009/10 $4,550,137 $19,649,226 $24,199,363
2010/11 $4,540,319 $18,491,477 $23,031,796
2011/12 $4,479,140 $18,259,619 $22,738,759
2012/13 $4,463,708 $17,986,833 $22,450,541
2013/14 $4,770,038 $19,157,803 $23,927,841
2014/15 $5,204,802 $21,140,496 $26,345,298
2015/16 $5,476,852 $23,130,056 $28,606,908
2016/17 $5,578,646 $23,908,753 $29,487,399
2017/18 $5,892,302 $25,507,074 $31,399,376
2018/19 $6,296,810 $27,703,061 $33,999,871
Table 3-14
CFD 2003-25 IA D Assessed Valuation History
Fiscal Year
Land Assessed
Value
Improvement Assessed
Value
Total Assessed
Valuation
2009/10 $10,197,560 $30,358,032 $40,555,592
2010/11 $7,834,614 $27,689,497 $35,524,111
2011/12 $8,614,021 $32,232,860 $40,846,881
2012/13 $8,017,778 $30,464,160 $38,481,938
2013/14 $8,055,143 $33,853,206 $41,908,349
2014/15 $9,146,793 $41,166,100 $50,312,893
2015/16 $9,292,885 $42,660,596 $51,953,481
2016/17 $9,595,556 $44,281,149 $53,876,705
2017/18 $9,824,484 $46,152,711 $55,977,195
2018/19 $10,052,980 $48,501,399 $58,554,379
Page 24
Section 3 Assessed Value Information
Western Riverside Water and Wastewater Financing Authority, Local Agency Revenue Refunding Bonds, 2013 Series A-1 and A-2
Annual Disclosure Report for Fiscal Year Ending June 30, 2018
22
Table 3-15
CFD 2004-26 IA 1 Assessed Valuation History
Fiscal Year
Land Assessed
Value
Improvement Assessed
Value
Total Assessed
Valuation
2009/10 $12,682,118 $47,536,565 $60,218,683
2010/11 $12,185,939 $40,456,629 $52,642,568
2011/12 $12,895,074 $41,123,546 $54,018,620
2012/13 $13,048,544 $41,031,704 $54,080,248
2013/14 $13,734,954 $42,652,036 $56,386,990
2014/15 $15,843,987 $51,314,868 $67,158,855
2015/16 $16,170,634 $54,025,538 $70,196,172
2016/17 $16,479,121 $57,151,463 $73,630,584
2017/18 $16,873,342 $61,908,556 $78,781,898
2018/19 $17,307,474 $66,410,224 $83,717,698
Table 3-16
CFD 2004-26 IA 2 Assessed Valuation History
Fiscal Year
Land Assessed
Value
Improvement Assessed
Value
Total Assessed
Valuation
2009/10 $9,001,659 $30,185,500 $39,187,159
2010/11 $8,352,578 $25,700,690 $34,053,268
2011/12 $7,462,600 $25,174,653 $32,637,253
2012/13 $7,577,885 $25,223,192 $32,801,077
2013/14 $7,936,002 $26,372,663 $34,308,665
2014/15 $8,956,143 $30,574,718 $39,530,861
2015/16 $9,220,627 $32,832,537 $42,053,164
2016/17 $9,425,077 $35,282,653 $44,707,730
2017/18 $9,820,398 $37,840,068 $47,660,466
2018/19 $10,262,185 $41,316,413 $51,578,598
Table 3-17
CFD 2004-28 Assessed Valuation History
Fiscal Year
Land Assessed
Value
Improvement Assessed
Value
Total Assessed
Valuation
2009/10 $19,460,531 $30,022,026 $49,482,557
2010/11 $18,685,072 $35,140,808 $53,825,880
2011/12 $16,666,343 $36,866,304 $53,532,647
2012/13 $15,154,049 $34,902,984 $50,057,033
2013/14 $15,731,578 $37,494,624 $53,226,202
2014/15 $18,514,919 $44,455,503 $62,970,422
2015/16 $18,909,241 $46,116,700 $65,025,941
2016/17 $19,476,061 $48,675,695 $68,151,756
2017/18 $19,691,190 $50,903,536 $70,594,726
2018/19 $20,995,966 $53,941,350 $74,937,316
Page 25
Section 3 Assessed Value Information
Western Riverside Water and Wastewater Financing Authority, Local Agency Revenue Refunding Bonds, 2013 Series A-1 and A-2
Annual Disclosure Report for Fiscal Year Ending June 30, 2018
23
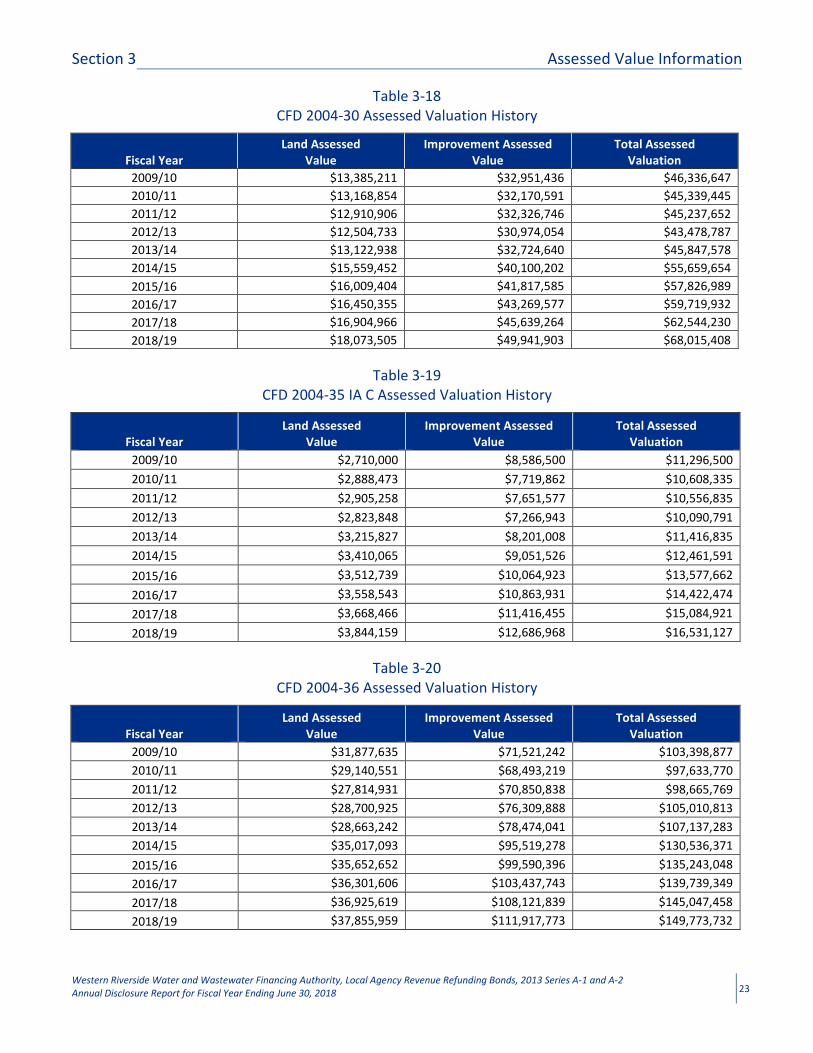
Table 3-18
CFD 2004-30 Assessed Valuation History
Fiscal Year
Land Assessed
Value
Improvement Assessed
Value
Total Assessed
Valuation
2009/10 $13,385,211 $32,951,436 $46,336,647
2010/11 $13,168,854 $32,170,591 $45,339,445
2011/12 $12,910,906 $32,326,746 $45,237,652
2012/13 $12,504,733 $30,974,054 $43,478,787
2013/14 $13,122,938 $32,724,640 $45,847,578
2014/15 $15,559,452 $40,100,202 $55,659,654
2015/16 $16,009,404 $41,817,585 $57,826,989
2016/17 $16,450,355 $43,269,577 $59,719,932
2017/18 $16,904,966 $45,639,264 $62,544,230
2018/19 $18,073,505 $49,941,903 $68,015,408
Table 3-19
CFD 2004-35 IA C Assessed Valuation History
Fiscal Year
Land Assessed
Value
Improvement Assessed
Value
Total Assessed
Valuation
2009/10 $2,710,000 $8,586,500 $11,296,500
2010/11 $2,888,473 $7,719,862 $10,608,335
2011/12 $2,905,258 $7,651,577 $10,556,835
2012/13 $2,823,848 $7,266,943 $10,090,791
2013/14 $3,215,827 $8,201,008 $11,416,835
2014/15 $3,410,065 $9,051,526 $12,461,591
2015/16 $3,512,739 $10,064,923 $13,577,662
2016/17 $3,558,543 $10,863,931 $14,422,474
2017/18 $3,668,466 $11,416,455 $15,084,921
2018/19 $3,844,159 $12,686,968 $16,531,127
Table 3-20
CFD 2004-36 Assessed Valuation History
Fiscal Year
Land Assessed
Value
Improvement Assessed
Value
Total Assessed
Valuation
2009/10 $31,877,635 $71,521,242 $103,398,877
2010/11 $29,140,551 $68,493,219 $97,633,770
2011/12 $27,814,931 $70,850,838 $98,665,769
2012/13 $28,700,925 $76,309,888 $105,010,813
2013/14 $28,663,242 $78,474,041 $107,137,283
2014/15 $35,017,093 $95,519,278 $130,536,371
2015/16 $35,652,652 $99,590,396 $135,243,048
2016/17 $36,301,606 $103,437,743 $139,739,349
2017/18 $36,925,619 $108,121,839 $145,047,458
2018/19 $37,855,959 $111,917,773 $149,773,732
Page 26
Section 3 Assessed Value Information
Western Riverside Water and Wastewater Financing Authority, Local Agency Revenue Refunding Bonds, 2013 Series A-1 and A-2
Annual Disclosure Report for Fiscal Year Ending June 30, 2018
24
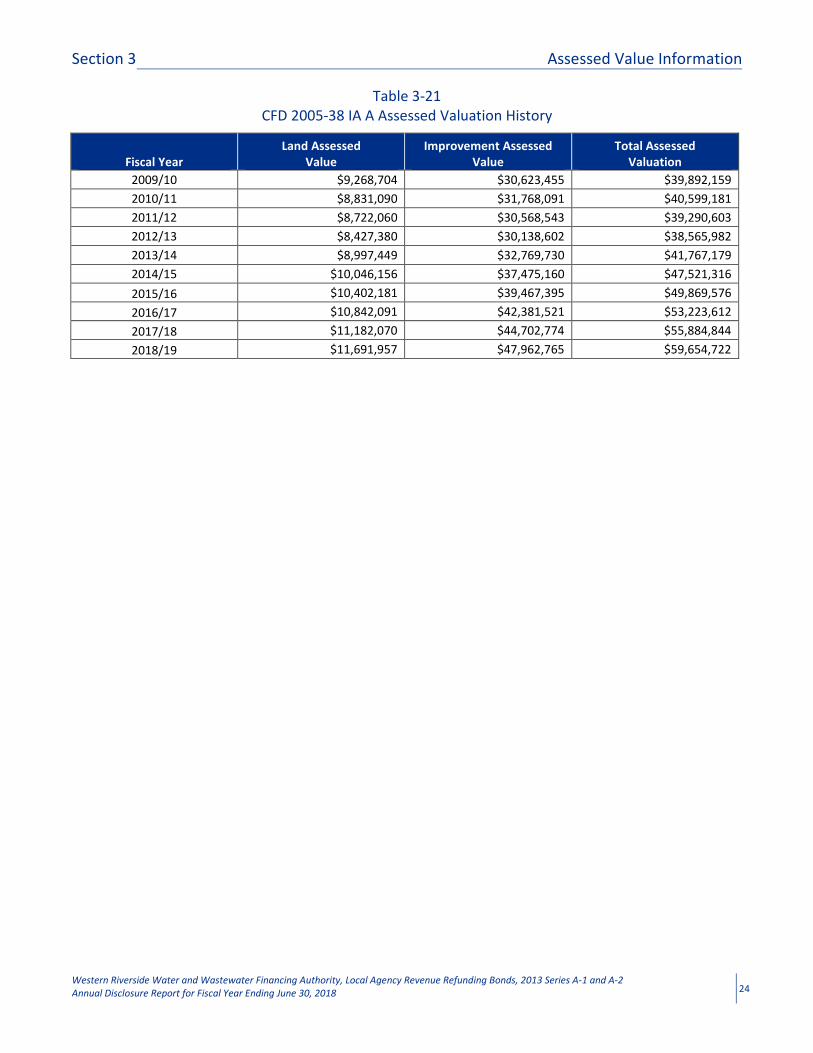
Table 3-21
CFD 2005-38 IA A Assessed Valuation History
Fiscal Year
Land Assessed
Value
Improvement Assessed
Value
Total Assessed
Valuation
2009/10 $9,268,704 $30,623,455 $39,892,159
2010/11 $8,831,090 $31,768,091 $40,599,181
2011/12 $8,722,060 $30,568,543 $39,290,603
2012/13 $8,427,380 $30,138,602 $38,565,982
2013/14 $8,997,449 $32,769,730 $41,767,179
2014/15 $10,046,156 $37,475,160 $47,521,316
2015/16 $10,402,181 $39,467,395 $49,869,576
2016/17 $10,842,091 $42,381,521 $53,223,612
2017/18 $11,182,070 $44,702,774 $55,884,844
2018/19 $11,691,957 $47,962,765 $59,654,722
Page 27
Section 4 Payment History
Western Riverside Water and Wastewater Financing Authority, Local Agency Revenue Refunding Bonds, 2013 Series A-1 and A-2
Annual Disclosure Report for Fiscal Year Ending June 30, 2018
25
Information Concerning Delinquent Parcels
The CFDs’ Special Tax delinquency information, as of November 14, 2018, is illustrated below:
Table 4-1
CFD 2002-04 IA 3 Special Tax Delinquency Information
Fiscal Year
Special Taxes
Levied
Special Taxes
Collected
Number of
Delinquent
Parcels
Delinquent
Special Tax
Amount
Fiscal Year
Delinquent
Percent
2007/08 $87,811.86 $87,811.86 0 $0.00 0.00%
2008/09 $84,704.48 $84,704.48 0 $0.00 0.00%
2009/10 $88,328.18 $88,328.18 0 $0.00 0.00%
2010/11 $83,034.96 $83,034.96 0 $0.00 0.00%
2011/12 $79,438.80 $79,438.80 0 $0.00 0.00%
2012/13 $69,515.72 $69,515.72 0 $0.00 0.00%
2013/14 $67,396.26 $67,396.26 0 $0.00 0.00%
2014/15 $68,294.20 $68,294.20 0 $0.00 0.00%
2015/16 $67,826.20 $67,826.20 0 $0.00 0.00%
2016/17 $70,314.40 $70,314.40 0 $0.00 0.00%
2017/18 $64,160.20 $64,160.20 0 $0.00 0.00%
Total $830,825.26 $830,825.26 0 $0.00 0.00%
Table 4-2
CFD 2002-04 IA 4 Special Tax Delinquency Information
Fiscal Year
Special Taxes
Levied
Special Taxes
Collected
Number of
Delinquent
Parcels
Delinquent
Special Tax
Amount
Fiscal Year
Delinquent
Percent
2007/08 $63,879.82 $63,879.82 0 $0.00 0.00%
2008/09 $70,267.80 $70,267.80 0 $0.00 0.00%
2009/10 $63,479.34 $63,479.34 0 $0.00 0.00%
2010/11 $60,418.12 $60,418.12 0 $0.00 0.00%
2011/12 $60,522.80 $60,522.80 0 $0.00 0.00%
2012/13 $51,435.40 $51,435.40 0 $0.00 0.00%
2013/14 $50,689.16 $50,689.16 0 $0.00 0.00%
2014/15 $50,381.04 $50,381.04 0 $0.00 0.00%
2015/16 $50,243.68 $50,243.68 0 $0.00 0.00%
2016/17 $53,030.32 $53,030.32 0 $0.00 0.00%
2017/18 $52,549.44 $52,549.44 0 $0.00 0.00%
Total $626,896.92 $626,896.92 0 $0.00 0.00%
Page 28
Section 4 Payment History
Western Riverside Water and Wastewater Financing Authority, Local Agency Revenue Refunding Bonds, 2013 Series A-1 and A-2
Annual Disclosure Report for Fiscal Year Ending June 30, 2018
26
Table 4-3
CFD 2002-09 Special Tax Delinquency Information
Fiscal Year
Special Taxes
Levied
Special Taxes
Collected
Number of
Delinquent
Parcels
Delinquent
Special Tax
Amount
Fiscal Year
Delinquent
Percent
2007/08 $172,939.88 $172,939.88 0 $0.00 0.00%
2008/09 $168,940.58 $168,940.58 0 $0.00 0.00%
2009/10 $180,714.20 $180,714.20 0 $0.00 0.00%
2010/11 $170,443.40 $170,443.40 0 $0.00 0.00%
2011/12 $170,515.20 $170,515.20 0 $0.00 0.00%
2012/13 $147,423.26 $147,423.26 0 $0.00 0.00%
2013/14 $138,486.36 $138,486.36 0 $0.00 0.00%
2014/15 $136,289.48 $136,289.48 0 $0.00 0.00%
2015/16 $139,800.06 $139,122.58 1 $677.48 0.48%
2016/17 $136,307.58 $135,115.02 2 $1,192.56 0.87%
2017/18 $134,253.08 $133,078.50 2 $1,174.58 0.87%
Total $1,696,113.08 $1,693,068.46 2 $3,044.62 0.18%
Table 4-4
CFD 2003-12 IA A Special Tax Delinquency Information
Fiscal Year
Special Taxes
Levied
Special Taxes
Collected
Number of
Delinquent
Parcels
Delinquent
Special Tax
Amount
Fiscal Year
Delinquent
Percent
2007/08 $211,161.30 $211,161.30 0 $0.00 0.00%
2008/09 $206,523.24 $206,523.24 0 $0.00 0.00%
2009/10 $221,970.64 $221,970.64 0 $0.00 0.00%
2010/11 $209,379.66 $209,379.66 0 $0.00 0.00%
2011/12 $202,971.20 $202,971.20 0 $0.00 0.00%
2012/13 $147,925.92 $146,657.08 1 $1,268.84 0.86%
2013/14 $159,106.58 $159,106.58 0 $0.00 0.00%
2014/15 $157,537.92 $157,537.92 0 $0.00 0.00%
2015/16 $161,008.00 $161,008.00 0 $0.00 0.00%
2016/17 $161,991.92 $160,602.42 1 $1,389.50 0.86%
2017/18 $159,706.32 $159,706.32 0 $0.00 0.00%
Total $1,999,282.70 $1,996,624.36 2 $2,658.34 0.13%
Page 29
Section 4 Payment History
Western Riverside Water and Wastewater Financing Authority, Local Agency Revenue Refunding Bonds, 2013 Series A-1 and A-2
Annual Disclosure Report for Fiscal Year Ending June 30, 2018
27
Table 4-5
CFD 2003-12 IA B Special Tax Delinquency Information
Fiscal Year
Special Taxes
Levied
Special Taxes
Collected
Number of
Delinquent
Parcels
Delinquent
Special Tax
Amount
Fiscal Year
Delinquent
Percent
2007/08 $245,297.76 $245,297.76 0 $0.00 0.00%
2008/09 $269,827.54 $269,827.54 0 $0.00 0.00%
2009/10 $281,140.36 $281,140.36 0 $0.00 0.00%
2010/11 $265,249.98 $265,249.98 0 $0.00 0.00%
2011/12 $254,205.74 $254,205.74 0 $0.00 0.00%
2012/13 $234,824.34 $234,824.34 0 $0.00 0.00%
2013/14 $211,129.98 $211,129.98 0 $0.00 0.00%
2014/15 $208,577.42 $208,577.42 0 $0.00 0.00%
2015/16 $206,556.30 $206,556.30 0 $0.00 0.00%
2016/17 $201,902.24 $201,902.24 0 $0.00 0.00%
2017/18 $203,531.36 $200,060.80 2 $3,470.56 1.71%
Total $2,582,243.02 $2,578,772.46 2 $3,470.56 0.13%
Table 4-6
CFD 2003-14 IA A Special Tax Delinquency Information
Fiscal Year
Special Taxes
Levied
Special Taxes
Collected
Number of
Delinquent
Parcels
Delinquent
Special Tax
Amount
Fiscal Year
Delinquent
Percent
2007/08 $184,684.60 $184,684.60 0 $0.00 0.00%
2008/09 $194,679.06 $194,679.06 0 $0.00 0.00%
2009/10 $194,576.90 $194,576.90 0 $0.00 0.00%
2010/11 $189,135.36 $189,135.36 0 $0.00 0.00%
2011/12 $179,345.28 $179,345.28 0 $0.00 0.00%
2012/13 $129,300.48 $129,300.48 0 $0.00 0.00%
2013/14 $124,704.00 $124,704.00 0 $0.00 0.00%
2014/15 $123,290.88 $123,290.88 0 $0.00 0.00%
2015/16 $127,317.12 $127,317.12 0 $0.00 0.00%
2016/17 $124,021.44 $124,021.44 0 $0.00 0.00%
2017/18 $122,213.76 $121,003.81 2 $1,209.95 0.99%
Total $1,693,268.88 $1,692,058.93 2 $1,209.95 0.07%
Page 30
Section 4 Payment History
Western Riverside Water and Wastewater Financing Authority, Local Agency Revenue Refunding Bonds, 2013 Series A-1 and A-2
Annual Disclosure Report for Fiscal Year Ending June 30, 2018
28
Table 4-7
CFD 2003-14 IA B Special Tax Delinquency Information
Fiscal Year
Special Taxes
Levied
Special Taxes
Collected
Number of
Delinquent
Parcels
Delinquent
Special Tax
Amount
Fiscal Year
Delinquent
Percent
2007/08 $364,101.86 $364,101.86 0 $0.00 0.00%
2008/09 $336,943.24 $336,943.24 0 $0.00 0.00%
2009/10 $331,957.14 $331,957.14 0 $0.00 0.00%
2010/11 $316,231.08 $316,231.08 0 $0.00 0.00%
2011/12 $317,209.40 $317,209.40 0 $0.00 0.00%
2012/13 $280,597.36 $280,597.36 0 $0.00 0.00%
2013/14 $260,332.84 $260,332.84 0 $0.00 0.00%
2014/15 $257,913.04 $257,913.04 0 $0.00 0.00%
2015/16 $260,612.92 $260,612.92 0 $0.00 0.00%
2016/17 $260,179.80 $259,632.90 1 $546.90 0.21%
2017/18 $260,953.58 $260,953.58 0 $0.00 0.00%
Total $3,247,032.26 $3,246,485.36 1 $546.90 0.02%
Table 4-8
CFD 2003-14 IA C Special Tax Delinquency Information
Fiscal Year
Special Taxes
Levied
Special Taxes
Collected
Number of
Delinquent
Parcels
Delinquent
Special Tax
Amount
Fiscal Year
Delinquent
Percent
2007/08 $177,408.12 $177,408.12 0 $0.00 0.00%
2008/09 $173,369.60 $173,369.60 0 $0.00 0.00%
2009/10 $183,049.14 $183,049.14 0 $0.00 0.00%
2010/11 $179,615.56 $179,615.56 0 $0.00 0.00%
2011/12 $170,205.20 $170,205.20 0 $0.00 0.00%
2012/13 $151,470.08 $151,470.08 0 $0.00 0.00%
2013/14 $145,622.14 $145,622.14 0 $0.00 0.00%
2014/15 $142,653.92 $142,653.92 0 $0.00 0.00%
2015/16 $141,326.66 $141,326.66 0 $0.00 0.00%
2016/17 $142,469.76 $142,469.76 0 $0.00 0.00%
2017/18 $135,298.88 $135,298.88 0 $0.00 0.00%
Total $1,742,489.06 $1,742,489.06 0 $0.00 0.00%
Page 31
Section 4 Payment History
Western Riverside Water and Wastewater Financing Authority, Local Agency Revenue Refunding Bonds, 2013 Series A-1 and A-2
Annual Disclosure Report for Fiscal Year Ending June 30, 2018
29
Table 4-9
CFD 2003-15 IA A Special Tax Delinquency Information
Fiscal Year
Special Taxes
Levied
Special Taxes
Collected
Number of
Delinquent
Parcels
Delinquent
Special Tax
Amount
Fiscal Year
Delinquent
Percent
2007/08 $607,907.76 $607,907.76 0 $0.00 0.00%
2008/09 $668,698.54 $668,698.54 0 $0.00 0.00%
2009/10 $677,114.06 $677,114.06 0 $0.00 0.00%
2010/11 $638,262.88 $638,262.88 0 $0.00 0.00%
2011/12 $596,053.28 $596,053.28 0 $0.00 0.00%
2012/13 $348,918.48 $348,918.48 0 $0.00 0.00%
2013/14 $439,959.56 $439,959.56 0 $0.00 0.00%
2014/15 $441,304.52 $441,304.52 0 $0.00 0.00%
2015/16 $429,430.38 $429,430.38 0 $0.00 0.00%
2016/17 $432,307.86 $432,307.86 0 $0.00 0.00%
2017/18 $436,233.90 $436,233.90 0 $0.00 0.00%
Total $5,716,191.22 $5,716,191.22 0 $0.00 0.00%
Table 4-10
CFD 2003-16 Special Tax Delinquency Information
Fiscal Year
Special Taxes
Levied
Special Taxes
Collected
Number of
Delinquent
Parcels
Delinquent
Special Tax
Amount
Fiscal Year
Delinquent
Percent
2007/08 $362,338.28 $362,338.28 0 $0.00 0.00%
2008/09 $370,226.30 $370,226.30 0 $0.00 0.00%
2009/10 $378,607.02 $378,607.02 0 $0.00 0.00%
2010/11 $357,269.66 $357,269.66 0 $0.00 0.00%
2011/12 $341,439.80 $340,628.34 1 $811.46 0.24%
2012/13 $258,394.96 $257,780.88 1 $614.08 0.24%
2013/14 $259,107.38 $258,491.60 1 $615.78 0.24%
2014/15 $258,809.36 $258,809.36 0 $0.00 0.00%
2015/16 $255,803.20 $255,803.20 0 $0.00 0.00%
2016/17 $250,594.52 $249,857.04 1 $737.48 0.29%
2017/18 $251,795.64 $251,054.62 1 $741.02 0.29%
Total $3,344,386.12 $3,340,866.30 3 $3,519.82 0.11%
Page 32
Section 4 Payment History
Western Riverside Water and Wastewater Financing Authority, Local Agency Revenue Refunding Bonds, 2013 Series A-1 and A-2
Annual Disclosure Report for Fiscal Year Ending June 30, 2018
30
Table 4-11
CFD 2003-19 IA A Special Tax Delinquency Information
Fiscal Year
Special Taxes
Levied
Special Taxes
Collected
Number of
Delinquent
Parcels
Delinquent
Special Tax
Amount
Fiscal Year
Delinquent
Percent
2007/08 $220,292.30 $220,292.30 0 $0.00 0.00%
2008/09 $204,941.20 $204,941.20 0 $0.00 0.00%
2009/10 $212,034.30 $212,034.30 0 $0.00 0.00%
2010/11 $211,500.48 $211,500.48 0 $0.00 0.00%
2011/12 $200,824.88 $200,824.88 0 $0.00 0.00%
2012/13 $182,998.32 $182,998.32 0 $0.00 0.00%
2013/14 $171,485.00 $171,485.00 0 $0.00 0.00%
2014/15 $170,236.92 $170,236.92 0 $0.00 0.00%
2015/16 $168,969.92 $168,969.92 0 $0.00 0.00%
2016/17 $169,927.98 $169,927.98 0 $0.00 0.00%
2017/18 $166,938.04 $166,938.04 0 $0.00 0.00%
Total $2,080,149.34 $2,080,149.34 0 $0.00 0.00%
Table 4-12
CFD 2003-19 IA B Special Tax Delinquency Information
Fiscal Year
Special Taxes
Levied
Special Taxes
Collected
Number of
Delinquent
Parcels
Delinquent
Special Tax
Amount
Fiscal Year
Delinquent
Percent
2007/08 $396,865.68 $396,865.68 0 $0.00 0.00%
2008/09 $436,552.24 $436,552.24 0 $0.00 0.00%
2009/10 $423,375.86 $423,375.86 0 $0.00 0.00%
2010/11 $375,850.18 $375,850.18 0 $0.00 0.00%
2011/12 $361,757.54 $361,757.54 0 $0.00 0.00%
2012/13 $313,189.58 $313,189.58 0 $0.00 0.00%
2013/14 $288,995.44 $288,995.44 0 $0.00 0.00%
2014/15 $284,124.62 $284,124.62 0 $0.00 0.00%
2015/16 $286,339.20 $286,339.20 0 $0.00 0.00%
2016/17 $285,414.56 $285,414.56 0 $0.00 0.00%
2017/18 $285,036.92 $285,036.92 0 $0.00 0.00%
Total $3,737,501.82 $3,737,501.82 0 $0.00 0.00%
Page 33
Section 4 Payment History
Western Riverside Water and Wastewater Financing Authority, Local Agency Revenue Refunding Bonds, 2013 Series A-1 and A-2
Annual Disclosure Report for Fiscal Year Ending June 30, 2018
31
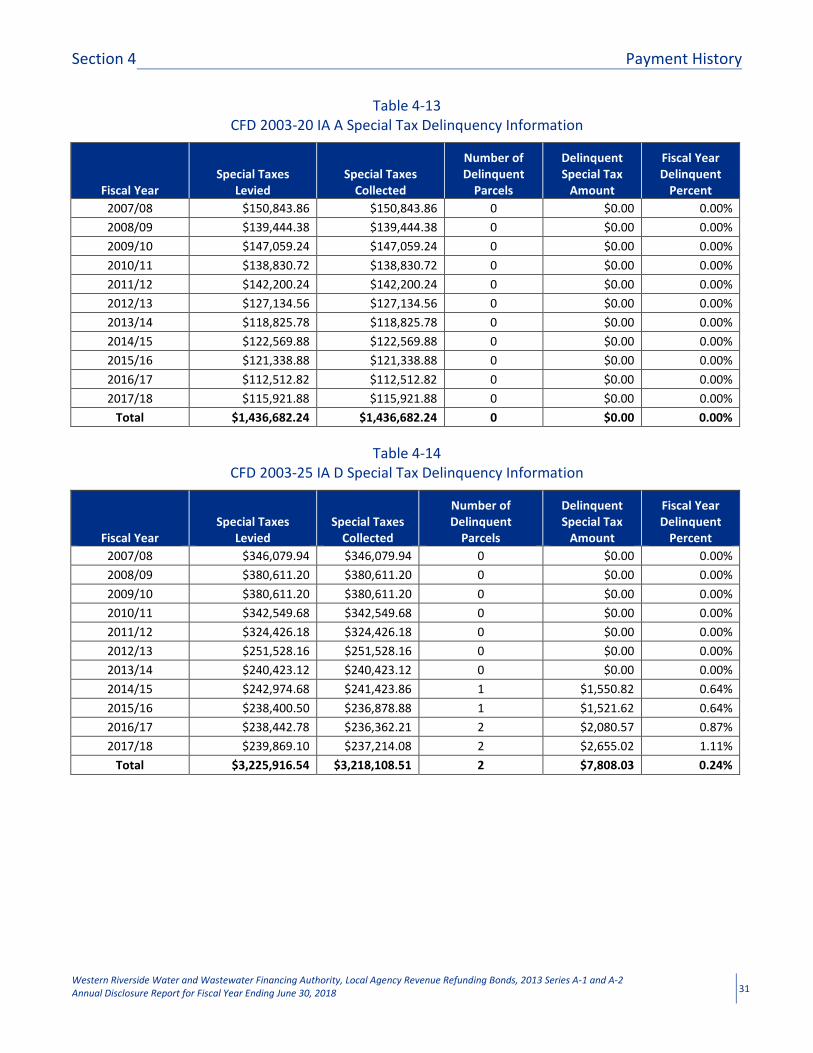
Table 4-13
CFD 2003-20 IA A Special Tax Delinquency Information
Fiscal Year
Special Taxes
Levied
Special Taxes
Collected
Number of
Delinquent
Parcels
Delinquent
Special Tax
Amount
Fiscal Year
Delinquent
Percent
2007/08 $150,843.86 $150,843.86 0 $0.00 0.00%
2008/09 $139,444.38 $139,444.38 0 $0.00 0.00%
2009/10 $147,059.24 $147,059.24 0 $0.00 0.00%
2010/11 $138,830.72 $138,830.72 0 $0.00 0.00%
2011/12 $142,200.24 $142,200.24 0 $0.00 0.00%
2012/13 $127,134.56 $127,134.56 0 $0.00 0.00%
2013/14 $118,825.78 $118,825.78 0 $0.00 0.00%
2014/15 $122,569.88 $122,569.88 0 $0.00 0.00%
2015/16 $121,338.88 $121,338.88 0 $0.00 0.00%
2016/17 $112,512.82 $112,512.82 0 $0.00 0.00%
2017/18 $115,921.88 $115,921.88 0 $0.00 0.00%
Total $1,436,682.24 $1,436,682.24 0 $0.00 0.00%
Table 4-14
CFD 2003-25 IA D Special Tax Delinquency Information
Fiscal Year
Special Taxes
Levied
Special Taxes
Collected
Number of
Delinquent
Parcels
Delinquent
Special Tax
Amount
Fiscal Year
Delinquent
Percent
2007/08 $346,079.94 $346,079.94 0 $0.00 0.00%
2008/09 $380,611.20 $380,611.20 0 $0.00 0.00%
2009/10 $380,611.20 $380,611.20 0 $0.00 0.00%
2010/11 $342,549.68 $342,549.68 0 $0.00 0.00%
2011/12 $324,426.18 $324,426.18 0 $0.00 0.00%
2012/13 $251,528.16 $251,528.16 0 $0.00 0.00%
2013/14 $240,423.12 $240,423.12 0 $0.00 0.00%
2014/15 $242,974.68 $241,423.86 1 $1,550.82 0.64%
2015/16 $238,400.50 $236,878.88 1 $1,521.62 0.64%
2016/17 $238,442.78 $236,362.21 2 $2,080.57 0.87%
2017/18 $239,869.10 $237,214.08 2 $2,655.02 1.11%
Total $3,225,916.54 $3,218,108.51 2 $7,808.03 0.24%
Page 34
Section 4 Payment History
Western Riverside Water and Wastewater Financing Authority, Local Agency Revenue Refunding Bonds, 2013 Series A-1 and A-2
Annual Disclosure Report for Fiscal Year Ending June 30, 2018
32
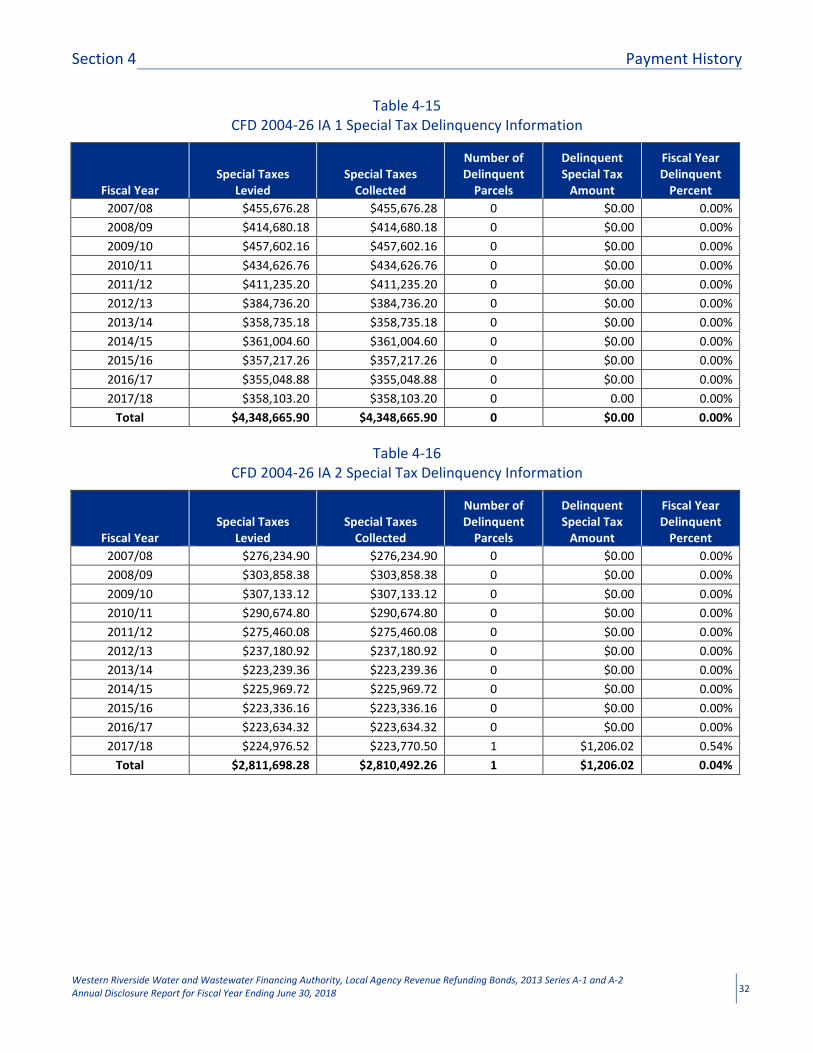
Table 4-15
CFD 2004-26 IA 1 Special Tax Delinquency Information
Fiscal Year
Special Taxes
Levied
Special Taxes
Collected
Number of
Delinquent
Parcels
Delinquent
Special Tax
Amount
Fiscal Year
Delinquent
Percent
2007/08 $455,676.28 $455,676.28 0 $0.00 0.00%
2008/09 $414,680.18 $414,680.18 0 $0.00 0.00%
2009/10 $457,602.16 $457,602.16 0 $0.00 0.00%
2010/11 $434,626.76 $434,626.76 0 $0.00 0.00%
2011/12 $411,235.20 $411,235.20 0 $0.00 0.00%
2012/13 $384,736.20 $384,736.20 0 $0.00 0.00%
2013/14 $358,735.18 $358,735.18 0 $0.00 0.00%
2014/15 $361,004.60 $361,004.60 0 $0.00 0.00%
2015/16 $357,217.26 $357,217.26 0 $0.00 0.00%
2016/17 $355,048.88 $355,048.88 0 $0.00 0.00%
2017/18 $358,103.20 $358,103.20 0 0.00 0.00%
Total $4,348,665.90 $4,348,665.90 0 $0.00 0.00%
Table 4-16
CFD 2004-26 IA 2 Special Tax Delinquency Information
Fiscal Year
Special Taxes
Levied
Special Taxes
Collected
Number of
Delinquent
Parcels
Delinquent
Special Tax
Amount
Fiscal Year
Delinquent
Percent
2007/08 $276,234.90 $276,234.90 0 $0.00 0.00%
2008/09 $303,858.38 $303,858.38 0 $0.00 0.00%
2009/10 $307,133.12 $307,133.12 0 $0.00 0.00%
2010/11 $290,674.80 $290,674.80 0 $0.00 0.00%
2011/12 $275,460.08 $275,460.08 0 $0.00 0.00%
2012/13 $237,180.92 $237,180.92 0 $0.00 0.00%
2013/14 $223,239.36 $223,239.36 0 $0.00 0.00%
2014/15 $225,969.72 $225,969.72 0 $0.00 0.00%
2015/16 $223,336.16 $223,336.16 0 $0.00 0.00%
2016/17 $223,634.32 $223,634.32 0 $0.00 0.00%
2017/18 $224,976.52 $223,770.50 1 $1,206.02 0.54%
Total $2,811,698.28 $2,810,492.26 1 $1,206.02 0.04%
Page 35
Section 4 Payment History
Western Riverside Water and Wastewater Financing Authority, Local Agency Revenue Refunding Bonds, 2013 Series A-1 and A-2
Annual Disclosure Report for Fiscal Year Ending June 30, 2018
33
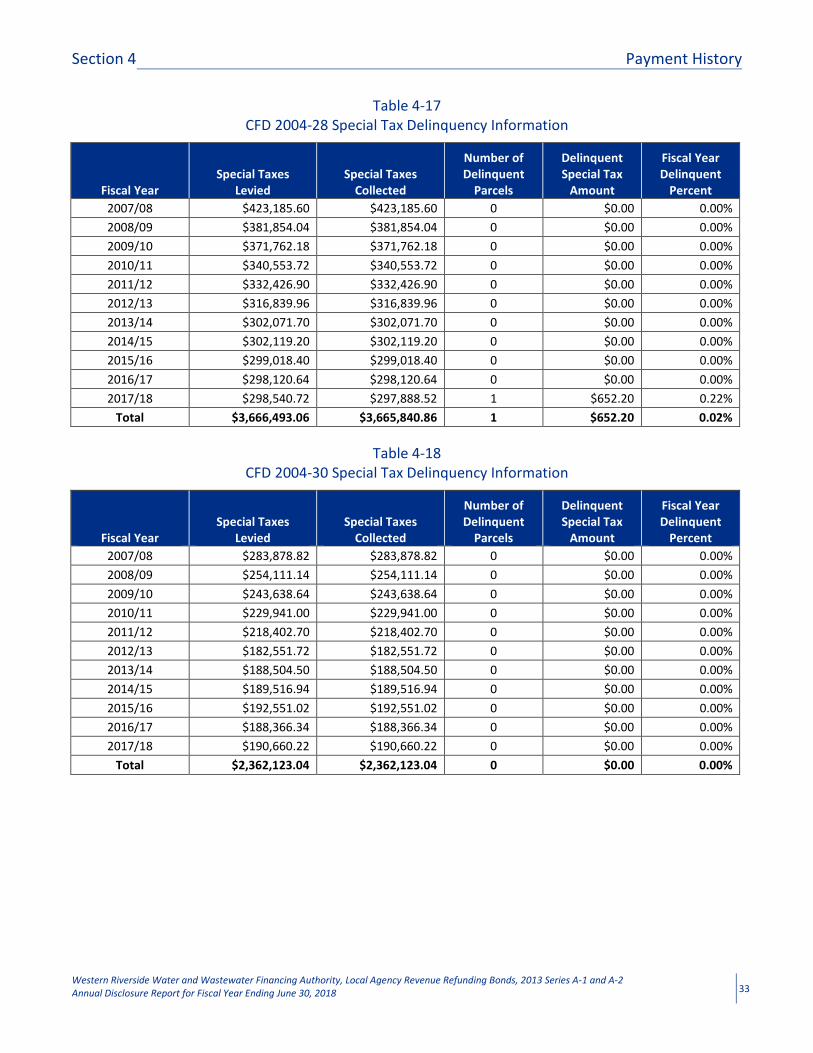
Table 4-17
CFD 2004-28 Special Tax Delinquency Information
Fiscal Year
Special Taxes
Levied
Special Taxes
Collected
Number of
Delinquent
Parcels
Delinquent
Special Tax
Amount
Fiscal Year
Delinquent
Percent
2007/08 $423,185.60 $423,185.60 0 $0.00 0.00%
2008/09 $381,854.04 $381,854.04 0 $0.00 0.00%
2009/10 $371,762.18 $371,762.18 0 $0.00 0.00%
2010/11 $340,553.72 $340,553.72 0 $0.00 0.00%
2011/12 $332,426.90 $332,426.90 0 $0.00 0.00%
2012/13 $316,839.96 $316,839.96 0 $0.00 0.00%
2013/14 $302,071.70 $302,071.70 0 $0.00 0.00%
2014/15 $302,119.20 $302,119.20 0 $0.00 0.00%
2015/16 $299,018.40 $299,018.40 0 $0.00 0.00%
2016/17 $298,120.64 $298,120.64 0 $0.00 0.00%
2017/18 $298,540.72 $297,888.52 1 $652.20 0.22%
Total $3,666,493.06 $3,665,840.86 1 $652.20 0.02%
Table 4-18
CFD 2004-30 Special Tax Delinquency Information
Fiscal Year
Special Taxes
Levied
Special Taxes
Collected
Number of
Delinquent
Parcels
Delinquent
Special Tax
Amount
Fiscal Year
Delinquent
Percent
2007/08 $283,878.82 $283,878.82 0 $0.00 0.00%
2008/09 $254,111.14 $254,111.14 0 $0.00 0.00%
2009/10 $243,638.64 $243,638.64 0 $0.00 0.00%
2010/11 $229,941.00 $229,941.00 0 $0.00 0.00%
2011/12 $218,402.70 $218,402.70 0 $0.00 0.00%
2012/13 $182,551.72 $182,551.72 0 $0.00 0.00%
2013/14 $188,504.50 $188,504.50 0 $0.00 0.00%
2014/15 $189,516.94 $189,516.94 0 $0.00 0.00%
2015/16 $192,551.02 $192,551.02 0 $0.00 0.00%
2016/17 $188,366.34 $188,366.34 0 $0.00 0.00%
2017/18 $190,660.22 $190,660.22 0 $0.00 0.00%
Total $2,362,123.04 $2,362,123.04 0 $0.00 0.00%
Page 36
Section 4 Payment History
Western Riverside Water and Wastewater Financing Authority, Local Agency Revenue Refunding Bonds, 2013 Series A-1 and A-2
Annual Disclosure Report for Fiscal Year Ending June 30, 2018
34
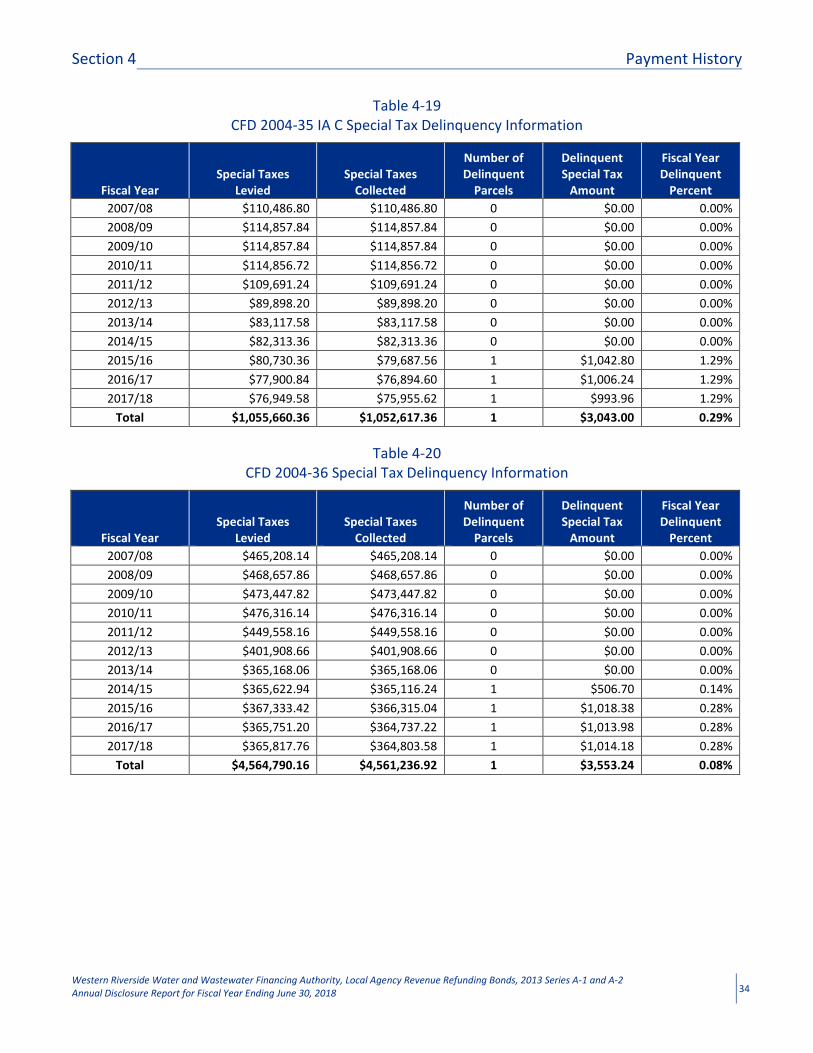
Table 4-19
CFD 2004-35 IA C Special Tax Delinquency Information
Fiscal Year
Special Taxes
Levied
Special Taxes
Collected
Number of
Delinquent
Parcels
Delinquent
Special Tax
Amount
Fiscal Year
Delinquent
Percent
2007/08 $110,486.80 $110,486.80 0 $0.00 0.00%
2008/09 $114,857.84 $114,857.84 0 $0.00 0.00%
2009/10 $114,857.84 $114,857.84 0 $0.00 0.00%
2010/11 $114,856.72 $114,856.72 0 $0.00 0.00%
2011/12 $109,691.24 $109,691.24 0 $0.00 0.00%
2012/13 $89,898.20 $89,898.20 0 $0.00 0.00%
2013/14 $83,117.58 $83,117.58 0 $0.00 0.00%
2014/15 $82,313.36 $82,313.36 0 $0.00 0.00%
2015/16 $80,730.36 $79,687.56 1 $1,042.80 1.29%
2016/17 $77,900.84 $76,894.60 1 $1,006.24 1.29%
2017/18 $76,949.58 $75,955.62 1 $993.96 1.29%
Total $1,055,660.36 $1,052,617.36 1 $3,043.00 0.29%
Table 4-20
CFD 2004-36 Special Tax Delinquency Information
Fiscal Year
Special Taxes
Levied
Special Taxes
Collected
Number of
Delinquent
Parcels
Delinquent
Special Tax
Amount
Fiscal Year
Delinquent
Percent
2007/08 $465,208.14 $465,208.14 0 $0.00 0.00%
2008/09 $468,657.86 $468,657.86 0 $0.00 0.00%
2009/10 $473,447.82 $473,447.82 0 $0.00 0.00%
2010/11 $476,316.14 $476,316.14 0 $0.00 0.00%
2011/12 $449,558.16 $449,558.16 0 $0.00 0.00%
2012/13 $401,908.66 $401,908.66 0 $0.00 0.00%
2013/14 $365,168.06 $365,168.06 0 $0.00 0.00%
2014/15 $365,622.94 $365,116.24 1 $506.70 0.14%
2015/16 $367,333.42 $366,315.04 1 $1,018.38 0.28%
2016/17 $365,751.20 $364,737.22 1 $1,013.98 0.28%
2017/18 $365,817.76 $364,803.58 1 $1,014.18 0.28%
Total $4,564,790.16 $4,561,236.92 1 $3,553.24 0.08%
Page 37
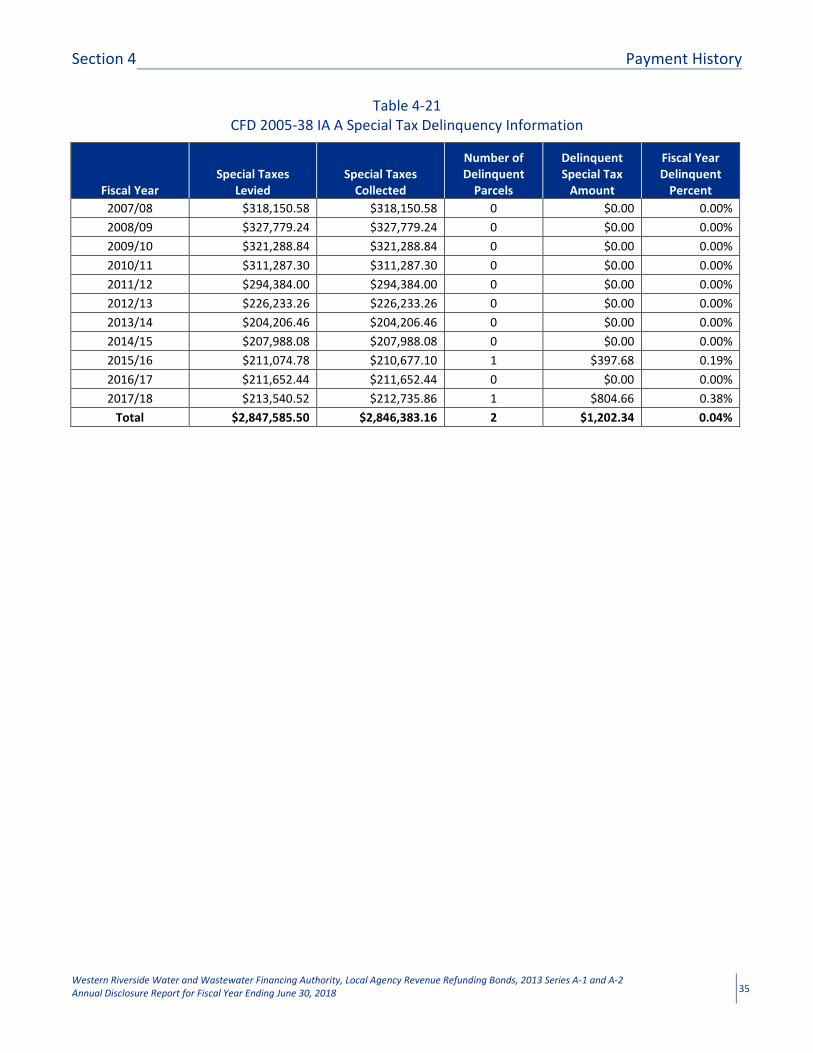
Section 4 Payment History
Western Riverside Water and Wastewater Financing Authority, Local Agency Revenue Refunding Bonds, 2013 Series A-1 and A-2
Annual Disclosure Report for Fiscal Year Ending June 30, 2018
35
Table 4-21
CFD 2005-38 IA A Special Tax Delinquency Information
Fiscal Year
Special Taxes
Levied
Special Taxes
Collected
Number of
Delinquent
Parcels
Delinquent
Special Tax
Amount
Fiscal Year
Delinquent
Percent
2007/08 $318,150.58 $318,150.58 0 $0.00 0.00%
2008/09 $327,779.24 $327,779.24 0 $0.00 0.00%
2009/10 $321,288.84 $321,288.84 0 $0.00 0.00%
2010/11 $311,287.30 $311,287.30 0 $0.00 0.00%
2011/12 $294,384.00 $294,384.00 0 $0.00 0.00%
2012/13 $226,233.26 $226,233.26 0 $0.00 0.00%
2013/14 $204,206.46 $204,206.46 0 $0.00 0.00%
2014/15 $207,988.08 $207,988.08 0 $0.00 0.00%
2015/16 $211,074.78 $210,677.10 1 $397.68 0.19%
2016/17 $211,652.44 $211,652.44 0 $0.00 0.00%
2017/18 $213,540.52 $212,735.86 1 $804.66 0.38%
Total $2,847,585.50 $2,846,383.16 2 $1,202.34 0.04%
Page 38
Section 4 Payment History
Western Riverside Water and Wastewater Financing Authority, Local Agency Revenue Refunding Bonds, 2013 Series A-1 and A-2
Annual Disclosure Report for Fiscal Year Ending June 30, 2018
36
Foreclosure Covenant
The District covenants for the benefit of the Owners of the Local Obligations (which is the Authority) and any
Local Obligation Parity Bonds that it:
i. will commence judicial foreclosure proceedings against parcels with delinquent Special Taxes in excess of
$5,000 by the October 1 following the close of each Fiscal Year in which such Special Taxes were due, and
ii. will commence judicial foreclosure proceedings against all parcels with delinquent Special Taxes by the
October 1 following the close of each Fiscal Year in which it receives Special Taxes in an amount which is less
than 95% of the total Special Tax levied and the amount on deposit in the applicable Reserve Account is at
less than the Proportionate Share of the Reserve Requirement, and
iii. will diligently pursue such foreclosure proceedings until the delinquent Special Taxes are paid; provided
that, notwithstanding the foregoing, the District may elect to defer foreclosure proceedings on any parcel so
long as the amount in the Reserve Fund is at least equal to the Reserve Requirement.
The District may, but is not obligated to, advance funds from any source of legally available funds in order to
maintain the applicable Reserve Account of the Reserve Fund.
The District covenants that it will deposit the net of proceeds of any foreclosure and any other Delinquency
Proceeds in the related Special Tax Fund and will apply such proceeds remaining after the payment of the
Administrative Expense Requirement to pay any delinquent installments of principal and interest on the Local
Obligations of the District and any Local Obligation Parity Bonds of the District and to make current payments of
principal and interest on the Local Obligations of the District and any Local Obligation Parity Bonds of the
District.
Status of Foreclosure Actions
As of September 30, 2018, no foreclosure actions have been filed with the Superior Court.
Audited Financial Statements for Fiscal Year 2017-18
Eastern Municipal Water District’s Fiscal Year 2017-18 Audited Financial Statements will be submitted to the
Electronic Municipal Market Access Website under separate cover and are incorporated herein by reference.
Page 39
Section 5 Special Tax Information
Western Riverside Water and Wastewater Financing Authority, Local Agency Revenue Refunding Bonds, 2013 Series A-1 and A-2
Annual Disclosure Report for Fiscal Year Ending June 30, 2018
37
Maximum Special Taxes by District
The total Special Tax levied and Maximum Special Tax for Fiscal Year 2018-19 are listed below:
Table 5-1
CFD 2002-04 IA 3 Maximum Special Tax Information
Development Status Parcel Count
Total Special Tax
FY 2018-19
Maximum Tax
FY 2018-19
Percent of
Maximum Tax
Developed 130 $63,143.60 $112,829.05 55.96%
Table 5-2
CFD 2002-04 IA 4 Maximum Special Tax Information
Development Status Parcel Count
Total Special Tax
FY 2018-19
Maximum Tax
FY 2018-19
Percent of
Maximum Tax
Developed 52 $51,943.36 $99,646.04 52.13%
Table 5-3
CFD 2002-09 Maximum Special Tax Information
Development Status Parcel Count
Total Special Tax
FY 2018-19
Maximum Tax
FY 2018-19
Percent of
Maximum Tax
Developed 243 $127,113.52 $215,878.05 58.88%
Table 5-4
CFD 2003-12 IA A Maximum Special Tax Information
Development Status Parcel Count
Total Special Tax
FY 2018-19
Maximum Tax
FY 2018-19
Percent of
Maximum Tax
Developed 120 $161,777.92 $275,458.80 58.73%
Table 5-5
CFD 2003-12 IA B Maximum Special Tax Information
Development Status Parcel Count
Total Special Tax
FY 2018-19
Maximum Tax
FY 2018-19
Percent of
Maximum Tax
Developed 124 $205,332.98 $322,962.90 63.58%
Table 5-6
CFD 2003-14 IA A Maximum Special Tax Information
Development Status Parcel Count
Total Special Tax
FY 2018-19
Maximum Tax
FY 2018-19
Percent of
Maximum Tax
Developed 144 $120,385.92 $263,759.04 45.64%
Page 40
Section 5 Special Tax Information
Western Riverside Water and Wastewater Financing Authority, Local Agency Revenue Refunding Bonds, 2013 Series A-1 and A-2
Annual Disclosure Report for Fiscal Year Ending June 30, 2018
38
Table 5-7
CFD 2003-14 IA B Maximum Special Tax Information
Development Status Parcel Count
Total Special Tax
FY 2018-19
Maximum Tax
FY 2018-19
Percent of
Maximum Tax
Developed 227 $261,134.22 $612,763.59 42.62%
Table 5-8
CFD 2003-14 IA C Maximum Special Tax Information
Development Status Parcel Count
Total Special Tax
FY 2018-19
Maximum Tax
FY 2018-19
Percent of
Maximum Tax
Developed 108 $138,477.86 $309,848.76 44.69%
Table 5-9
CFD 2003-15 IA A Maximum Special Tax Information
Development Status Parcel Count
Total Special Tax
FY 2018-19
Maximum Tax
FY 2018-19
Percent of
Maximum Tax
Developed 143 $433,911.06 $697,035.54 62.25%
Table 5-10
CFD 2003-16 Maximum Special Tax Information
Development Status Parcel Count
Total Special Tax
FY 2018-19
Maximum Tax
FY 2018-19
Percent of
Maximum Tax
Developed 404 $252,389.52 $406,961.69 62.02%
Table 5-11
CFD 2003-19 IA A Maximum Special Tax Information
Development Status Parcel Count
Total Special Tax
FY 2018-19
Maximum Tax
FY 2018-19
Percent of
Maximum Tax
Developed 100 $164,298.62 $246,003.60 66.79%
Table 5-12
CFD 2003-19 IA B Maximum Special Tax Information
Development Status Parcel Count
Total Special Tax
FY 2018-19
Maximum Tax
FY 2018-19
Percent of
Maximum Tax
Developed 192 $285,073.06 $476,678.40 59.80%
Table 5-13
CFD 2003-20 IA A Maximum Special Tax Information
Development Status Parcel Count
Total Special Tax
FY 2018-19
Maximum Tax
FY 2018-19
Percent of
Maximum Tax
Developed 114 $114,029.92 $166,295.08 68.57%
Page 41
Section 5 Special Tax Information
Western Riverside Water and Wastewater Financing Authority, Local Agency Revenue Refunding Bonds, 2013 Series A-1 and A-2
Annual Disclosure Report for Fiscal Year Ending June 30, 2018
39
Table 5-14
CFD 2003-25 IA D Maximum Special Tax Information
Development Status Parcel Count
Total Special Tax
FY 2018-19
Maximum Tax
FY 2018-19
Percent of
Maximum Tax
Developed 181 $241,072.04 $416,791.60 57.84%
Table 5-15
CFD 2004-26 IA 1 Maximum Special Tax Information
Development Status Parcel Count
Total Special Tax
FY 2018-19
Maximum Tax
FY 2018-19
Percent of
Maximum Tax
Developed 337 $356,692.76 $545,918.26 65.34%
Table 5-16
CFD 2004-26 IA 2 Maximum Special Tax Information
Development Status Parcel Count
Total Special Tax
FY 2018-19
Maximum Tax
FY 2018-19
Percent of
Maximum Tax
Developing 194 $221,130.44 $315,558.72 70.08%
Table 5-17
CFD 2004-28 Maximum Special Tax Information
Development Status Parcel Count
Total Special Tax
FY 2018-19
Maximum Tax
FY 2018-19
Percent of
Maximum Tax
Developed 215 $298,504.20 $496,037.00 60.18%
Table 5-18
CFD 2004-30 Maximum Special Tax Information
Development Status Parcel Count
Total Special Tax
FY 2018-19
Maximum Tax
FY 2018-19
Percent of
Maximum Tax
Developed 193 $187,826.96 $370,629.80 50.68%
Table 5-19
CFD 2004-35 IA C Maximum Special Tax Information
Development Status Parcel Count
Total Special Tax
FY 2018-19
Maximum Tax
FY 2018-19
Percent of
Maximum Tax
Developed 77 $80,987.32 $119,495.90 67.77%
Table 5-20
CFD 2004-36 Maximum Special Tax Information
Development Status Parcel Count
Total Special Tax
FY 2018-19
Maximum Tax
FY 2018-19
Percent of
Maximum Tax
Developed 371 $364,864.56 $693,456.21 52.62%
Page 42
Section 5 Special Tax Information
Western Riverside Water and Wastewater Financing Authority, Local Agency Revenue Refunding Bonds, 2013 Series A-1 and A-2
Annual Disclosure Report for Fiscal Year Ending June 30, 2018
40
Table 5-21
CFD 2005-38 IA A Maximum Special Tax Information
Development Status Parcel Count
Total Special Tax
FY 2018-19
Maximum Tax
FY 2018-19
Percent of
Maximum Tax
Developed 234 $209,684.56 $414,228.08 50.62%
Page 43
Section 6 Material Events
Western Riverside Water and Wastewater Financing Authority, Local Agency Revenue Refunding Bonds, 2013 Series A-1 and A-2
Annual Disclosure Report for Fiscal Year Ending June 30, 2018
41
The following events as set forth in Rule 15c2-12 promulgated by the Securities and Exchange Commission are
considered material by the District.
Section 5a
Significant Events
Occurred in FY
2017-18 Date of Event
1. Principal and interest payment delinquencies; No Not Applicable
2. Unscheduled draws on debt service reserves reflecting financial
difficulties;
No Not Applicable
3. Unscheduled draws on credit enhancements reflecting financial
difficulties;
No Not Applicable
4. Substitution of credit or liquidity providers, or their failure to
perform;
No Not Applicable
5. Adverse tax opinions or the issuance by the Internal Revenue
Service of proposed or final determinations of taxability or of a
Notice of Proposed Issue (IRS Form 5701-TEB);
No Not Applicable
6. Tender offers; No Not Applicable
7. Defeasances; No Not Applicable
8. Ratings changes; and Yes 6/11/2018
9. Bankruptcy, insolvency, receivership or similar proceedings. No Not Applicable
Section 5b
Significant Events
Occurred in FY
2017-18 Date of Event
1. Unless described in section 5(a)(5) above, notices or
determinations by the Internal Revenue Service with respect to the
tax status of the Bonds or other material events affecting the tax
status of the Bonds;
No Not Applicable
2. The consummation of a merger, consolidation or acquisition
involving an obligated person or the sale of all or substantially all of
the assets of the obligated person, other than in the ordinary
course of business, the entry into a definitive agreement to
undertake such an action or the termination of a definitive
agreement relating to any such actions, other than pursuant to its
terms;
No Not Applicable
3. Appointment of a successor or additional trustee or the change of
the name of the trustee;
No Not Applicable
4. Nonpayment related defaults; No Not Applicable
5. Modifications to the rights of Owners of the Bonds; No Not Applicable
6. Notices of redemption; and No Not Applicable
7. Release, substitution or sale of property securing repayment of the
Bonds.
No Not Applicable
Page 44
APPENDIX A
Debt Service Schedules
Page 45
Eastern Municipal Water District
(PFA 2013 Authority) Series A1/A2
PaymentDate
InterestRate Principal
Principal Outstanding Interest
Semi Annual Debt Service
Annual Debt Service
CallPremium
9/1/2013 0.0000% $0.00 $54,175,000.00 $0.00 $0.00 $0.00 0.0000%
3/1/2014 $54,175,000.00 $1,383,727.00 $1,383,727.00 0.0000%
9/1/2014 2.0000% $1,245,000.00 $52,930,000.00 $1,383,727.00 $2,628,727.00 $4,012,454.00 0.0000%
3/1/2015 $52,930,000.00 $1,162,412.50 $1,162,412.50 0.0000%
9/1/2015 3.0000% $1,680,000.00 $51,250,000.00 $1,162,412.50 $2,842,412.50 $4,004,825.00 0.0000%
3/1/2016 $51,250,000.00 $1,137,212.50 $1,137,212.50 0.0000%
9/1/2016 4.0000% $1,715,000.00 $49,535,000.00 $1,137,212.50 $2,852,212.50 $3,989,425.00 0.0000%
3/1/2017 $49,535,000.00 $1,102,912.50 $1,102,912.50 0.0000%
9/1/2017 4.0000% $1,785,000.00 $47,750,000.00 $1,102,912.50 $2,887,912.50 $3,990,825.00 0.0000%
3/1/2018 $47,750,000.00 $1,067,212.50 $1,067,212.50 0.0000%
9/1/2018 4.0000% $1,850,000.00 $45,900,000.00 $1,067,212.50 $2,917,212.50 $3,984,425.00 0.0000%
3/1/2019 $45,900,000.00 $1,030,212.50 $1,030,212.50 0.0000%
9/1/2019 4.0000% $1,905,000.00 $43,995,000.00 $1,030,212.50 $2,935,212.50 $3,965,425.00 0.0000%
3/1/2020 $43,995,000.00 $992,112.50 $992,112.50 0.0000%
9/1/2020 4.0000% $1,970,000.00 $42,025,000.00 $992,112.50 $2,962,112.50 $3,954,225.00 0.0000%
3/1/2021 $42,025,000.00 $952,712.50 $952,712.50 0.0000%
9/1/2021 5.0000% $2,010,000.00 $40,015,000.00 $952,712.50 $2,962,712.50 $3,915,425.00 0.0000%
3/1/2022 $40,015,000.00 $902,462.50 $902,462.50 0.0000%
9/1/2022 5.0000% $2,105,000.00 $37,910,000.00 $902,462.50 $3,007,462.50 $3,909,925.00 0.0000%
3/1/2023 $37,910,000.00 $849,837.50 $849,837.50 0.0000%
9/1/2023 3.3750% $2,200,000.00 $35,710,000.00 $849,837.50 $3,049,837.50 $3,899,675.00 0.0000%
3/1/2024 $35,710,000.00 $812,712.50 $812,712.50 0.0000%
9/1/2024 4.0000% $2,270,000.00 $33,440,000.00 $812,712.50 $3,082,712.50 $3,895,425.00 0.0000%
3/1/2025 $33,440,000.00 $767,312.50 $767,312.50 0.0000%
9/1/2025 5.0000% $2,360,000.00 $31,080,000.00 $767,312.50 $3,127,312.50 $3,894,625.00 0.0000%
3/1/2026 $31,080,000.00 $708,312.50 $708,312.50 0.0000%
9/1/2026 5.0000% $2,470,000.00 $28,610,000.00 $708,312.50 $3,178,312.50 $3,886,625.00 0.0000%
3/1/2027 $28,610,000.00 $646,562.50 $646,562.50 0.0000%
9/1/2027 5.0000% $2,600,000.00 $26,010,000.00 $646,562.50 $3,246,562.50 $3,893,125.00 0.0000%
3/1/2028 $26,010,000.00 $581,562.50 $581,562.50 0.0000%
9/1/2028 5.0000% $2,735,000.00 $23,275,000.00 $581,562.50 $3,316,562.50 $3,898,125.00 0.0000%
3/1/2029 $23,275,000.00 $513,187.50 $513,187.50 0.0000%
9/1/2029 4.0000% $2,840,000.00 $20,435,000.00 $513,187.50 $3,353,187.50 $3,866,375.00 0.0000%
3/1/2030 $20,435,000.00 $456,387.50 $456,387.50 0.0000%
9/1/2030 4.0000% $2,940,000.00 $17,495,000.00 $456,387.50 $3,396,387.50 $3,852,775.00 0.0000%
3/1/2031 $17,495,000.00 $397,587.50 $397,587.50 0.0000%
9/1/2031 4.1250% $3,040,000.00 $14,455,000.00 $397,587.50 $3,437,587.50 $3,835,175.00 0.0000%
3/1/2032 $14,455,000.00 $334,887.50 $334,887.50 0.0000%
9/1/2032 4.2500% $3,160,000.00 $11,295,000.00 $334,887.50 $3,494,887.50 $3,829,775.00 0.0000%
3/1/2033 $11,295,000.00 $267,737.50 $267,737.50 0.0000%
9/1/2033 4.2500% $3,290,000.00 $8,005,000.00 $267,737.50 $3,557,737.50 $3,825,475.00 0.0000%
3/1/2034 $8,005,000.00 $197,825.00 $197,825.00 0.0000%
9/1/2034 5.0000% $3,310,000.00 $4,695,000.00 $197,825.00 $3,507,825.00 $3,705,650.00 0.0000%
3/1/2035 $4,695,000.00 $115,075.00 $115,075.00 0.0000%
9/1/2035 5.0000% $2,855,000.00 $1,840,000.00 $115,075.00 $2,970,075.00 $3,085,150.00 0.0000%
3/1/2036 $1,840,000.00 $43,700.00 $43,700.00 0.0000%
Execution Time: 1/12/2017 8:48:54 AMAlbert A. Webb Associates Page 1 of 2
Debt Service Schedule - Current
Page 46
Eastern Municipal Water District
(PFA 2013 Authority) Series A1/A2
PaymentDate
InterestRate Principal
Principal Outstanding Interest
Semi Annual Debt Service
Annual Debt Service
CallPremium
9/1/2036 4.7500% $1,090,000.00 $750,000.00 $43,700.00 $1,133,700.00 $1,177,400.00 0.0000%
3/1/2037 $750,000.00 $17,812.50 $17,812.50 0.0000%
9/1/2037 4.7500% $750,000.00 $0.00 $17,812.50 $767,812.50 $785,625.00 0.0000%
Totals: $54,175,000.00 $32,882,954.00 $87,057,954.00 $87,057,954.00
Bond Issue Date: 6/27/2013
Original Bond Principal: $645,000.00
Execution Time: 1/12/2017 8:48:54 AMAlbert A. Webb Associates Page 2 of 2
Debt Service Schedule - Current
Page 47
Eastern Municipal Water District 685392 - CFD 2002-04 IA 3 (2013 PFA) (Original)
PaymentDate
InterestRate Principal
Principal Outstanding Interest
Semi Annual Debt Service
Annual Debt Service
CallPremium
9/1/2014 2.0000% $20,000.00 $625,000.00 $32,396.25 $52,396.25 $52,396.25 3.0000%
3/1/2015 $625,000.00 $13,553.13 $13,553.13 0.0000%
9/1/2015 3.0000% $25,000.00 $600,000.00 $13,553.13 $38,553.13 $52,106.26 3.0000%
3/1/2016 $600,000.00 $13,178.13 $13,178.13 0.0000%
9/1/2016 4.0000% $25,000.00 $575,000.00 $13,178.13 $38,178.13 $51,356.26 3.0000%
3/1/2017 $575,000.00 $12,678.13 $12,678.13 0.0000%
9/1/2017 4.0000% $30,000.00 $545,000.00 $12,678.13 $42,678.13 $55,356.26 3.0000%
3/1/2018 $545,000.00 $12,078.13 $12,078.13 0.0000%
9/1/2018 4.0000% $25,000.00 $520,000.00 $12,078.13 $37,078.13 $49,156.26 3.0000%
3/1/2019 $520,000.00 $11,578.13 $11,578.13 0.0000%
9/1/2019 4.0000% $25,000.00 $495,000.00 $11,578.13 $36,578.13 $48,156.26 3.0000%
3/1/2020 $495,000.00 $11,078.13 $11,078.13 0.0000%
9/1/2020 4.0000% $25,000.00 $470,000.00 $11,078.13 $36,078.13 $47,156.26 3.0000%
3/1/2021 $470,000.00 $10,578.13 $10,578.13 0.0000%
9/1/2021 5.0000% $30,000.00 $440,000.00 $10,578.13 $40,578.13 $51,156.26 2.0000%
3/1/2022 $440,000.00 $9,828.13 $9,828.13 0.0000%
9/1/2022 5.0000% $30,000.00 $410,000.00 $9,828.13 $39,828.13 $49,656.26 1.0000%
3/1/2023 $410,000.00 $9,078.13 $9,078.13 0.0000%
9/1/2023 3.3750% $30,000.00 $380,000.00 $9,078.13 $39,078.13 $48,156.26 0.0000%
3/1/2024 $380,000.00 $8,571.88 $8,571.88 0.0000%
9/1/2024 4.0000% $30,000.00 $350,000.00 $8,571.88 $38,571.88 $47,143.76 0.0000%
3/1/2025 $350,000.00 $7,971.88 $7,971.88 0.0000%
9/1/2025 5.0000% $35,000.00 $315,000.00 $7,971.88 $42,971.88 $50,943.76 0.0000%
3/1/2026 $315,000.00 $7,096.88 $7,096.88 0.0000%
9/1/2026 5.0000% $30,000.00 $285,000.00 $7,096.88 $37,096.88 $44,193.76 0.0000%
3/1/2027 $285,000.00 $6,346.88 $6,346.88 0.0000%
9/1/2027 5.0000% $35,000.00 $250,000.00 $6,346.88 $41,346.88 $47,693.76 0.0000%
3/1/2028 $250,000.00 $5,471.88 $5,471.88 0.0000%
9/1/2028 5.0000% $30,000.00 $220,000.00 $5,471.88 $35,471.88 $40,943.76 0.0000%
3/1/2029 $220,000.00 $4,721.88 $4,721.88 0.0000%
9/1/2029 4.0000% $30,000.00 $190,000.00 $4,721.88 $34,721.88 $39,443.76 0.0000%
3/1/2030 $190,000.00 $4,121.88 $4,121.88 0.0000%
9/1/2030 4.0000% $35,000.00 $155,000.00 $4,121.88 $39,121.88 $43,243.76 0.0000%
3/1/2031 $155,000.00 $3,421.88 $3,421.88 0.0000%
9/1/2031 4.1250% $35,000.00 $120,000.00 $3,421.88 $38,421.88 $41,843.76 0.0000%
3/1/2032 $120,000.00 $2,700.00 $2,700.00 0.0000%
9/1/2032 4.2500% $40,000.00 $80,000.00 $2,700.00 $42,700.00 $45,400.00 0.0000%
3/1/2033 $80,000.00 $1,850.00 $1,850.00 0.0000%
9/1/2033 4.2500% $40,000.00 $40,000.00 $1,850.00 $41,850.00 $43,700.00 0.0000%
3/1/2034 $40,000.00 $1,000.00 $1,000.00 0.0000%
9/1/2034 5.0000% $40,000.00 $0.00 $1,000.00 $41,000.00 $42,000.00 0.0000%
Totals: $645,000.00 $346,202.67 $991,202.67 $991,202.67
Bond Issue Date: 6/27/2013
Original Bond Principal: $645,000.00
Execution Time: 1/12/2017 8:27:35 AMAlbert A. Webb Associates Page 1 of 1
Debt Service Schedule - Current
Page 48
Eastern Municipal Water District 685393 - CFD 2002-04 IA 4 (2013 PFA) (Original)
PaymentDate
InterestRate Principal
Principal Outstanding Interest
Semi Annual Debt Service
Annual Debt Service
CallPremium
9/1/2014 2.0000% $15,000.00 $475,000.00 $24,689.17 $39,689.17 $39,689.17 3.0000%
3/1/2015 $475,000.00 $10,331.25 $10,331.25 0.0000%
9/1/2015 3.0000% $15,000.00 $460,000.00 $10,331.25 $25,331.25 $35,662.50 3.0000%
3/1/2016 $460,000.00 $10,106.25 $10,106.25 0.0000%
9/1/2016 4.0000% $15,000.00 $445,000.00 $10,106.25 $25,106.25 $35,212.50 3.0000%
3/1/2017 $445,000.00 $9,806.25 $9,806.25 0.0000%
9/1/2017 4.0000% $20,000.00 $425,000.00 $9,806.25 $29,806.25 $39,612.50 3.0000%
3/1/2018 $425,000.00 $9,406.25 $9,406.25 0.0000%
9/1/2018 4.0000% $20,000.00 $405,000.00 $9,406.25 $29,406.25 $38,812.50 3.0000%
3/1/2019 $405,000.00 $9,006.25 $9,006.25 0.0000%
9/1/2019 4.0000% $20,000.00 $385,000.00 $9,006.25 $29,006.25 $38,012.50 3.0000%
3/1/2020 $385,000.00 $8,606.25 $8,606.25 0.0000%
9/1/2020 4.0000% $20,000.00 $365,000.00 $8,606.25 $28,606.25 $37,212.50 3.0000%
3/1/2021 $365,000.00 $8,206.25 $8,206.25 0.0000%
9/1/2021 5.0000% $20,000.00 $345,000.00 $8,206.25 $28,206.25 $36,412.50 2.0000%
3/1/2022 $345,000.00 $7,706.25 $7,706.25 0.0000%
9/1/2022 5.0000% $20,000.00 $325,000.00 $7,706.25 $27,706.25 $35,412.50 1.0000%
3/1/2023 $325,000.00 $7,206.25 $7,206.25 0.0000%
9/1/2023 3.3750% $25,000.00 $300,000.00 $7,206.25 $32,206.25 $39,412.50 0.0000%
3/1/2024 $300,000.00 $6,784.38 $6,784.38 0.0000%
9/1/2024 4.0000% $25,000.00 $275,000.00 $6,784.38 $31,784.38 $38,568.76 0.0000%
3/1/2025 $275,000.00 $6,284.38 $6,284.38 0.0000%
9/1/2025 5.0000% $25,000.00 $250,000.00 $6,284.38 $31,284.38 $37,568.76 0.0000%
3/1/2026 $250,000.00 $5,659.38 $5,659.38 0.0000%
9/1/2026 5.0000% $25,000.00 $225,000.00 $5,659.38 $30,659.38 $36,318.76 0.0000%
3/1/2027 $225,000.00 $5,034.38 $5,034.38 0.0000%
9/1/2027 5.0000% $30,000.00 $195,000.00 $5,034.38 $35,034.38 $40,068.76 0.0000%
3/1/2028 $195,000.00 $4,284.38 $4,284.38 0.0000%
9/1/2028 5.0000% $30,000.00 $165,000.00 $4,284.38 $34,284.38 $38,568.76 0.0000%
3/1/2029 $165,000.00 $3,534.38 $3,534.38 0.0000%
9/1/2029 4.0000% $25,000.00 $140,000.00 $3,534.38 $28,534.38 $32,068.76 0.0000%
3/1/2030 $140,000.00 $3,034.38 $3,034.38 0.0000%
9/1/2030 4.0000% $30,000.00 $110,000.00 $3,034.38 $33,034.38 $36,068.76 0.0000%
3/1/2031 $110,000.00 $2,434.38 $2,434.38 0.0000%
9/1/2031 4.1250% $25,000.00 $85,000.00 $2,434.38 $27,434.38 $29,868.76 0.0000%
3/1/2032 $85,000.00 $1,918.75 $1,918.75 0.0000%
9/1/2032 4.2500% $25,000.00 $60,000.00 $1,918.75 $26,918.75 $28,837.50 0.0000%
3/1/2033 $60,000.00 $1,387.50 $1,387.50 0.0000%
9/1/2033 4.2500% $30,000.00 $30,000.00 $1,387.50 $31,387.50 $32,775.00 0.0000%
3/1/2034 $30,000.00 $750.00 $750.00 0.0000%
9/1/2034 5.0000% $30,000.00 $0.00 $750.00 $30,750.00 $31,500.00 0.0000%
Totals: $490,000.00 $267,664.25 $757,664.25 $757,664.25
Bond Issue Date: 6/27/2013
Original Bond Principal: $490,000.00
Execution Time: 1/12/2017 8:28:23 AMAlbert A. Webb Associates Page 1 of 1
Debt Service Schedule - Current
Page 49
Eastern Municipal Water District 685398 - CFD 2002-09 (2013 PFA) (Original)
PaymentDate
InterestRate Principal
Principal Outstanding Interest
Semi Annual Debt Service
Annual Debt Service
CallPremium
9/1/2014 2.0000% $45,000.00 $1,360,000.00 $69,702.36 $114,702.36 $114,702.36 3.0000%
3/1/2015 $1,360,000.00 $29,140.63 $29,140.63 0.0000%
9/1/2015 3.0000% $55,000.00 $1,305,000.00 $29,140.63 $84,140.63 $113,281.26 3.0000%
3/1/2016 $1,305,000.00 $28,315.63 $28,315.63 0.0000%
9/1/2016 4.0000% $60,000.00 $1,245,000.00 $28,315.63 $88,315.63 $116,631.26 3.0000%
3/1/2017 $1,245,000.00 $27,115.63 $27,115.63 0.0000%
9/1/2017 4.0000% $60,000.00 $1,185,000.00 $27,115.63 $87,115.63 $114,231.26 3.0000%
3/1/2018 $1,185,000.00 $25,915.63 $25,915.63 0.0000%
9/1/2018 4.0000% $60,000.00 $1,125,000.00 $25,915.63 $85,915.63 $111,831.26 3.0000%
3/1/2019 $1,125,000.00 $24,715.63 $24,715.63 0.0000%
9/1/2019 4.0000% $55,000.00 $1,070,000.00 $24,715.63 $79,715.63 $104,431.26 3.0000%
3/1/2020 $1,070,000.00 $23,615.63 $23,615.63 0.0000%
9/1/2020 4.0000% $60,000.00 $1,010,000.00 $23,615.63 $83,615.63 $107,231.26 3.0000%
3/1/2021 $1,010,000.00 $22,415.63 $22,415.63 0.0000%
9/1/2021 5.0000% $60,000.00 $950,000.00 $22,415.63 $82,415.63 $104,831.26 2.0000%
3/1/2022 $950,000.00 $20,915.63 $20,915.63 0.0000%
9/1/2022 5.0000% $65,000.00 $885,000.00 $20,915.63 $85,915.63 $106,831.26 1.0000%
3/1/2023 $885,000.00 $19,290.63 $19,290.63 0.0000%
9/1/2023 3.3750% $65,000.00 $820,000.00 $19,290.63 $84,290.63 $103,581.26 0.0000%
3/1/2024 $820,000.00 $18,193.75 $18,193.75 0.0000%
9/1/2024 4.0000% $70,000.00 $750,000.00 $18,193.75 $88,193.75 $106,387.50 0.0000%
3/1/2025 $750,000.00 $16,793.75 $16,793.75 0.0000%
9/1/2025 5.0000% $70,000.00 $680,000.00 $16,793.75 $86,793.75 $103,587.50 0.0000%
3/1/2026 $680,000.00 $15,043.75 $15,043.75 0.0000%
9/1/2026 5.0000% $75,000.00 $605,000.00 $15,043.75 $90,043.75 $105,087.50 0.0000%
3/1/2027 $605,000.00 $13,168.75 $13,168.75 0.0000%
9/1/2027 5.0000% $75,000.00 $530,000.00 $13,168.75 $88,168.75 $101,337.50 0.0000%
3/1/2028 $530,000.00 $11,293.75 $11,293.75 0.0000%
9/1/2028 5.0000% $80,000.00 $450,000.00 $11,293.75 $91,293.75 $102,587.50 0.0000%
3/1/2029 $450,000.00 $9,293.75 $9,293.75 0.0000%
9/1/2029 4.0000% $85,000.00 $365,000.00 $9,293.75 $94,293.75 $103,587.50 0.0000%
3/1/2030 $365,000.00 $7,593.75 $7,593.75 0.0000%
9/1/2030 4.0000% $85,000.00 $280,000.00 $7,593.75 $92,593.75 $100,187.50 0.0000%
3/1/2031 $280,000.00 $5,893.75 $5,893.75 0.0000%
9/1/2031 4.1250% $90,000.00 $190,000.00 $5,893.75 $95,893.75 $101,787.50 0.0000%
3/1/2032 $190,000.00 $4,037.50 $4,037.50 0.0000%
9/1/2032 4.2500% $95,000.00 $95,000.00 $4,037.50 $99,037.50 $103,075.00 0.0000%
3/1/2033 $95,000.00 $2,018.75 $2,018.75 0.0000%
9/1/2033 4.2500% $95,000.00 $0.00 $2,018.75 $97,018.75 $99,037.50 0.0000%
Totals: $1,405,000.00 $719,246.20 $2,124,246.20 $2,124,246.20
Bond Issue Date: 6/27/2013
Original Bond Principal: $1,405,000.00
Execution Time: 1/12/2017 8:29:23 AMAlbert A. Webb Associates Page 1 of 1
Debt Service Schedule - Current
Page 50
Eastern Municipal Water District 685386 - CFD 2003-12 IA A (2013 PFA) (Original)
PaymentDate
InterestRate Principal
Principal Outstanding Interest
Semi Annual Debt Service
Annual Debt Service
CallPremium
9/1/2014 2.0000% $45,000.00 $1,820,000.00 $94,229.58 $139,229.58 $139,229.58 3.0000%
3/1/2015 $1,820,000.00 $39,553.13 $39,553.13 0.0000%
9/1/2015 3.0000% $60,000.00 $1,760,000.00 $39,553.13 $99,553.13 $139,106.26 3.0000%
3/1/2016 $1,760,000.00 $38,653.13 $38,653.13 0.0000%
9/1/2016 4.0000% $65,000.00 $1,695,000.00 $38,653.13 $103,653.13 $142,306.26 3.0000%
3/1/2017 $1,695,000.00 $37,353.13 $37,353.13 0.0000%
9/1/2017 4.0000% $70,000.00 $1,625,000.00 $37,353.13 $107,353.13 $144,706.26 3.0000%
3/1/2018 $1,625,000.00 $35,953.13 $35,953.13 0.0000%
9/1/2018 4.0000% $70,000.00 $1,555,000.00 $35,953.13 $105,953.13 $141,906.26 3.0000%
3/1/2019 $1,555,000.00 $34,553.13 $34,553.13 0.0000%
9/1/2019 4.0000% $75,000.00 $1,480,000.00 $34,553.13 $109,553.13 $144,106.26 3.0000%
3/1/2020 $1,480,000.00 $33,053.13 $33,053.13 0.0000%
9/1/2020 4.0000% $75,000.00 $1,405,000.00 $33,053.13 $108,053.13 $141,106.26 3.0000%
3/1/2021 $1,405,000.00 $31,553.13 $31,553.13 0.0000%
9/1/2021 5.0000% $75,000.00 $1,330,000.00 $31,553.13 $106,553.13 $138,106.26 2.0000%
3/1/2022 $1,330,000.00 $29,678.13 $29,678.13 0.0000%
9/1/2022 5.0000% $80,000.00 $1,250,000.00 $29,678.13 $109,678.13 $139,356.26 1.0000%
3/1/2023 $1,250,000.00 $27,678.13 $27,678.13 0.0000%
9/1/2023 3.3750% $80,000.00 $1,170,000.00 $27,678.13 $107,678.13 $135,356.26 0.0000%
3/1/2024 $1,170,000.00 $26,328.13 $26,328.13 0.0000%
9/1/2024 4.0000% $85,000.00 $1,085,000.00 $26,328.13 $111,328.13 $137,656.26 0.0000%
3/1/2025 $1,085,000.00 $24,628.13 $24,628.13 0.0000%
9/1/2025 5.0000% $90,000.00 $995,000.00 $24,628.13 $114,628.13 $139,256.26 0.0000%
3/1/2026 $995,000.00 $22,378.13 $22,378.13 0.0000%
9/1/2026 5.0000% $95,000.00 $900,000.00 $22,378.13 $117,378.13 $139,756.26 0.0000%
3/1/2027 $900,000.00 $20,003.13 $20,003.13 0.0000%
9/1/2027 5.0000% $95,000.00 $805,000.00 $20,003.13 $115,003.13 $135,006.26 0.0000%
3/1/2028 $805,000.00 $17,628.13 $17,628.13 0.0000%
9/1/2028 5.0000% $100,000.00 $705,000.00 $17,628.13 $117,628.13 $135,256.26 0.0000%
3/1/2029 $705,000.00 $15,128.13 $15,128.13 0.0000%
9/1/2029 4.0000% $105,000.00 $600,000.00 $15,128.13 $120,128.13 $135,256.26 0.0000%
3/1/2030 $600,000.00 $13,028.13 $13,028.13 0.0000%
9/1/2030 4.0000% $110,000.00 $490,000.00 $13,028.13 $123,028.13 $136,056.26 0.0000%
3/1/2031 $490,000.00 $10,828.13 $10,828.13 0.0000%
9/1/2031 4.1250% $115,000.00 $375,000.00 $10,828.13 $125,828.13 $136,656.26 0.0000%
3/1/2032 $375,000.00 $8,456.25 $8,456.25 0.0000%
9/1/2032 4.2500% $120,000.00 $255,000.00 $8,456.25 $128,456.25 $136,912.50 0.0000%
3/1/2033 $255,000.00 $5,906.25 $5,906.25 0.0000%
9/1/2033 4.2500% $125,000.00 $130,000.00 $5,906.25 $130,906.25 $136,812.50 0.0000%
3/1/2034 $130,000.00 $3,250.00 $3,250.00 0.0000%
9/1/2034 5.0000% $130,000.00 $0.00 $3,250.00 $133,250.00 $136,500.00 0.0000%
Totals: $1,865,000.00 $1,045,411.00 $2,910,411.00 $2,910,411.00
Bond Issue Date: 6/27/2013
Original Bond Principal: $1,865,000.00
Execution Time: 1/12/2017 8:30:20 AMAlbert A. Webb Associates Page 1 of 1
Debt Service Schedule - Current
Page 51
Eastern Municipal Water District 685387 - CFD 2003-12 IA B (2013 PFA) (Original)
PaymentDate
InterestRate Principal
Principal Outstanding Interest
Semi Annual Debt Service
Annual Debt Service
CallPremium
9/1/2014 2.0000% $65,000.00 $2,445,000.00 $126,750.97 $191,750.97 $191,750.97 3.0000%
3/1/2015 $2,445,000.00 $53,159.38 $53,159.38 0.0000%
9/1/2015 3.0000% $85,000.00 $2,360,000.00 $53,159.38 $138,159.38 $191,318.76 3.0000%
3/1/2016 $2,360,000.00 $51,884.38 $51,884.38 0.0000%
9/1/2016 4.0000% $85,000.00 $2,275,000.00 $51,884.38 $136,884.38 $188,768.76 3.0000%
3/1/2017 $2,275,000.00 $50,184.38 $50,184.38 0.0000%
9/1/2017 4.0000% $85,000.00 $2,190,000.00 $50,184.38 $135,184.38 $185,368.76 3.0000%
3/1/2018 $2,190,000.00 $48,484.38 $48,484.38 0.0000%
9/1/2018 4.0000% $90,000.00 $2,100,000.00 $48,484.38 $138,484.38 $186,968.76 3.0000%
3/1/2019 $2,100,000.00 $46,684.38 $46,684.38 0.0000%
9/1/2019 4.0000% $95,000.00 $2,005,000.00 $46,684.38 $141,684.38 $188,368.76 3.0000%
3/1/2020 $2,005,000.00 $44,784.38 $44,784.38 0.0000%
9/1/2020 4.0000% $100,000.00 $1,905,000.00 $44,784.38 $144,784.38 $189,568.76 3.0000%
3/1/2021 $1,905,000.00 $42,784.38 $42,784.38 0.0000%
9/1/2021 5.0000% $105,000.00 $1,800,000.00 $42,784.38 $147,784.38 $190,568.76 2.0000%
3/1/2022 $1,800,000.00 $40,159.38 $40,159.38 0.0000%
9/1/2022 5.0000% $110,000.00 $1,690,000.00 $40,159.38 $150,159.38 $190,318.76 1.0000%
3/1/2023 $1,690,000.00 $37,409.38 $37,409.38 0.0000%
9/1/2023 3.3750% $110,000.00 $1,580,000.00 $37,409.38 $147,409.38 $184,818.76 0.0000%
3/1/2024 $1,580,000.00 $35,553.13 $35,553.13 0.0000%
9/1/2024 4.0000% $115,000.00 $1,465,000.00 $35,553.13 $150,553.13 $186,106.26 0.0000%
3/1/2025 $1,465,000.00 $33,253.13 $33,253.13 0.0000%
9/1/2025 5.0000% $120,000.00 $1,345,000.00 $33,253.13 $153,253.13 $186,506.26 0.0000%
3/1/2026 $1,345,000.00 $30,253.13 $30,253.13 0.0000%
9/1/2026 5.0000% $125,000.00 $1,220,000.00 $30,253.13 $155,253.13 $185,506.26 0.0000%
3/1/2027 $1,220,000.00 $27,128.13 $27,128.13 0.0000%
9/1/2027 5.0000% $130,000.00 $1,090,000.00 $27,128.13 $157,128.13 $184,256.26 0.0000%
3/1/2028 $1,090,000.00 $23,878.13 $23,878.13 0.0000%
9/1/2028 5.0000% $140,000.00 $950,000.00 $23,878.13 $163,878.13 $187,756.26 0.0000%
3/1/2029 $950,000.00 $20,378.13 $20,378.13 0.0000%
9/1/2029 4.0000% $145,000.00 $805,000.00 $20,378.13 $165,378.13 $185,756.26 0.0000%
3/1/2030 $805,000.00 $17,478.13 $17,478.13 0.0000%
9/1/2030 4.0000% $150,000.00 $655,000.00 $17,478.13 $167,478.13 $184,956.26 0.0000%
3/1/2031 $655,000.00 $14,478.13 $14,478.13 0.0000%
9/1/2031 4.1250% $155,000.00 $500,000.00 $14,478.13 $169,478.13 $183,956.26 0.0000%
3/1/2032 $500,000.00 $11,281.25 $11,281.25 0.0000%
9/1/2032 4.2500% $160,000.00 $340,000.00 $11,281.25 $171,281.25 $182,562.50 0.0000%
3/1/2033 $340,000.00 $7,881.25 $7,881.25 0.0000%
9/1/2033 4.2500% $165,000.00 $175,000.00 $7,881.25 $172,881.25 $180,762.50 0.0000%
3/1/2034 $175,000.00 $4,375.00 $4,375.00 0.0000%
9/1/2034 5.0000% $175,000.00 $0.00 $4,375.00 $179,375.00 $183,750.00 0.0000%
Totals: $2,510,000.00 $1,409,694.89 $3,919,694.89 $3,919,694.89
Bond Issue Date: 6/27/2013
Original Bond Principal: $2,510,000.00
Execution Time: 1/12/2017 8:30:53 AMAlbert A. Webb Associates Page 1 of 1
Debt Service Schedule - Current
Page 52
Eastern Municipal Water District CFD 2003-14 IA A (2013 PFA) (Original)
PaymentDate
InterestRate Principal
Principal Outstanding Interest
Semi Annual Debt Service
Annual Debt Service
CallPremium
3/1/2014 $1,435,000.00 $42,153.54 $42,153.54 0.0000%
9/1/2014 2.0000% $35,000.00 $1,400,000.00 $31,096.88 $66,096.88 $108,250.42 0.0000%
3/1/2015 $1,400,000.00 $30,746.88 $30,746.88 0.0000%
9/1/2015 3.0000% $45,000.00 $1,355,000.00 $30,746.88 $75,746.88 $106,493.76 0.0000%
3/1/2016 $1,355,000.00 $30,071.88 $30,071.88 0.0000%
9/1/2016 4.0000% $50,000.00 $1,305,000.00 $30,071.88 $80,071.88 $110,143.76 0.0000%
3/1/2017 $1,305,000.00 $29,071.88 $29,071.88 0.0000%
9/1/2017 4.0000% $50,000.00 $1,255,000.00 $29,071.88 $79,071.88 $108,143.76 0.0000%
3/1/2018 $1,255,000.00 $28,071.88 $28,071.88 0.0000%
9/1/2018 4.0000% $50,000.00 $1,205,000.00 $28,071.88 $78,071.88 $106,143.76 0.0000%
3/1/2019 $1,205,000.00 $27,071.88 $27,071.88 0.0000%
9/1/2019 4.0000% $50,000.00 $1,155,000.00 $27,071.88 $77,071.88 $104,143.76 0.0000%
3/1/2020 $1,155,000.00 $26,071.88 $26,071.88 0.0000%
9/1/2020 4.0000% $50,000.00 $1,105,000.00 $26,071.88 $76,071.88 $102,143.76 0.0000%
3/1/2021 $1,105,000.00 $25,071.88 $25,071.88 0.0000%
9/1/2021 5.0000% $55,000.00 $1,050,000.00 $25,071.88 $80,071.88 $105,143.76 0.0000%
3/1/2022 $1,050,000.00 $23,696.88 $23,696.88 0.0000%
9/1/2022 5.0000% $55,000.00 $995,000.00 $23,696.88 $78,696.88 $102,393.76 0.0000%
3/1/2023 $995,000.00 $22,321.88 $22,321.88 0.0000%
9/1/2023 3.3750% $55,000.00 $940,000.00 $22,321.88 $77,321.88 $99,643.76 0.0000%
3/1/2024 $940,000.00 $21,393.75 $21,393.75 0.0000%
9/1/2024 4.0000% $60,000.00 $880,000.00 $21,393.75 $81,393.75 $102,787.50 0.0000%
3/1/2025 $880,000.00 $20,193.75 $20,193.75 0.0000%
9/1/2025 5.0000% $65,000.00 $815,000.00 $20,193.75 $85,193.75 $105,387.50 0.0000%
3/1/2026 $815,000.00 $18,568.75 $18,568.75 0.0000%
9/1/2026 5.0000% $65,000.00 $750,000.00 $18,568.75 $83,568.75 $102,137.50 0.0000%
3/1/2027 $750,000.00 $16,943.75 $16,943.75 0.0000%
9/1/2027 5.0000% $70,000.00 $680,000.00 $16,943.75 $86,943.75 $103,887.50 0.0000%
3/1/2028 $680,000.00 $15,193.75 $15,193.75 0.0000%
9/1/2028 5.0000% $75,000.00 $605,000.00 $15,193.75 $90,193.75 $105,387.50 0.0000%
3/1/2029 $605,000.00 $13,318.75 $13,318.75 0.0000%
9/1/2029 4.0000% $80,000.00 $525,000.00 $13,318.75 $93,318.75 $106,637.50 0.0000%
3/1/2030 $525,000.00 $11,718.75 $11,718.75 0.0000%
9/1/2030 4.0000% $80,000.00 $445,000.00 $11,718.75 $91,718.75 $103,437.50 0.0000%
3/1/2031 $445,000.00 $10,118.75 $10,118.75 0.0000%
9/1/2031 4.1250% $80,000.00 $365,000.00 $10,118.75 $90,118.75 $100,237.50 0.0000%
3/1/2032 $365,000.00 $8,468.75 $8,468.75 0.0000%
9/1/2032 4.2500% $85,000.00 $280,000.00 $8,468.75 $93,468.75 $101,937.50 0.0000%
3/1/2033 $280,000.00 $6,662.50 $6,662.50 0.0000%
9/1/2033 4.2500% $90,000.00 $190,000.00 $6,662.50 $96,662.50 $103,325.00 0.0000%
3/1/2034 $190,000.00 $4,750.00 $4,750.00 0.0000%
9/1/2034 5.0000% $95,000.00 $95,000.00 $4,750.00 $99,750.00 $104,500.00 0.0000%
3/1/2035 $95,000.00 $2,375.00 $2,375.00 0.0000%
9/1/2035 5.0000% $95,000.00 $0.00 $2,375.00 $97,375.00 $99,750.00 0.0000%
Totals: $1,435,000.00 $857,056.76 $2,292,056.76 $2,292,056.76
Bond Issue Date: 6/27/2013
Execution Time: 1/12/2017 8:31:24 AMAlbert A. Webb Associates Page 1 of 1
Debt Service Schedule - Current
Page 53
Eastern Municipal Water District CFD 2003-14 IA B (2013 PFA) (Original)
PaymentDate
InterestRate Principal
Principal Outstanding Interest
Semi Annual Debt Service
Annual Debt Service
CallPremium
3/1/2014 $3,330,000.00 $97,926.18 $97,926.18 0.0000%
9/1/2014 2.0000% $75,000.00 $3,255,000.00 $72,240.63 $147,240.63 $245,166.81 0.0000%
3/1/2015 $3,255,000.00 $71,490.63 $71,490.63 0.0000%
9/1/2015 3.0000% $100,000.00 $3,155,000.00 $71,490.63 $171,490.63 $242,981.26 0.0000%
3/1/2016 $3,155,000.00 $69,990.63 $69,990.63 0.0000%
9/1/2016 4.0000% $105,000.00 $3,050,000.00 $69,990.63 $174,990.63 $244,981.26 0.0000%
3/1/2017 $3,050,000.00 $67,890.63 $67,890.63 0.0000%
9/1/2017 4.0000% $110,000.00 $2,940,000.00 $67,890.63 $177,890.63 $245,781.26 0.0000%
3/1/2018 $2,940,000.00 $65,690.63 $65,690.63 0.0000%
9/1/2018 4.0000% $115,000.00 $2,825,000.00 $65,690.63 $180,690.63 $246,381.26 0.0000%
3/1/2019 $2,825,000.00 $63,390.63 $63,390.63 0.0000%
9/1/2019 4.0000% $120,000.00 $2,705,000.00 $63,390.63 $183,390.63 $246,781.26 0.0000%
3/1/2020 $2,705,000.00 $60,990.63 $60,990.63 0.0000%
9/1/2020 4.0000% $120,000.00 $2,585,000.00 $60,990.63 $180,990.63 $241,981.26 0.0000%
3/1/2021 $2,585,000.00 $58,590.63 $58,590.63 0.0000%
9/1/2021 5.0000% $125,000.00 $2,460,000.00 $58,590.63 $183,590.63 $242,181.26 0.0000%
3/1/2022 $2,460,000.00 $55,465.63 $55,465.63 0.0000%
9/1/2022 5.0000% $130,000.00 $2,330,000.00 $55,465.63 $185,465.63 $240,931.26 0.0000%
3/1/2023 $2,330,000.00 $52,215.63 $52,215.63 0.0000%
9/1/2023 3.3750% $140,000.00 $2,190,000.00 $52,215.63 $192,215.63 $244,431.26 0.0000%
3/1/2024 $2,190,000.00 $49,853.13 $49,853.13 0.0000%
9/1/2024 4.0000% $140,000.00 $2,050,000.00 $49,853.13 $189,853.13 $239,706.26 0.0000%
3/1/2025 $2,050,000.00 $47,053.13 $47,053.13 0.0000%
9/1/2025 5.0000% $150,000.00 $1,900,000.00 $47,053.13 $197,053.13 $244,106.26 0.0000%
3/1/2026 $1,900,000.00 $43,303.13 $43,303.13 0.0000%
9/1/2026 5.0000% $155,000.00 $1,745,000.00 $43,303.13 $198,303.13 $241,606.26 0.0000%
3/1/2027 $1,745,000.00 $39,428.13 $39,428.13 0.0000%
9/1/2027 5.0000% $165,000.00 $1,580,000.00 $39,428.13 $204,428.13 $243,856.26 0.0000%
3/1/2028 $1,580,000.00 $35,303.13 $35,303.13 0.0000%
9/1/2028 5.0000% $175,000.00 $1,405,000.00 $35,303.13 $210,303.13 $245,606.26 0.0000%
3/1/2029 $1,405,000.00 $30,928.13 $30,928.13 0.0000%
9/1/2029 4.0000% $180,000.00 $1,225,000.00 $30,928.13 $210,928.13 $241,856.26 0.0000%
3/1/2030 $1,225,000.00 $27,328.13 $27,328.13 0.0000%
9/1/2030 4.0000% $185,000.00 $1,040,000.00 $27,328.13 $212,328.13 $239,656.26 0.0000%
3/1/2031 $1,040,000.00 $23,628.13 $23,628.13 0.0000%
9/1/2031 4.1250% $195,000.00 $845,000.00 $23,628.13 $218,628.13 $242,256.26 0.0000%
3/1/2032 $845,000.00 $19,606.25 $19,606.25 0.0000%
9/1/2032 4.2500% $195,000.00 $650,000.00 $19,606.25 $214,606.25 $234,212.50 0.0000%
3/1/2033 $650,000.00 $15,462.50 $15,462.50 0.0000%
9/1/2033 4.2500% $210,000.00 $440,000.00 $15,462.50 $225,462.50 $240,925.00 0.0000%
3/1/2034 $440,000.00 $11,000.00 $11,000.00 0.0000%
9/1/2034 5.0000% $215,000.00 $225,000.00 $11,000.00 $226,000.00 $237,000.00 0.0000%
3/1/2035 $225,000.00 $5,625.00 $5,625.00 0.0000%
9/1/2035 5.0000% $225,000.00 $0.00 $5,625.00 $230,625.00 $236,250.00 0.0000%
Totals: $3,330,000.00 $1,998,635.73 $5,328,635.73 $5,328,635.73
Bond Issue Date: 6/27/2013
Execution Time: 1/12/2017 8:31:53 AMAlbert A. Webb Associates Page 1 of 1
Debt Service Schedule - Current
Page 54
Eastern Municipal Water District CFD 2003-14 IA C (2013 PFA) (Original)
PaymentDate
InterestRate Principal
Principal Outstanding Interest
Semi Annual Debt Service
Annual Debt Service
CallPremium
3/1/2014 $1,635,000.00 $47,855.35 $47,855.35 0.0000%
9/1/2014 2.0000% $45,000.00 $1,590,000.00 $35,303.13 $80,303.13 $128,158.48 0.0000%
3/1/2015 $1,590,000.00 $34,853.13 $34,853.13 0.0000%
9/1/2015 3.0000% $55,000.00 $1,535,000.00 $34,853.13 $89,853.13 $124,706.26 0.0000%
3/1/2016 $1,535,000.00 $34,028.13 $34,028.13 0.0000%
9/1/2016 4.0000% $55,000.00 $1,480,000.00 $34,028.13 $89,028.13 $123,056.26 0.0000%
3/1/2017 $1,480,000.00 $32,928.13 $32,928.13 0.0000%
9/1/2017 4.0000% $60,000.00 $1,420,000.00 $32,928.13 $92,928.13 $125,856.26 0.0000%
3/1/2018 $1,420,000.00 $31,728.13 $31,728.13 0.0000%
9/1/2018 4.0000% $55,000.00 $1,365,000.00 $31,728.13 $86,728.13 $118,456.26 0.0000%
3/1/2019 $1,365,000.00 $30,628.13 $30,628.13 0.0000%
9/1/2019 4.0000% $60,000.00 $1,305,000.00 $30,628.13 $90,628.13 $121,256.26 0.0000%
3/1/2020 $1,305,000.00 $29,428.13 $29,428.13 0.0000%
9/1/2020 4.0000% $55,000.00 $1,250,000.00 $29,428.13 $84,428.13 $113,856.26 0.0000%
3/1/2021 $1,250,000.00 $28,328.13 $28,328.13 0.0000%
9/1/2021 5.0000% $60,000.00 $1,190,000.00 $28,328.13 $88,328.13 $116,656.26 0.0000%
3/1/2022 $1,190,000.00 $26,828.13 $26,828.13 0.0000%
9/1/2022 5.0000% $60,000.00 $1,130,000.00 $26,828.13 $86,828.13 $113,656.26 0.0000%
3/1/2023 $1,130,000.00 $25,328.13 $25,328.13 0.0000%
9/1/2023 3.3750% $65,000.00 $1,065,000.00 $25,328.13 $90,328.13 $115,656.26 0.0000%
3/1/2024 $1,065,000.00 $24,231.25 $24,231.25 0.0000%
9/1/2024 4.0000% $70,000.00 $995,000.00 $24,231.25 $94,231.25 $118,462.50 0.0000%
3/1/2025 $995,000.00 $22,831.25 $22,831.25 0.0000%
9/1/2025 5.0000% $70,000.00 $925,000.00 $22,831.25 $92,831.25 $115,662.50 0.0000%
3/1/2026 $925,000.00 $21,081.25 $21,081.25 0.0000%
9/1/2026 5.0000% $75,000.00 $850,000.00 $21,081.25 $96,081.25 $117,162.50 0.0000%
3/1/2027 $850,000.00 $19,206.25 $19,206.25 0.0000%
9/1/2027 5.0000% $80,000.00 $770,000.00 $19,206.25 $99,206.25 $118,412.50 0.0000%
3/1/2028 $770,000.00 $17,206.25 $17,206.25 0.0000%
9/1/2028 5.0000% $85,000.00 $685,000.00 $17,206.25 $102,206.25 $119,412.50 0.0000%
3/1/2029 $685,000.00 $15,081.25 $15,081.25 0.0000%
9/1/2029 4.0000% $90,000.00 $595,000.00 $15,081.25 $105,081.25 $120,162.50 0.0000%
3/1/2030 $595,000.00 $13,281.25 $13,281.25 0.0000%
9/1/2030 4.0000% $90,000.00 $505,000.00 $13,281.25 $103,281.25 $116,562.50 0.0000%
3/1/2031 $505,000.00 $11,481.25 $11,481.25 0.0000%
9/1/2031 4.1250% $90,000.00 $415,000.00 $11,481.25 $101,481.25 $112,962.50 0.0000%
3/1/2032 $415,000.00 $9,625.00 $9,625.00 0.0000%
9/1/2032 4.2500% $95,000.00 $320,000.00 $9,625.00 $104,625.00 $114,250.00 0.0000%
3/1/2033 $320,000.00 $7,606.25 $7,606.25 0.0000%
9/1/2033 4.2500% $105,000.00 $215,000.00 $7,606.25 $112,606.25 $120,212.50 0.0000%
3/1/2034 $215,000.00 $5,375.00 $5,375.00 0.0000%
9/1/2034 5.0000% $105,000.00 $110,000.00 $5,375.00 $110,375.00 $115,750.00 0.0000%
3/1/2035 $110,000.00 $2,750.00 $2,750.00 0.0000%
9/1/2035 5.0000% $110,000.00 $0.00 $2,750.00 $112,750.00 $115,500.00 0.0000%
Totals: $1,635,000.00 $970,827.32 $2,605,827.32 $2,605,827.32
Bond Issue Date: 6/27/2013
Execution Time: 1/12/2017 8:32:23 AMAlbert A. Webb Associates Page 1 of 1
Debt Service Schedule - Current
Page 55
Eastern Municipal Water District 685430 - CFD 2003-15 IA A (2013 PFA) (Original)
PaymentDate
InterestRate Principal
Principal Outstanding Interest
Semi Annual Debt Service
Annual Debt Service
CallPremium
9/1/2014 2.0000% $110,000.00 $5,725,000.00 $301,805.56 $411,805.56 $411,805.56 3.0000%
3/1/2015 $5,725,000.00 $127,025.00 $127,025.00 0.0000%
9/1/2015 3.0000% $160,000.00 $5,565,000.00 $127,025.00 $287,025.00 $414,050.00 3.0000%
3/1/2016 $5,565,000.00 $124,625.00 $124,625.00 0.0000%
9/1/2016 4.0000% $155,000.00 $5,410,000.00 $124,625.00 $279,625.00 $404,250.00 3.0000%
3/1/2017 $5,410,000.00 $121,525.00 $121,525.00 0.0000%
9/1/2017 4.0000% $165,000.00 $5,245,000.00 $121,525.00 $286,525.00 $408,050.00 3.0000%
3/1/2018 $5,245,000.00 $118,225.00 $118,225.00 0.0000%
9/1/2018 4.0000% $175,000.00 $5,070,000.00 $118,225.00 $293,225.00 $411,450.00 3.0000%
3/1/2019 $5,070,000.00 $114,725.00 $114,725.00 0.0000%
9/1/2019 4.0000% $180,000.00 $4,890,000.00 $114,725.00 $294,725.00 $409,450.00 3.0000%
3/1/2020 $4,890,000.00 $111,125.00 $111,125.00 0.0000%
9/1/2020 4.0000% $185,000.00 $4,705,000.00 $111,125.00 $296,125.00 $407,250.00 3.0000%
3/1/2021 $4,705,000.00 $107,425.00 $107,425.00 0.0000%
9/1/2021 5.0000% $190,000.00 $4,515,000.00 $107,425.00 $297,425.00 $404,850.00 2.0000%
3/1/2022 $4,515,000.00 $102,675.00 $102,675.00 0.0000%
9/1/2022 5.0000% $200,000.00 $4,315,000.00 $102,675.00 $302,675.00 $405,350.00 1.0000%
3/1/2023 $4,315,000.00 $97,675.00 $97,675.00 0.0000%
9/1/2023 3.3750% $215,000.00 $4,100,000.00 $97,675.00 $312,675.00 $410,350.00 0.0000%
3/1/2024 $4,100,000.00 $94,046.88 $94,046.88 0.0000%
9/1/2024 4.0000% $220,000.00 $3,880,000.00 $94,046.88 $314,046.88 $408,093.76 0.0000%
3/1/2025 $3,880,000.00 $89,646.88 $89,646.88 0.0000%
9/1/2025 5.0000% $225,000.00 $3,655,000.00 $89,646.88 $314,646.88 $404,293.76 0.0000%
3/1/2026 $3,655,000.00 $84,021.88 $84,021.88 0.0000%
9/1/2026 5.0000% $240,000.00 $3,415,000.00 $84,021.88 $324,021.88 $408,043.76 0.0000%
3/1/2027 $3,415,000.00 $78,021.88 $78,021.88 0.0000%
9/1/2027 5.0000% $250,000.00 $3,165,000.00 $78,021.88 $328,021.88 $406,043.76 0.0000%
3/1/2028 $3,165,000.00 $71,771.88 $71,771.88 0.0000%
9/1/2028 5.0000% $265,000.00 $2,900,000.00 $71,771.88 $336,771.88 $408,543.76 0.0000%
3/1/2029 $2,900,000.00 $65,146.88 $65,146.88 0.0000%
9/1/2029 4.0000% $275,000.00 $2,625,000.00 $65,146.88 $340,146.88 $405,293.76 0.0000%
3/1/2030 $2,625,000.00 $59,646.88 $59,646.88 0.0000%
9/1/2030 4.0000% $285,000.00 $2,340,000.00 $59,646.88 $344,646.88 $404,293.76 0.0000%
3/1/2031 $2,340,000.00 $53,946.88 $53,946.88 0.0000%
9/1/2031 4.1250% $295,000.00 $2,045,000.00 $53,946.88 $348,946.88 $402,893.76 0.0000%
3/1/2032 $2,045,000.00 $47,862.50 $47,862.50 0.0000%
9/1/2032 4.2500% $305,000.00 $1,740,000.00 $47,862.50 $352,862.50 $400,725.00 0.0000%
3/1/2033 $1,740,000.00 $41,381.25 $41,381.25 0.0000%
9/1/2033 4.2500% $315,000.00 $1,425,000.00 $41,381.25 $356,381.25 $397,762.50 0.0000%
3/1/2034 $1,425,000.00 $34,687.50 $34,687.50 0.0000%
9/1/2034 5.0000% $330,000.00 $1,095,000.00 $34,687.50 $364,687.50 $399,375.00 0.0000%
3/1/2035 $1,095,000.00 $26,437.50 $26,437.50 0.0000%
9/1/2035 5.0000% $345,000.00 $750,000.00 $26,437.50 $371,437.50 $397,875.00 0.0000%
3/1/2036 $750,000.00 $17,812.50 $17,812.50 0.0000%
9/1/2036 4.7500% $365,000.00 $385,000.00 $17,812.50 $382,812.50 $400,625.00 0.0000%
3/1/2037 $385,000.00 $9,143.75 $9,143.75 0.0000%
9/1/2037 4.7500% $385,000.00 $0.00 $9,143.75 $394,143.75 $403,287.50 0.0000%
Execution Time: 1/12/2017 8:33:06 AMAlbert A. Webb Associates Page 1 of 2
Debt Service Schedule - Current
Page 56
Totals: $5,835,000.00 $3,899,005.64 $9,734,005.64 $9,734,005.64
Bond Issue Date: 6/27/2013
Original Bond Principal: $5,835,000.00
Execution Time: 1/12/2017 8:33:06 AMAlbert A. Webb Associates Page 2 of 2
Debt Service Schedule - Current
Page 57
Eastern Municipal Water District 685388 - CFD 2003-16 (2013 PFA) (Original)
PaymentDate
InterestRate Principal
Principal Outstanding Interest
Semi Annual Debt Service
Annual Debt Service
CallPremium
9/1/2014 2.0000% $80,000.00 $2,975,000.00 $154,156.39 $234,156.39 $234,156.39 3.0000%
3/1/2015 $2,975,000.00 $64,643.75 $64,643.75 0.0000%
9/1/2015 3.0000% $105,000.00 $2,870,000.00 $64,643.75 $169,643.75 $234,287.50 3.0000%
3/1/2016 $2,870,000.00 $63,068.75 $63,068.75 0.0000%
9/1/2016 4.0000% $105,000.00 $2,765,000.00 $63,068.75 $168,068.75 $231,137.50 3.0000%
3/1/2017 $2,765,000.00 $60,968.75 $60,968.75 0.0000%
9/1/2017 4.0000% $105,000.00 $2,660,000.00 $60,968.75 $165,968.75 $226,937.50 3.0000%
3/1/2018 $2,660,000.00 $58,868.75 $58,868.75 0.0000%
9/1/2018 4.0000% $110,000.00 $2,550,000.00 $58,868.75 $168,868.75 $227,737.50 3.0000%
3/1/2019 $2,550,000.00 $56,668.75 $56,668.75 0.0000%
9/1/2019 4.0000% $115,000.00 $2,435,000.00 $56,668.75 $171,668.75 $228,337.50 3.0000%
3/1/2020 $2,435,000.00 $54,368.75 $54,368.75 0.0000%
9/1/2020 4.0000% $125,000.00 $2,310,000.00 $54,368.75 $179,368.75 $233,737.50 3.0000%
3/1/2021 $2,310,000.00 $51,868.75 $51,868.75 0.0000%
9/1/2021 5.0000% $130,000.00 $2,180,000.00 $51,868.75 $181,868.75 $233,737.50 2.0000%
3/1/2022 $2,180,000.00 $48,618.75 $48,618.75 0.0000%
9/1/2022 5.0000% $130,000.00 $2,050,000.00 $48,618.75 $178,618.75 $227,237.50 1.0000%
3/1/2023 $2,050,000.00 $45,368.75 $45,368.75 0.0000%
9/1/2023 3.3750% $135,000.00 $1,915,000.00 $45,368.75 $180,368.75 $225,737.50 0.0000%
3/1/2024 $1,915,000.00 $43,090.63 $43,090.63 0.0000%
9/1/2024 4.0000% $140,000.00 $1,775,000.00 $43,090.63 $183,090.63 $226,181.26 0.0000%
3/1/2025 $1,775,000.00 $40,290.63 $40,290.63 0.0000%
9/1/2025 5.0000% $145,000.00 $1,630,000.00 $40,290.63 $185,290.63 $225,581.26 0.0000%
3/1/2026 $1,630,000.00 $36,665.63 $36,665.63 0.0000%
9/1/2026 5.0000% $150,000.00 $1,480,000.00 $36,665.63 $186,665.63 $223,331.26 0.0000%
3/1/2027 $1,480,000.00 $32,915.63 $32,915.63 0.0000%
9/1/2027 5.0000% $160,000.00 $1,320,000.00 $32,915.63 $192,915.63 $225,831.26 0.0000%
3/1/2028 $1,320,000.00 $28,915.63 $28,915.63 0.0000%
9/1/2028 5.0000% $170,000.00 $1,150,000.00 $28,915.63 $198,915.63 $227,831.26 0.0000%
3/1/2029 $1,150,000.00 $24,665.63 $24,665.63 0.0000%
9/1/2029 4.0000% $175,000.00 $975,000.00 $24,665.63 $199,665.63 $224,331.26 0.0000%
3/1/2030 $975,000.00 $21,165.63 $21,165.63 0.0000%
9/1/2030 4.0000% $180,000.00 $795,000.00 $21,165.63 $201,165.63 $222,331.26 0.0000%
3/1/2031 $795,000.00 $17,565.63 $17,565.63 0.0000%
9/1/2031 4.1250% $185,000.00 $610,000.00 $17,565.63 $202,565.63 $220,131.26 0.0000%
3/1/2032 $610,000.00 $13,750.00 $13,750.00 0.0000%
9/1/2032 4.2500% $195,000.00 $415,000.00 $13,750.00 $208,750.00 $222,500.00 0.0000%
3/1/2033 $415,000.00 $9,606.25 $9,606.25 0.0000%
9/1/2033 4.2500% $205,000.00 $210,000.00 $9,606.25 $214,606.25 $224,212.50 0.0000%
3/1/2034 $210,000.00 $5,250.00 $5,250.00 0.0000%
9/1/2034 5.0000% $210,000.00 $0.00 $5,250.00 $215,250.00 $220,500.00 0.0000%
Totals: $3,055,000.00 $1,710,806.47 $4,765,806.47 $4,765,806.47
Bond Issue Date: 6/27/2013
Original Bond Principal: $3,055,000.00
Execution Time: 1/12/2017 8:33:54 AMAlbert A. Webb Associates Page 1 of 1
Debt Service Schedule - Current
Page 58
Eastern Municipal Water District CFD 2003-19 IA A (2013 PFA) (Original)
PaymentDate
InterestRate Principal
Principal Outstanding Interest
Semi Annual Debt Service
Annual Debt Service
CallPremium
3/1/2014 $2,035,000.00 $59,729.17 $59,729.17 0.0000%
9/1/2014 2.0000% $50,000.00 $1,985,000.00 $44,062.50 $94,062.50 $153,791.67 0.0000%
3/1/2015 $1,985,000.00 $43,562.50 $43,562.50 0.0000%
9/1/2015 3.0000% $65,000.00 $1,920,000.00 $43,562.50 $108,562.50 $152,125.00 0.0000%
3/1/2016 $1,920,000.00 $42,587.50 $42,587.50 0.0000%
9/1/2016 4.0000% $65,000.00 $1,855,000.00 $42,587.50 $107,587.50 $150,175.00 0.0000%
3/1/2017 $1,855,000.00 $41,287.50 $41,287.50 0.0000%
9/1/2017 4.0000% $70,000.00 $1,785,000.00 $41,287.50 $111,287.50 $152,575.00 0.0000%
3/1/2018 $1,785,000.00 $39,887.50 $39,887.50 0.0000%
9/1/2018 4.0000% $70,000.00 $1,715,000.00 $39,887.50 $109,887.50 $149,775.00 0.0000%
3/1/2019 $1,715,000.00 $38,487.50 $38,487.50 0.0000%
9/1/2019 4.0000% $70,000.00 $1,645,000.00 $38,487.50 $108,487.50 $146,975.00 0.0000%
3/1/2020 $1,645,000.00 $37,087.50 $37,087.50 0.0000%
9/1/2020 4.0000% $75,000.00 $1,570,000.00 $37,087.50 $112,087.50 $149,175.00 0.0000%
3/1/2021 $1,570,000.00 $35,587.50 $35,587.50 0.0000%
9/1/2021 5.0000% $75,000.00 $1,495,000.00 $35,587.50 $110,587.50 $146,175.00 0.0000%
3/1/2022 $1,495,000.00 $33,712.50 $33,712.50 0.0000%
9/1/2022 5.0000% $80,000.00 $1,415,000.00 $33,712.50 $113,712.50 $147,425.00 0.0000%
3/1/2023 $1,415,000.00 $31,712.50 $31,712.50 0.0000%
9/1/2023 3.3750% $85,000.00 $1,330,000.00 $31,712.50 $116,712.50 $148,425.00 0.0000%
3/1/2024 $1,330,000.00 $30,278.13 $30,278.13 0.0000%
9/1/2024 4.0000% $85,000.00 $1,245,000.00 $30,278.13 $115,278.13 $145,556.26 0.0000%
3/1/2025 $1,245,000.00 $28,578.13 $28,578.13 0.0000%
9/1/2025 5.0000% $90,000.00 $1,155,000.00 $28,578.13 $118,578.13 $147,156.26 0.0000%
3/1/2026 $1,155,000.00 $26,328.13 $26,328.13 0.0000%
9/1/2026 5.0000% $95,000.00 $1,060,000.00 $26,328.13 $121,328.13 $147,656.26 0.0000%
3/1/2027 $1,060,000.00 $23,953.13 $23,953.13 0.0000%
9/1/2027 5.0000% $100,000.00 $960,000.00 $23,953.13 $123,953.13 $147,906.26 0.0000%
3/1/2028 $960,000.00 $21,453.13 $21,453.13 0.0000%
9/1/2028 5.0000% $105,000.00 $855,000.00 $21,453.13 $126,453.13 $147,906.26 0.0000%
3/1/2029 $855,000.00 $18,828.13 $18,828.13 0.0000%
9/1/2029 4.0000% $110,000.00 $745,000.00 $18,828.13 $128,828.13 $147,656.26 0.0000%
3/1/2030 $745,000.00 $16,628.13 $16,628.13 0.0000%
9/1/2030 4.0000% $115,000.00 $630,000.00 $16,628.13 $131,628.13 $148,256.26 0.0000%
3/1/2031 $630,000.00 $14,328.13 $14,328.13 0.0000%
9/1/2031 4.1250% $115,000.00 $515,000.00 $14,328.13 $129,328.13 $143,656.26 0.0000%
3/1/2032 $515,000.00 $11,956.25 $11,956.25 0.0000%
9/1/2032 4.2500% $120,000.00 $395,000.00 $11,956.25 $131,956.25 $143,912.50 0.0000%
3/1/2033 $395,000.00 $9,406.25 $9,406.25 0.0000%
9/1/2033 4.2500% $125,000.00 $270,000.00 $9,406.25 $134,406.25 $143,812.50 0.0000%
3/1/2034 $270,000.00 $6,750.00 $6,750.00 0.0000%
9/1/2034 5.0000% $135,000.00 $135,000.00 $6,750.00 $141,750.00 $148,500.00 0.0000%
3/1/2035 $135,000.00 $3,375.00 $3,375.00 0.0000%
9/1/2035 5.0000% $135,000.00 $0.00 $3,375.00 $138,375.00 $141,750.00 0.0000%
Totals: $2,035,000.00 $1,215,341.75 $3,250,341.75 $3,250,341.75
Bond Issue Date: 6/27/2013
Execution Time: 1/12/2017 8:35:07 AMAlbert A. Webb Associates Page 1 of 1
Debt Service Schedule - Current
Page 59
Eastern Municipal Water District CFD 2003-19 IA B (2013 PFA) (Original)
PaymentDate
InterestRate Principal
Principal Outstanding Interest
Semi Annual Debt Service
Annual Debt Service
CallPremium
3/1/2014 $3,705,000.00 $108,969.72 $108,969.72 0.0000%
9/1/2014 2.0000% $85,000.00 $3,620,000.00 $80,387.50 $165,387.50 $274,357.22 0.0000%
3/1/2015 $3,620,000.00 $79,537.50 $79,537.50 0.0000%
9/1/2015 3.0000% $110,000.00 $3,510,000.00 $79,537.50 $189,537.50 $269,075.00 0.0000%
3/1/2016 $3,510,000.00 $77,887.50 $77,887.50 0.0000%
9/1/2016 4.0000% $115,000.00 $3,395,000.00 $77,887.50 $192,887.50 $270,775.00 0.0000%
3/1/2017 $3,395,000.00 $75,587.50 $75,587.50 0.0000%
9/1/2017 4.0000% $120,000.00 $3,275,000.00 $75,587.50 $195,587.50 $271,175.00 0.0000%
3/1/2018 $3,275,000.00 $73,187.50 $73,187.50 0.0000%
9/1/2018 4.0000% $125,000.00 $3,150,000.00 $73,187.50 $198,187.50 $271,375.00 0.0000%
3/1/2019 $3,150,000.00 $70,687.50 $70,687.50 0.0000%
9/1/2019 4.0000% $130,000.00 $3,020,000.00 $70,687.50 $200,687.50 $271,375.00 0.0000%
3/1/2020 $3,020,000.00 $68,087.50 $68,087.50 0.0000%
9/1/2020 4.0000% $140,000.00 $2,880,000.00 $68,087.50 $208,087.50 $276,175.00 0.0000%
3/1/2021 $2,880,000.00 $65,287.50 $65,287.50 0.0000%
9/1/2021 5.0000% $140,000.00 $2,740,000.00 $65,287.50 $205,287.50 $270,575.00 0.0000%
3/1/2022 $2,740,000.00 $61,787.50 $61,787.50 0.0000%
9/1/2022 5.0000% $150,000.00 $2,590,000.00 $61,787.50 $211,787.50 $273,575.00 0.0000%
3/1/2023 $2,590,000.00 $58,037.50 $58,037.50 0.0000%
9/1/2023 3.3750% $155,000.00 $2,435,000.00 $58,037.50 $213,037.50 $271,075.00 0.0000%
3/1/2024 $2,435,000.00 $55,421.88 $55,421.88 0.0000%
9/1/2024 4.0000% $160,000.00 $2,275,000.00 $55,421.88 $215,421.88 $270,843.76 0.0000%
3/1/2025 $2,275,000.00 $52,221.88 $52,221.88 0.0000%
9/1/2025 5.0000% $165,000.00 $2,110,000.00 $52,221.88 $217,221.88 $269,443.76 0.0000%
3/1/2026 $2,110,000.00 $48,096.88 $48,096.88 0.0000%
9/1/2026 5.0000% $170,000.00 $1,940,000.00 $48,096.88 $218,096.88 $266,193.76 0.0000%
3/1/2027 $1,940,000.00 $43,846.88 $43,846.88 0.0000%
9/1/2027 5.0000% $180,000.00 $1,760,000.00 $43,846.88 $223,846.88 $267,693.76 0.0000%
3/1/2028 $1,760,000.00 $39,346.88 $39,346.88 0.0000%
9/1/2028 5.0000% $195,000.00 $1,565,000.00 $39,346.88 $234,346.88 $273,693.76 0.0000%
3/1/2029 $1,565,000.00 $34,471.88 $34,471.88 0.0000%
9/1/2029 4.0000% $200,000.00 $1,365,000.00 $34,471.88 $234,471.88 $268,943.76 0.0000%
3/1/2030 $1,365,000.00 $30,471.88 $30,471.88 0.0000%
9/1/2030 4.0000% $205,000.00 $1,160,000.00 $30,471.88 $235,471.88 $265,943.76 0.0000%
3/1/2031 $1,160,000.00 $26,371.88 $26,371.88 0.0000%
9/1/2031 4.1250% $215,000.00 $945,000.00 $26,371.88 $241,371.88 $267,743.76 0.0000%
3/1/2032 $945,000.00 $21,937.50 $21,937.50 0.0000%
9/1/2032 4.2500% $220,000.00 $725,000.00 $21,937.50 $241,937.50 $263,875.00 0.0000%
3/1/2033 $725,000.00 $17,262.50 $17,262.50 0.0000%
9/1/2033 4.2500% $230,000.00 $495,000.00 $17,262.50 $247,262.50 $264,525.00 0.0000%
3/1/2034 $495,000.00 $12,375.00 $12,375.00 0.0000%
9/1/2034 5.0000% $240,000.00 $255,000.00 $12,375.00 $252,375.00 $264,750.00 0.0000%
3/1/2035 $255,000.00 $6,375.00 $6,375.00 0.0000%
9/1/2035 5.0000% $255,000.00 $0.00 $6,375.00 $261,375.00 $267,750.00 0.0000%
Totals: $3,705,000.00 $2,225,932.30 $5,930,932.30 $5,930,932.30
Bond Issue Date: 6/27/2013
Execution Time: 1/12/2017 8:35:32 AMAlbert A. Webb Associates Page 1 of 1
Debt Service Schedule - Current
Page 60
Eastern Municipal Water District CFD 2003-20 IA A (2013 PFA) (Original)
PaymentDate
InterestRate Principal
Principal Outstanding Interest
Semi Annual Debt Service
Annual Debt Service
CallPremium
3/1/2014 $1,405,000.00 $41,128.40 $41,128.40 0.0000%
9/1/2014 2.0000% $35,000.00 $1,370,000.00 $30,340.63 $65,340.63 $106,469.03 0.0000%
3/1/2015 $1,370,000.00 $29,990.63 $29,990.63 0.0000%
9/1/2015 3.0000% $50,000.00 $1,320,000.00 $29,990.63 $79,990.63 $109,981.26 0.0000%
3/1/2016 $1,320,000.00 $29,240.63 $29,240.63 0.0000%
9/1/2016 4.0000% $50,000.00 $1,270,000.00 $29,240.63 $79,240.63 $108,481.26 0.0000%
3/1/2017 $1,270,000.00 $28,240.63 $28,240.63 0.0000%
9/1/2017 4.0000% $45,000.00 $1,225,000.00 $28,240.63 $73,240.63 $101,481.26 0.0000%
3/1/2018 $1,225,000.00 $27,340.63 $27,340.63 0.0000%
9/1/2018 4.0000% $50,000.00 $1,175,000.00 $27,340.63 $77,340.63 $104,681.26 0.0000%
3/1/2019 $1,175,000.00 $26,340.63 $26,340.63 0.0000%
9/1/2019 4.0000% $50,000.00 $1,125,000.00 $26,340.63 $76,340.63 $102,681.26 0.0000%
3/1/2020 $1,125,000.00 $25,340.63 $25,340.63 0.0000%
9/1/2020 4.0000% $55,000.00 $1,070,000.00 $25,340.63 $80,340.63 $105,681.26 0.0000%
3/1/2021 $1,070,000.00 $24,240.63 $24,240.63 0.0000%
9/1/2021 5.0000% $50,000.00 $1,020,000.00 $24,240.63 $74,240.63 $98,481.26 0.0000%
3/1/2022 $1,020,000.00 $22,990.63 $22,990.63 0.0000%
9/1/2022 5.0000% $55,000.00 $965,000.00 $22,990.63 $77,990.63 $100,981.26 0.0000%
3/1/2023 $965,000.00 $21,615.63 $21,615.63 0.0000%
9/1/2023 3.3750% $55,000.00 $910,000.00 $21,615.63 $76,615.63 $98,231.26 0.0000%
3/1/2024 $910,000.00 $20,687.50 $20,687.50 0.0000%
9/1/2024 4.0000% $60,000.00 $850,000.00 $20,687.50 $80,687.50 $101,375.00 0.0000%
3/1/2025 $850,000.00 $19,487.50 $19,487.50 0.0000%
9/1/2025 5.0000% $60,000.00 $790,000.00 $19,487.50 $79,487.50 $98,975.00 0.0000%
3/1/2026 $790,000.00 $17,987.50 $17,987.50 0.0000%
9/1/2026 5.0000% $65,000.00 $725,000.00 $17,987.50 $82,987.50 $100,975.00 0.0000%
3/1/2027 $725,000.00 $16,362.50 $16,362.50 0.0000%
9/1/2027 5.0000% $65,000.00 $660,000.00 $16,362.50 $81,362.50 $97,725.00 0.0000%
3/1/2028 $660,000.00 $14,737.50 $14,737.50 0.0000%
9/1/2028 5.0000% $70,000.00 $590,000.00 $14,737.50 $84,737.50 $99,475.00 0.0000%
3/1/2029 $590,000.00 $12,987.50 $12,987.50 0.0000%
9/1/2029 4.0000% $75,000.00 $515,000.00 $12,987.50 $87,987.50 $100,975.00 0.0000%
3/1/2030 $515,000.00 $11,487.50 $11,487.50 0.0000%
9/1/2030 4.0000% $80,000.00 $435,000.00 $11,487.50 $91,487.50 $102,975.00 0.0000%
3/1/2031 $435,000.00 $9,887.50 $9,887.50 0.0000%
9/1/2031 4.1250% $80,000.00 $355,000.00 $9,887.50 $89,887.50 $99,775.00 0.0000%
3/1/2032 $355,000.00 $8,237.50 $8,237.50 0.0000%
9/1/2032 4.2500% $85,000.00 $270,000.00 $8,237.50 $93,237.50 $101,475.00 0.0000%
3/1/2033 $270,000.00 $6,431.25 $6,431.25 0.0000%
9/1/2033 4.2500% $85,000.00 $185,000.00 $6,431.25 $91,431.25 $97,862.50 0.0000%
3/1/2034 $185,000.00 $4,625.00 $4,625.00 0.0000%
9/1/2034 5.0000% $90,000.00 $95,000.00 $4,625.00 $94,625.00 $99,250.00 0.0000%
3/1/2035 $95,000.00 $2,375.00 $2,375.00 0.0000%
9/1/2035 5.0000% $95,000.00 $0.00 $2,375.00 $97,375.00 $99,750.00 0.0000%
Totals: $1,405,000.00 $832,737.87 $2,237,737.87 $2,237,737.87
Bond Issue Date: 6/27/2013
Execution Time: 1/12/2017 8:36:40 AMAlbert A. Webb Associates Page 1 of 1
Debt Service Schedule - Current
Page 61
Eastern Municipal Water District CFD 2003-25 IA D (2013 PFA) (Original)
PaymentDate
InterestRate Principal
Principal Outstanding Interest
Semi Annual Debt Service
Annual Debt Service
CallPremium
3/1/2014 $3,070,000.00 $90,796.81 $90,796.81 0.0000%
9/1/2014 2.0000% $65,000.00 $3,005,000.00 $66,981.25 $131,981.25 $222,778.06 0.0000%
3/1/2015 $3,005,000.00 $66,331.25 $66,331.25 0.0000%
9/1/2015 3.0000% $90,000.00 $2,915,000.00 $66,331.25 $156,331.25 $222,662.50 0.0000%
3/1/2016 $2,915,000.00 $64,981.25 $64,981.25 0.0000%
9/1/2016 4.0000% $90,000.00 $2,825,000.00 $64,981.25 $154,981.25 $219,962.50 0.0000%
3/1/2017 $2,825,000.00 $63,181.25 $63,181.25 0.0000%
9/1/2017 4.0000% $95,000.00 $2,730,000.00 $63,181.25 $158,181.25 $221,362.50 0.0000%
3/1/2018 $2,730,000.00 $61,281.25 $61,281.25 0.0000%
9/1/2018 4.0000% $100,000.00 $2,630,000.00 $61,281.25 $161,281.25 $222,562.50 0.0000%
3/1/2019 $2,630,000.00 $59,281.25 $59,281.25 0.0000%
9/1/2019 4.0000% $105,000.00 $2,525,000.00 $59,281.25 $164,281.25 $223,562.50 0.0000%
3/1/2020 $2,525,000.00 $57,181.25 $57,181.25 0.0000%
9/1/2020 4.0000% $110,000.00 $2,415,000.00 $57,181.25 $167,181.25 $224,362.50 0.0000%
3/1/2021 $2,415,000.00 $54,981.25 $54,981.25 0.0000%
9/1/2021 5.0000% $105,000.00 $2,310,000.00 $54,981.25 $159,981.25 $214,962.50 0.0000%
3/1/2022 $2,310,000.00 $52,356.25 $52,356.25 0.0000%
9/1/2022 5.0000% $110,000.00 $2,200,000.00 $52,356.25 $162,356.25 $214,712.50 0.0000%
3/1/2023 $2,200,000.00 $49,606.25 $49,606.25 0.0000%
9/1/2023 3.3750% $115,000.00 $2,085,000.00 $49,606.25 $164,606.25 $214,212.50 0.0000%
3/1/2024 $2,085,000.00 $47,665.63 $47,665.63 0.0000%
9/1/2024 4.0000% $120,000.00 $1,965,000.00 $47,665.63 $167,665.63 $215,331.26 0.0000%
3/1/2025 $1,965,000.00 $45,265.63 $45,265.63 0.0000%
9/1/2025 5.0000% $130,000.00 $1,835,000.00 $45,265.63 $175,265.63 $220,531.26 0.0000%
3/1/2026 $1,835,000.00 $42,015.63 $42,015.63 0.0000%
9/1/2026 5.0000% $135,000.00 $1,700,000.00 $42,015.63 $177,015.63 $219,031.26 0.0000%
3/1/2027 $1,700,000.00 $38,640.63 $38,640.63 0.0000%
9/1/2027 5.0000% $140,000.00 $1,560,000.00 $38,640.63 $178,640.63 $217,281.26 0.0000%
3/1/2028 $1,560,000.00 $35,140.63 $35,140.63 0.0000%
9/1/2028 5.0000% $150,000.00 $1,410,000.00 $35,140.63 $185,140.63 $220,281.26 0.0000%
3/1/2029 $1,410,000.00 $31,390.63 $31,390.63 0.0000%
9/1/2029 4.0000% $150,000.00 $1,260,000.00 $31,390.63 $181,390.63 $212,781.26 0.0000%
3/1/2030 $1,260,000.00 $28,390.63 $28,390.63 0.0000%
9/1/2030 4.0000% $160,000.00 $1,100,000.00 $28,390.63 $188,390.63 $216,781.26 0.0000%
3/1/2031 $1,100,000.00 $25,190.63 $25,190.63 0.0000%
9/1/2031 4.1250% $165,000.00 $935,000.00 $25,190.63 $190,190.63 $215,381.26 0.0000%
3/1/2032 $935,000.00 $21,787.50 $21,787.50 0.0000%
9/1/2032 4.2500% $175,000.00 $760,000.00 $21,787.50 $196,787.50 $218,575.00 0.0000%
3/1/2033 $760,000.00 $18,068.75 $18,068.75 0.0000%
9/1/2033 4.2500% $180,000.00 $580,000.00 $18,068.75 $198,068.75 $216,137.50 0.0000%
3/1/2034 $580,000.00 $14,243.75 $14,243.75 0.0000%
9/1/2034 5.0000% $185,000.00 $395,000.00 $14,243.75 $199,243.75 $213,487.50 0.0000%
3/1/2035 $395,000.00 $9,618.75 $9,618.75 0.0000%
9/1/2035 5.0000% $190,000.00 $205,000.00 $9,618.75 $199,618.75 $209,237.50 0.0000%
3/1/2036 $205,000.00 $4,868.75 $4,868.75 0.0000%
9/1/2036 4.7500% $205,000.00 $0.00 $4,868.75 $209,868.75 $214,737.50 0.0000%
Totals: $3,070,000.00 $1,940,715.64 $5,010,715.64 $5,010,715.64
Execution Time: 1/12/2017 8:37:17 AMAlbert A. Webb Associates Page 1 of 1
Debt Service Schedule - Current
Page 62
Eastern Municipal Water District CFD 2004-26 IA 1 (2013 PFA) (Original)
PaymentDate
InterestRate Principal
Principal Outstanding Interest
Semi Annual Debt Service
Annual Debt Service
CallPremium
3/1/2014 $4,675,000.00 $137,453.33 $137,453.33 0.0000%
9/1/2014 2.0000% $105,000.00 $4,570,000.00 $101,400.00 $206,400.00 $343,853.33 0.0000%
3/1/2015 $4,570,000.00 $100,350.00 $100,350.00 0.0000%
9/1/2015 3.0000% $145,000.00 $4,425,000.00 $100,350.00 $245,350.00 $345,700.00 0.0000%
3/1/2016 $4,425,000.00 $98,175.00 $98,175.00 0.0000%
9/1/2016 4.0000% $145,000.00 $4,280,000.00 $98,175.00 $243,175.00 $341,350.00 0.0000%
3/1/2017 $4,280,000.00 $95,275.00 $95,275.00 0.0000%
9/1/2017 4.0000% $150,000.00 $4,130,000.00 $95,275.00 $245,275.00 $340,550.00 0.0000%
3/1/2018 $4,130,000.00 $92,275.00 $92,275.00 0.0000%
9/1/2018 4.0000% $160,000.00 $3,970,000.00 $92,275.00 $252,275.00 $344,550.00 0.0000%
3/1/2019 $3,970,000.00 $89,075.00 $89,075.00 0.0000%
9/1/2019 4.0000% $165,000.00 $3,805,000.00 $89,075.00 $254,075.00 $343,150.00 0.0000%
3/1/2020 $3,805,000.00 $85,775.00 $85,775.00 0.0000%
9/1/2020 4.0000% $175,000.00 $3,630,000.00 $85,775.00 $260,775.00 $346,550.00 0.0000%
3/1/2021 $3,630,000.00 $82,275.00 $82,275.00 0.0000%
9/1/2021 5.0000% $175,000.00 $3,455,000.00 $82,275.00 $257,275.00 $339,550.00 0.0000%
3/1/2022 $3,455,000.00 $77,900.00 $77,900.00 0.0000%
9/1/2022 5.0000% $190,000.00 $3,265,000.00 $77,900.00 $267,900.00 $345,800.00 0.0000%
3/1/2023 $3,265,000.00 $73,150.00 $73,150.00 0.0000%
9/1/2023 3.3750% $200,000.00 $3,065,000.00 $73,150.00 $273,150.00 $346,300.00 0.0000%
3/1/2024 $3,065,000.00 $69,775.00 $69,775.00 0.0000%
9/1/2024 4.0000% $200,000.00 $2,865,000.00 $69,775.00 $269,775.00 $339,550.00 0.0000%
3/1/2025 $2,865,000.00 $65,775.00 $65,775.00 0.0000%
9/1/2025 5.0000% $210,000.00 $2,655,000.00 $65,775.00 $275,775.00 $341,550.00 0.0000%
3/1/2026 $2,655,000.00 $60,525.00 $60,525.00 0.0000%
9/1/2026 5.0000% $220,000.00 $2,435,000.00 $60,525.00 $280,525.00 $341,050.00 0.0000%
3/1/2027 $2,435,000.00 $55,025.00 $55,025.00 0.0000%
9/1/2027 5.0000% $230,000.00 $2,205,000.00 $55,025.00 $285,025.00 $340,050.00 0.0000%
3/1/2028 $2,205,000.00 $49,275.00 $49,275.00 0.0000%
9/1/2028 5.0000% $240,000.00 $1,965,000.00 $49,275.00 $289,275.00 $338,550.00 0.0000%
3/1/2029 $1,965,000.00 $43,275.00 $43,275.00 0.0000%
9/1/2029 4.0000% $250,000.00 $1,715,000.00 $43,275.00 $293,275.00 $336,550.00 0.0000%
3/1/2030 $1,715,000.00 $38,275.00 $38,275.00 0.0000%
9/1/2030 4.0000% $260,000.00 $1,455,000.00 $38,275.00 $298,275.00 $336,550.00 0.0000%
3/1/2031 $1,455,000.00 $33,075.00 $33,075.00 0.0000%
9/1/2031 4.1250% $270,000.00 $1,185,000.00 $33,075.00 $303,075.00 $336,150.00 0.0000%
3/1/2032 $1,185,000.00 $27,506.25 $27,506.25 0.0000%
9/1/2032 4.2500% $275,000.00 $910,000.00 $27,506.25 $302,506.25 $330,012.50 0.0000%
3/1/2033 $910,000.00 $21,662.50 $21,662.50 0.0000%
9/1/2033 4.2500% $290,000.00 $620,000.00 $21,662.50 $311,662.50 $333,325.00 0.0000%
3/1/2034 $620,000.00 $15,500.00 $15,500.00 0.0000%
9/1/2034 5.0000% $300,000.00 $320,000.00 $15,500.00 $315,500.00 $331,000.00 0.0000%
3/1/2035 $320,000.00 $8,000.00 $8,000.00 0.0000%
9/1/2035 5.0000% $320,000.00 $0.00 $8,000.00 $328,000.00 $336,000.00 0.0000%
Totals: $4,675,000.00 $2,802,690.83 $7,477,690.83 $7,477,690.83
Bond Issue Date: 6/27/2013
Execution Time: 1/12/2017 8:38:11 AMAlbert A. Webb Associates Page 1 of 1
Debt Service Schedule - Current
Page 63
Eastern Municipal Water District CFD 2004-26 IA 2 (2013 PFA) (Original)
PaymentDate
InterestRate Principal
Principal Outstanding Interest
Semi Annual Debt Service
Annual Debt Service
CallPremium
3/1/2014 $2,780,000.00 $81,617.15 $81,617.15 0.0000%
9/1/2014 2.0000% $65,000.00 $2,715,000.00 $60,209.38 $125,209.38 $206,826.53 0.0000%
3/1/2015 $2,715,000.00 $59,559.38 $59,559.38 0.0000%
9/1/2015 3.0000% $90,000.00 $2,625,000.00 $59,559.38 $149,559.38 $209,118.76 0.0000%
3/1/2016 $2,625,000.00 $58,209.38 $58,209.38 0.0000%
9/1/2016 4.0000% $90,000.00 $2,535,000.00 $58,209.38 $148,209.38 $206,418.76 0.0000%
3/1/2017 $2,535,000.00 $56,409.38 $56,409.38 0.0000%
9/1/2017 4.0000% $95,000.00 $2,440,000.00 $56,409.38 $151,409.38 $207,818.76 0.0000%
3/1/2018 $2,440,000.00 $54,509.38 $54,509.38 0.0000%
9/1/2018 4.0000% $100,000.00 $2,340,000.00 $54,509.38 $154,509.38 $209,018.76 0.0000%
3/1/2019 $2,340,000.00 $52,509.38 $52,509.38 0.0000%
9/1/2019 4.0000% $100,000.00 $2,240,000.00 $52,509.38 $152,509.38 $205,018.76 0.0000%
3/1/2020 $2,240,000.00 $50,509.38 $50,509.38 0.0000%
9/1/2020 4.0000% $105,000.00 $2,135,000.00 $50,509.38 $155,509.38 $206,018.76 0.0000%
3/1/2021 $2,135,000.00 $48,409.38 $48,409.38 0.0000%
9/1/2021 5.0000% $105,000.00 $2,030,000.00 $48,409.38 $153,409.38 $201,818.76 0.0000%
3/1/2022 $2,030,000.00 $45,784.38 $45,784.38 0.0000%
9/1/2022 5.0000% $110,000.00 $1,920,000.00 $45,784.38 $155,784.38 $201,568.76 0.0000%
3/1/2023 $1,920,000.00 $43,034.38 $43,034.38 0.0000%
9/1/2023 3.3750% $115,000.00 $1,805,000.00 $43,034.38 $158,034.38 $201,068.76 0.0000%
3/1/2024 $1,805,000.00 $41,093.75 $41,093.75 0.0000%
9/1/2024 4.0000% $115,000.00 $1,690,000.00 $41,093.75 $156,093.75 $197,187.50 0.0000%
3/1/2025 $1,690,000.00 $38,793.75 $38,793.75 0.0000%
9/1/2025 5.0000% $120,000.00 $1,570,000.00 $38,793.75 $158,793.75 $197,587.50 0.0000%
3/1/2026 $1,570,000.00 $35,793.75 $35,793.75 0.0000%
9/1/2026 5.0000% $130,000.00 $1,440,000.00 $35,793.75 $165,793.75 $201,587.50 0.0000%
3/1/2027 $1,440,000.00 $32,543.75 $32,543.75 0.0000%
9/1/2027 5.0000% $135,000.00 $1,305,000.00 $32,543.75 $167,543.75 $200,087.50 0.0000%
3/1/2028 $1,305,000.00 $29,168.75 $29,168.75 0.0000%
9/1/2028 5.0000% $140,000.00 $1,165,000.00 $29,168.75 $169,168.75 $198,337.50 0.0000%
3/1/2029 $1,165,000.00 $25,668.75 $25,668.75 0.0000%
9/1/2029 4.0000% $150,000.00 $1,015,000.00 $25,668.75 $175,668.75 $201,337.50 0.0000%
3/1/2030 $1,015,000.00 $22,668.75 $22,668.75 0.0000%
9/1/2030 4.0000% $150,000.00 $865,000.00 $22,668.75 $172,668.75 $195,337.50 0.0000%
3/1/2031 $865,000.00 $19,668.75 $19,668.75 0.0000%
9/1/2031 4.1250% $160,000.00 $705,000.00 $19,668.75 $179,668.75 $199,337.50 0.0000%
3/1/2032 $705,000.00 $16,368.75 $16,368.75 0.0000%
9/1/2032 4.2500% $165,000.00 $540,000.00 $16,368.75 $181,368.75 $197,737.50 0.0000%
3/1/2033 $540,000.00 $12,862.50 $12,862.50 0.0000%
9/1/2033 4.2500% $170,000.00 $370,000.00 $12,862.50 $182,862.50 $195,725.00 0.0000%
3/1/2034 $370,000.00 $9,250.00 $9,250.00 0.0000%
9/1/2034 5.0000% $180,000.00 $190,000.00 $9,250.00 $189,250.00 $198,500.00 0.0000%
3/1/2035 $190,000.00 $4,750.00 $4,750.00 0.0000%
9/1/2035 5.0000% $190,000.00 $0.00 $4,750.00 $194,750.00 $199,500.00 0.0000%
Totals: $2,780,000.00 $1,656,957.87 $4,436,957.87 $4,436,957.87
Bond Issue Date: 6/27/2013
Execution Time: 1/12/2017 8:38:59 AMAlbert A. Webb Associates Page 1 of 1
Debt Service Schedule - Current
Page 64
Eastern Municipal Water District CFD 2004-28 (2013 PFA) (Original)
PaymentDate
InterestRate Principal
Principal Outstanding Interest
Semi Annual Debt Service
Annual Debt Service
CallPremium
3/1/2014 $3,735,000.00 $109,588.19 $109,588.19 0.0000%
9/1/2014 2.0000% $90,000.00 $3,645,000.00 $80,843.75 $170,843.75 $280,431.94 0.0000%
3/1/2015 $3,645,000.00 $79,943.75 $79,943.75 0.0000%
9/1/2015 3.0000% $120,000.00 $3,525,000.00 $79,943.75 $199,943.75 $279,887.50 0.0000%
3/1/2016 $3,525,000.00 $78,143.75 $78,143.75 0.0000%
9/1/2016 4.0000% $120,000.00 $3,405,000.00 $78,143.75 $198,143.75 $276,287.50 0.0000%
3/1/2017 $3,405,000.00 $75,743.75 $75,743.75 0.0000%
9/1/2017 4.0000% $125,000.00 $3,280,000.00 $75,743.75 $200,743.75 $276,487.50 0.0000%
3/1/2018 $3,280,000.00 $73,243.75 $73,243.75 0.0000%
9/1/2018 4.0000% $130,000.00 $3,150,000.00 $73,243.75 $203,243.75 $276,487.50 0.0000%
3/1/2019 $3,150,000.00 $70,643.75 $70,643.75 0.0000%
9/1/2019 4.0000% $135,000.00 $3,015,000.00 $70,643.75 $205,643.75 $276,287.50 0.0000%
3/1/2020 $3,015,000.00 $67,943.75 $67,943.75 0.0000%
9/1/2020 4.0000% $140,000.00 $2,875,000.00 $67,943.75 $207,943.75 $275,887.50 0.0000%
3/1/2021 $2,875,000.00 $65,143.75 $65,143.75 0.0000%
9/1/2021 5.0000% $140,000.00 $2,735,000.00 $65,143.75 $205,143.75 $270,287.50 0.0000%
3/1/2022 $2,735,000.00 $61,643.75 $61,643.75 0.0000%
9/1/2022 5.0000% $145,000.00 $2,590,000.00 $61,643.75 $206,643.75 $268,287.50 0.0000%
3/1/2023 $2,590,000.00 $58,018.75 $58,018.75 0.0000%
9/1/2023 3.3750% $155,000.00 $2,435,000.00 $58,018.75 $213,018.75 $271,037.50 0.0000%
3/1/2024 $2,435,000.00 $55,403.13 $55,403.13 0.0000%
9/1/2024 4.0000% $160,000.00 $2,275,000.00 $55,403.13 $215,403.13 $270,806.26 0.0000%
3/1/2025 $2,275,000.00 $52,203.13 $52,203.13 0.0000%
9/1/2025 5.0000% $165,000.00 $2,110,000.00 $52,203.13 $217,203.13 $269,406.26 0.0000%
3/1/2026 $2,110,000.00 $48,078.13 $48,078.13 0.0000%
9/1/2026 5.0000% $175,000.00 $1,935,000.00 $48,078.13 $223,078.13 $271,156.26 0.0000%
3/1/2027 $1,935,000.00 $43,703.13 $43,703.13 0.0000%
9/1/2027 5.0000% $185,000.00 $1,750,000.00 $43,703.13 $228,703.13 $272,406.26 0.0000%
3/1/2028 $1,750,000.00 $39,078.13 $39,078.13 0.0000%
9/1/2028 5.0000% $190,000.00 $1,560,000.00 $39,078.13 $229,078.13 $268,156.26 0.0000%
3/1/2029 $1,560,000.00 $34,328.13 $34,328.13 0.0000%
9/1/2029 4.0000% $200,000.00 $1,360,000.00 $34,328.13 $234,328.13 $268,656.26 0.0000%
3/1/2030 $1,360,000.00 $30,328.13 $30,328.13 0.0000%
9/1/2030 4.0000% $205,000.00 $1,155,000.00 $30,328.13 $235,328.13 $265,656.26 0.0000%
3/1/2031 $1,155,000.00 $26,228.13 $26,228.13 0.0000%
9/1/2031 4.1250% $215,000.00 $940,000.00 $26,228.13 $241,228.13 $267,456.26 0.0000%
3/1/2032 $940,000.00 $21,793.75 $21,793.75 0.0000%
9/1/2032 4.2500% $225,000.00 $715,000.00 $21,793.75 $246,793.75 $268,587.50 0.0000%
3/1/2033 $715,000.00 $17,012.50 $17,012.50 0.0000%
9/1/2033 4.2500% $230,000.00 $485,000.00 $17,012.50 $247,012.50 $264,025.00 0.0000%
3/1/2034 $485,000.00 $12,125.00 $12,125.00 0.0000%
9/1/2034 5.0000% $235,000.00 $250,000.00 $12,125.00 $247,125.00 $259,250.00 0.0000%
3/1/2035 $250,000.00 $6,250.00 $6,250.00 0.0000%
9/1/2035 5.0000% $250,000.00 $0.00 $6,250.00 $256,250.00 $262,500.00 0.0000%
Totals: $3,735,000.00 $2,224,432.02 $5,959,432.02 $5,959,432.02
Bond Issue Date: 6/27/2013
Execution Time: 1/12/2017 8:39:47 AMAlbert A. Webb Associates Page 1 of 1
Debt Service Schedule - Current
Page 65
Eastern Municipal Water District 685427 - CFD 2004-30 (2013 PFA) (Original)
PaymentDate
InterestRate Principal
Principal Outstanding Interest
Semi Annual Debt Service
Annual Debt Service
CallPremium
9/1/2014 2.0000% $50,000.00 $2,170,000.00 $113,287.50 $163,287.50 $163,287.50 3.0000%
3/1/2015 $2,170,000.00 $47,593.75 $47,593.75 0.0000%
9/1/2015 3.0000% $70,000.00 $2,100,000.00 $47,593.75 $117,593.75 $165,187.50 3.0000%
3/1/2016 $2,100,000.00 $46,543.75 $46,543.75 0.0000%
9/1/2016 4.0000% $75,000.00 $2,025,000.00 $46,543.75 $121,543.75 $168,087.50 3.0000%
3/1/2017 $2,025,000.00 $45,043.75 $45,043.75 0.0000%
9/1/2017 4.0000% $75,000.00 $1,950,000.00 $45,043.75 $120,043.75 $165,087.50 3.0000%
3/1/2018 $1,950,000.00 $43,543.75 $43,543.75 0.0000%
9/1/2018 4.0000% $80,000.00 $1,870,000.00 $43,543.75 $123,543.75 $167,087.50 3.0000%
3/1/2019 $1,870,000.00 $41,943.75 $41,943.75 0.0000%
9/1/2019 4.0000% $80,000.00 $1,790,000.00 $41,943.75 $121,943.75 $163,887.50 3.0000%
3/1/2020 $1,790,000.00 $40,343.75 $40,343.75 0.0000%
9/1/2020 4.0000% $80,000.00 $1,710,000.00 $40,343.75 $120,343.75 $160,687.50 3.0000%
3/1/2021 $1,710,000.00 $38,743.75 $38,743.75 0.0000%
9/1/2021 5.0000% $85,000.00 $1,625,000.00 $38,743.75 $123,743.75 $162,487.50 2.0000%
3/1/2022 $1,625,000.00 $36,618.75 $36,618.75 0.0000%
9/1/2022 5.0000% $90,000.00 $1,535,000.00 $36,618.75 $126,618.75 $163,237.50 1.0000%
3/1/2023 $1,535,000.00 $34,368.75 $34,368.75 0.0000%
9/1/2023 3.3750% $95,000.00 $1,440,000.00 $34,368.75 $129,368.75 $163,737.50 0.0000%
3/1/2024 $1,440,000.00 $32,765.63 $32,765.63 0.0000%
9/1/2024 4.0000% $95,000.00 $1,345,000.00 $32,765.63 $127,765.63 $160,531.26 0.0000%
3/1/2025 $1,345,000.00 $30,865.63 $30,865.63 0.0000%
9/1/2025 5.0000% $100,000.00 $1,245,000.00 $30,865.63 $130,865.63 $161,731.26 0.0000%
3/1/2026 $1,245,000.00 $28,365.63 $28,365.63 0.0000%
9/1/2026 5.0000% $105,000.00 $1,140,000.00 $28,365.63 $133,365.63 $161,731.26 0.0000%
3/1/2027 $1,140,000.00 $25,740.63 $25,740.63 0.0000%
9/1/2027 5.0000% $110,000.00 $1,030,000.00 $25,740.63 $135,740.63 $161,481.26 0.0000%
3/1/2028 $1,030,000.00 $22,990.63 $22,990.63 0.0000%
9/1/2028 5.0000% $110,000.00 $920,000.00 $22,990.63 $132,990.63 $155,981.26 0.0000%
3/1/2029 $920,000.00 $20,240.63 $20,240.63 0.0000%
9/1/2029 4.0000% $120,000.00 $800,000.00 $20,240.63 $140,240.63 $160,481.26 0.0000%
3/1/2030 $800,000.00 $17,840.63 $17,840.63 0.0000%
9/1/2030 4.0000% $120,000.00 $680,000.00 $17,840.63 $137,840.63 $155,681.26 0.0000%
3/1/2031 $680,000.00 $15,440.63 $15,440.63 0.0000%
9/1/2031 4.1250% $125,000.00 $555,000.00 $15,440.63 $140,440.63 $155,881.26 0.0000%
3/1/2032 $555,000.00 $12,862.50 $12,862.50 0.0000%
9/1/2032 4.2500% $130,000.00 $425,000.00 $12,862.50 $142,862.50 $155,725.00 0.0000%
3/1/2033 $425,000.00 $10,100.00 $10,100.00 0.0000%
9/1/2033 4.2500% $140,000.00 $285,000.00 $10,100.00 $150,100.00 $160,200.00 0.0000%
3/1/2034 $285,000.00 $7,125.00 $7,125.00 0.0000%
9/1/2034 5.0000% $140,000.00 $145,000.00 $7,125.00 $147,125.00 $154,250.00 0.0000%
3/1/2035 $145,000.00 $3,625.00 $3,625.00 0.0000%
9/1/2035 5.0000% $145,000.00 $0.00 $3,625.00 $148,625.00 $152,250.00 0.0000%
Totals: $2,220,000.00 $1,318,700.08 $3,538,700.08 $3,538,700.08
Bond Issue Date: 6/27/2013
Original Bond Principal: $2,220,000.00
Execution Time: 1/12/2017 8:40:26 AMAlbert A. Webb Associates Page 1 of 1
Debt Service Schedule - Current
Page 66
Eastern Municipal Water District CFD 2004-35 IA C (2013 PFA) (Original)
PaymentDate
InterestRate Principal
Principal Outstanding Interest
Semi Annual Debt Service
Annual Debt Service
CallPremium
3/1/2014 $850,000.00 $24,908.33 $24,908.33 0.0000%
9/1/2014 2.0000% $25,000.00 $825,000.00 $18,375.00 $43,375.00 $68,283.33 0.0000%
3/1/2015 $825,000.00 $18,125.00 $18,125.00 0.0000%
9/1/2015 3.0000% $30,000.00 $795,000.00 $18,125.00 $48,125.00 $66,250.00 0.0000%
3/1/2016 $795,000.00 $17,675.00 $17,675.00 0.0000%
9/1/2016 4.0000% $30,000.00 $765,000.00 $17,675.00 $47,675.00 $65,350.00 0.0000%
3/1/2017 $765,000.00 $17,075.00 $17,075.00 0.0000%
9/1/2017 4.0000% $30,000.00 $735,000.00 $17,075.00 $47,075.00 $64,150.00 0.0000%
3/1/2018 $735,000.00 $16,475.00 $16,475.00 0.0000%
9/1/2018 4.0000% $30,000.00 $705,000.00 $16,475.00 $46,475.00 $62,950.00 0.0000%
3/1/2019 $705,000.00 $15,875.00 $15,875.00 0.0000%
9/1/2019 4.0000% $35,000.00 $670,000.00 $15,875.00 $50,875.00 $66,750.00 0.0000%
3/1/2020 $670,000.00 $15,175.00 $15,175.00 0.0000%
9/1/2020 4.0000% $35,000.00 $635,000.00 $15,175.00 $50,175.00 $65,350.00 0.0000%
3/1/2021 $635,000.00 $14,475.00 $14,475.00 0.0000%
9/1/2021 5.0000% $30,000.00 $605,000.00 $14,475.00 $44,475.00 $58,950.00 0.0000%
3/1/2022 $605,000.00 $13,725.00 $13,725.00 0.0000%
9/1/2022 5.0000% $30,000.00 $575,000.00 $13,725.00 $43,725.00 $57,450.00 0.0000%
3/1/2023 $575,000.00 $12,975.00 $12,975.00 0.0000%
9/1/2023 3.3750% $30,000.00 $545,000.00 $12,975.00 $42,975.00 $55,950.00 0.0000%
3/1/2024 $545,000.00 $12,468.75 $12,468.75 0.0000%
9/1/2024 4.0000% $30,000.00 $515,000.00 $12,468.75 $42,468.75 $54,937.50 0.0000%
3/1/2025 $515,000.00 $11,868.75 $11,868.75 0.0000%
9/1/2025 5.0000% $30,000.00 $485,000.00 $11,868.75 $41,868.75 $53,737.50 0.0000%
3/1/2026 $485,000.00 $11,118.75 $11,118.75 0.0000%
9/1/2026 5.0000% $30,000.00 $455,000.00 $11,118.75 $41,118.75 $52,237.50 0.0000%
3/1/2027 $455,000.00 $10,368.75 $10,368.75 0.0000%
9/1/2027 5.0000% $35,000.00 $420,000.00 $10,368.75 $45,368.75 $55,737.50 0.0000%
3/1/2028 $420,000.00 $9,493.75 $9,493.75 0.0000%
9/1/2028 5.0000% $35,000.00 $385,000.00 $9,493.75 $44,493.75 $53,987.50 0.0000%
3/1/2029 $385,000.00 $8,618.75 $8,618.75 0.0000%
9/1/2029 4.0000% $35,000.00 $350,000.00 $8,618.75 $43,618.75 $52,237.50 0.0000%
3/1/2030 $350,000.00 $7,918.75 $7,918.75 0.0000%
9/1/2030 4.0000% $40,000.00 $310,000.00 $7,918.75 $47,918.75 $55,837.50 0.0000%
3/1/2031 $310,000.00 $7,118.75 $7,118.75 0.0000%
9/1/2031 4.1250% $40,000.00 $270,000.00 $7,118.75 $47,118.75 $54,237.50 0.0000%
3/1/2032 $270,000.00 $6,293.75 $6,293.75 0.0000%
9/1/2032 4.2500% $45,000.00 $225,000.00 $6,293.75 $51,293.75 $57,587.50 0.0000%
3/1/2033 $225,000.00 $5,337.50 $5,337.50 0.0000%
9/1/2033 4.2500% $45,000.00 $180,000.00 $5,337.50 $50,337.50 $55,675.00 0.0000%
3/1/2034 $180,000.00 $4,381.25 $4,381.25 0.0000%
9/1/2034 5.0000% $40,000.00 $140,000.00 $4,381.25 $44,381.25 $48,762.50 0.0000%
3/1/2035 $140,000.00 $3,381.25 $3,381.25 0.0000%
9/1/2035 5.0000% $45,000.00 $95,000.00 $3,381.25 $48,381.25 $51,762.50 0.0000%
3/1/2036 $95,000.00 $2,256.25 $2,256.25 0.0000%
9/1/2036 4.7500% $45,000.00 $50,000.00 $2,256.25 $47,256.25 $49,512.50 0.0000%
3/1/2037 $50,000.00 $1,187.50 $1,187.50 0.0000%
Execution Time: 1/12/2017 8:41:07 AMAlbert A. Webb Associates Page 1 of 2
Debt Service Schedule - Current
Page 67
Eastern Municipal Water District CFD 2004-35 IA C (2013 PFA) (Original)
PaymentDate
InterestRate Principal
Principal Outstanding Interest
Semi Annual Debt Service
Annual Debt Service
CallPremium
9/1/2037 4.7500% $50,000.00 $0.00 $1,187.50 $51,187.50 $52,375.00 0.0000%
Totals: $850,000.00 $530,058.33 $1,380,058.33 $1,380,058.33
Bond Issue Date: 6/27/2013
Original Bond Principal: $850,000.00
Execution Time: 1/12/2017 8:41:07 AMAlbert A. Webb Associates Page 2 of 2
Debt Service Schedule - Current
Page 68
Eastern Municipal Water District CFD 2004-36 (2013 PFA) (Original)
PaymentDate
InterestRate Principal
Principal Outstanding Interest
Semi Annual Debt Service
Annual Debt Service
CallPremium
3/1/2014 $4,845,000.00 $144,248.06 $144,248.06 0.0000%
9/1/2014 2.0000% $90,000.00 $4,755,000.00 $106,412.50 $196,412.50 $340,660.56 0.0000%
3/1/2015 $4,755,000.00 $105,512.50 $105,512.50 0.0000%
9/1/2015 3.0000% $130,000.00 $4,625,000.00 $105,512.50 $235,512.50 $341,025.00 0.0000%
3/1/2016 $4,625,000.00 $103,562.50 $103,562.50 0.0000%
9/1/2016 4.0000% $135,000.00 $4,490,000.00 $103,562.50 $238,562.50 $342,125.00 0.0000%
3/1/2017 $4,490,000.00 $100,862.50 $100,862.50 0.0000%
9/1/2017 4.0000% $140,000.00 $4,350,000.00 $100,862.50 $240,862.50 $341,725.00 0.0000%
3/1/2018 $4,350,000.00 $98,062.50 $98,062.50 0.0000%
9/1/2018 4.0000% $145,000.00 $4,205,000.00 $98,062.50 $243,062.50 $341,125.00 0.0000%
3/1/2019 $4,205,000.00 $95,162.50 $95,162.50 0.0000%
9/1/2019 4.0000% $150,000.00 $4,055,000.00 $95,162.50 $245,162.50 $340,325.00 0.0000%
3/1/2020 $4,055,000.00 $92,162.50 $92,162.50 0.0000%
9/1/2020 4.0000% $155,000.00 $3,900,000.00 $92,162.50 $247,162.50 $339,325.00 0.0000%
3/1/2021 $3,900,000.00 $89,062.50 $89,062.50 0.0000%
9/1/2021 5.0000% $165,000.00 $3,735,000.00 $89,062.50 $254,062.50 $343,125.00 0.0000%
3/1/2022 $3,735,000.00 $84,937.50 $84,937.50 0.0000%
9/1/2022 5.0000% $170,000.00 $3,565,000.00 $84,937.50 $254,937.50 $339,875.00 0.0000%
3/1/2023 $3,565,000.00 $80,687.50 $80,687.50 0.0000%
9/1/2023 3.3750% $175,000.00 $3,390,000.00 $80,687.50 $255,687.50 $336,375.00 0.0000%
3/1/2024 $3,390,000.00 $77,734.38 $77,734.38 0.0000%
9/1/2024 4.0000% $180,000.00 $3,210,000.00 $77,734.38 $257,734.38 $335,468.76 0.0000%
3/1/2025 $3,210,000.00 $74,134.38 $74,134.38 0.0000%
9/1/2025 5.0000% $185,000.00 $3,025,000.00 $74,134.38 $259,134.38 $333,268.76 0.0000%
3/1/2026 $3,025,000.00 $69,509.38 $69,509.38 0.0000%
9/1/2026 5.0000% $195,000.00 $2,830,000.00 $69,509.38 $264,509.38 $334,018.76 0.0000%
3/1/2027 $2,830,000.00 $64,634.38 $64,634.38 0.0000%
9/1/2027 5.0000% $205,000.00 $2,625,000.00 $64,634.38 $269,634.38 $334,268.76 0.0000%
3/1/2028 $2,625,000.00 $59,509.38 $59,509.38 0.0000%
9/1/2028 5.0000% $220,000.00 $2,405,000.00 $59,509.38 $279,509.38 $339,018.76 0.0000%
3/1/2029 $2,405,000.00 $54,009.38 $54,009.38 0.0000%
9/1/2029 4.0000% $225,000.00 $2,180,000.00 $54,009.38 $279,009.38 $333,018.76 0.0000%
3/1/2030 $2,180,000.00 $49,509.38 $49,509.38 0.0000%
9/1/2030 4.0000% $240,000.00 $1,940,000.00 $49,509.38 $289,509.38 $339,018.76 0.0000%
3/1/2031 $1,940,000.00 $44,709.38 $44,709.38 0.0000%
9/1/2031 4.1250% $245,000.00 $1,695,000.00 $44,709.38 $289,709.38 $334,418.76 0.0000%
3/1/2032 $1,695,000.00 $39,656.25 $39,656.25 0.0000%
9/1/2032 4.2500% $255,000.00 $1,440,000.00 $39,656.25 $294,656.25 $334,312.50 0.0000%
3/1/2033 $1,440,000.00 $34,237.50 $34,237.50 0.0000%
9/1/2033 4.2500% $265,000.00 $1,175,000.00 $34,237.50 $299,237.50 $333,475.00 0.0000%
3/1/2034 $1,175,000.00 $28,606.25 $28,606.25 0.0000%
9/1/2034 5.0000% $275,000.00 $900,000.00 $28,606.25 $303,606.25 $332,212.50 0.0000%
3/1/2035 $900,000.00 $21,731.25 $21,731.25 0.0000%
9/1/2035 5.0000% $285,000.00 $615,000.00 $21,731.25 $306,731.25 $328,462.50 0.0000%
3/1/2036 $615,000.00 $14,606.25 $14,606.25 0.0000%
9/1/2036 4.7500% $300,000.00 $315,000.00 $14,606.25 $314,606.25 $329,212.50 0.0000%
3/1/2037 $315,000.00 $7,481.25 $7,481.25 0.0000%
Execution Time: 1/12/2017 8:41:40 AMAlbert A. Webb Associates Page 1 of 2
Debt Service Schedule - Current
Page 69
Eastern Municipal Water District CFD 2004-36 (2013 PFA) (Original)
PaymentDate
InterestRate Principal
Principal Outstanding Interest
Semi Annual Debt Service
Annual Debt Service
CallPremium
9/1/2037 4.7500% $315,000.00 $0.00 $7,481.25 $322,481.25 $329,962.50 0.0000%
Totals: $4,845,000.00 $3,230,823.14 $8,075,823.14 $8,075,823.14
Bond Issue Date: 6/27/2013
Original Bond Principal: $4,845,000.00
Execution Time: 1/12/2017 8:41:40 AMAlbert A. Webb Associates Page 2 of 2
Debt Service Schedule - Current
Page 70
Eastern Municipal Water District CFD 2005-38 IA A (2013 PFA) (Original)
PaymentDate
InterestRate Principal
Principal Outstanding Interest
Semi Annual Debt Service
Annual Debt Service
CallPremium
3/1/2014 $2,650,000.00 $78,499.38 $78,499.38 0.0000%
9/1/2014 2.0000% $50,000.00 $2,600,000.00 $57,909.38 $107,909.38 $186,408.76 0.0000%
3/1/2015 $2,600,000.00 $57,409.38 $57,409.38 0.0000%
9/1/2015 3.0000% $75,000.00 $2,525,000.00 $57,409.38 $132,409.38 $189,818.76 0.0000%
3/1/2016 $2,525,000.00 $56,284.38 $56,284.38 0.0000%
9/1/2016 4.0000% $80,000.00 $2,445,000.00 $56,284.38 $136,284.38 $192,568.76 0.0000%
3/1/2017 $2,445,000.00 $54,684.38 $54,684.38 0.0000%
9/1/2017 4.0000% $85,000.00 $2,360,000.00 $54,684.38 $139,684.38 $194,368.76 0.0000%
3/1/2018 $2,360,000.00 $52,984.38 $52,984.38 0.0000%
9/1/2018 4.0000% $90,000.00 $2,270,000.00 $52,984.38 $142,984.38 $195,968.76 0.0000%
3/1/2019 $2,270,000.00 $51,184.38 $51,184.38 0.0000%
9/1/2019 4.0000% $90,000.00 $2,180,000.00 $51,184.38 $141,184.38 $192,368.76 0.0000%
3/1/2020 $2,180,000.00 $49,384.38 $49,384.38 0.0000%
9/1/2020 4.0000% $85,000.00 $2,095,000.00 $49,384.38 $134,384.38 $183,768.76 0.0000%
3/1/2021 $2,095,000.00 $47,684.38 $47,684.38 0.0000%
9/1/2021 5.0000% $90,000.00 $2,005,000.00 $47,684.38 $137,684.38 $185,368.76 0.0000%
3/1/2022 $2,005,000.00 $45,434.38 $45,434.38 0.0000%
9/1/2022 5.0000% $95,000.00 $1,910,000.00 $45,434.38 $140,434.38 $185,868.76 0.0000%
3/1/2023 $1,910,000.00 $43,059.38 $43,059.38 0.0000%
9/1/2023 3.3750% $100,000.00 $1,810,000.00 $43,059.38 $143,059.38 $186,118.76 0.0000%
3/1/2024 $1,810,000.00 $41,371.88 $41,371.88 0.0000%
9/1/2024 4.0000% $110,000.00 $1,700,000.00 $41,371.88 $151,371.88 $192,743.76 0.0000%
3/1/2025 $1,700,000.00 $39,171.88 $39,171.88 0.0000%
9/1/2025 5.0000% $110,000.00 $1,590,000.00 $39,171.88 $149,171.88 $188,343.76 0.0000%
3/1/2026 $1,590,000.00 $36,421.88 $36,421.88 0.0000%
9/1/2026 5.0000% $115,000.00 $1,475,000.00 $36,421.88 $151,421.88 $187,843.76 0.0000%
3/1/2027 $1,475,000.00 $33,546.88 $33,546.88 0.0000%
9/1/2027 5.0000% $125,000.00 $1,350,000.00 $33,546.88 $158,546.88 $192,093.76 0.0000%
3/1/2028 $1,350,000.00 $30,421.88 $30,421.88 0.0000%
9/1/2028 5.0000% $130,000.00 $1,220,000.00 $30,421.88 $160,421.88 $190,843.76 0.0000%
3/1/2029 $1,220,000.00 $27,171.88 $27,171.88 0.0000%
9/1/2029 4.0000% $135,000.00 $1,085,000.00 $27,171.88 $162,171.88 $189,343.76 0.0000%
3/1/2030 $1,085,000.00 $24,471.88 $24,471.88 0.0000%
9/1/2030 4.0000% $135,000.00 $950,000.00 $24,471.88 $159,471.88 $183,943.76 0.0000%
3/1/2031 $950,000.00 $21,771.88 $21,771.88 0.0000%
9/1/2031 4.1250% $145,000.00 $805,000.00 $21,771.88 $166,771.88 $188,543.76 0.0000%
3/1/2032 $805,000.00 $18,781.25 $18,781.25 0.0000%
9/1/2032 4.2500% $150,000.00 $655,000.00 $18,781.25 $168,781.25 $187,562.50 0.0000%
3/1/2033 $655,000.00 $15,593.75 $15,593.75 0.0000%
9/1/2033 4.2500% $150,000.00 $505,000.00 $15,593.75 $165,593.75 $181,187.50 0.0000%
3/1/2034 $505,000.00 $12,406.25 $12,406.25 0.0000%
9/1/2034 5.0000% $160,000.00 $345,000.00 $12,406.25 $172,406.25 $184,812.50 0.0000%
3/1/2035 $345,000.00 $8,406.25 $8,406.25 0.0000%
9/1/2035 5.0000% $170,000.00 $175,000.00 $8,406.25 $178,406.25 $186,812.50 0.0000%
3/1/2036 $175,000.00 $4,156.25 $4,156.25 0.0000%
9/1/2036 4.7500% $175,000.00 $0.00 $4,156.25 $179,156.25 $183,312.50 0.0000%
Totals: $2,650,000.00 $1,680,015.18 $4,330,015.18 $4,330,015.18
Execution Time: 1/12/2017 8:42:27 AMAlbert A. Webb Associates Page 1 of 1
Debt Service Schedule - Current
Page 71
Corporate Headquarters3750 McCray StreetRiverside, CA 92506951.686.1070
Murrieta Office41870 Kalmia Street #160Murrieta, CA 92562951.686.1070