Brad Udall Senior Scientist/Scholar Colorado State University [email protected]Western Water and Climate – Threats to Western Water Availability Migration of Agriculture as One Path to Sustainability Workshop Boulder, Colorado October 21-23, 2015 Heron Reservoir, NM, April 2014
Western Water and Climate – Threats to Western Water Availability Migration of Agriculture as One Path to Sustainability Workshop Boulder, Colorado October 21-23, 2015
Heron Reservoir, NM, April 2014
2004 View of Western Water Conflicts by Reclamation Note: 1)north to south gradient 2)does not include climate change.
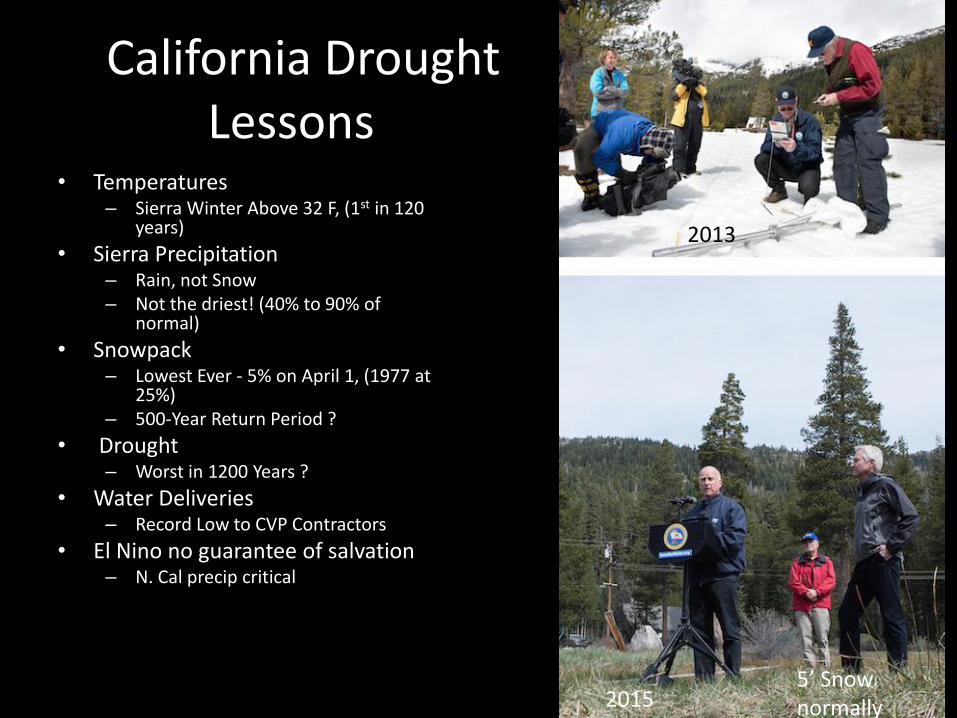
California Drought Lessons
• Temperatures – Sierra Winter Above 32 F, (1st in 120
years)
• Sierra Precipitation – Rain, not Snow – Not the driest! (40% to 90% of
normal)
• Snowpack – Lowest Ever - 5% on April 1, (1977 at
25%) – 500-Year Return Period ?
• Drought – Worst in 1200 Years ?
• Water Deliveries – Record Low to CVP Contractors
• El Nino no guarantee of salvation – N. Cal precip critical
Last month, much of the United States was wet. How wet? When climate scientists at NOAA’s National Centers for Environmental Information averaged the observations of rain, snow, and other precipitation from across the country, they found out it was the country’s wettest May since records began 121 years ago. In fact, it was the wettest month ever recorded!
• 2F Warming since 1900
• Snowpack Reductions and Changes in Runoff Timing Already Present
• Most Severe Drought since records kept
• Powell and Mead at 50% of capacity now, full 2000
• Tree Mortality Rates High
• Increase in Wildfire Frequency
• Drought may be natural, but exacerbated by higher temperatures
• Snowpack Reductions and Runoff Timing attributed to climate change
• Continued drying likely as temperatures increase and storm tracks shift
• Megadroughts independent of climate change a possibility with severe consequences if combined with warming
Science, June 25, 2010
Science, 2010
IPCC: All Kinds of Observations are Consistent with Climate Change Expectations. 7 out of 10 are water cycle related here…
90% of energy from warming here
Up by 8” since 1900, may reach 1m by 2100
-53% decline in June in NH
Up by 1.4F Since 1950, May exceed 7F by 2100
Up by 5%, Consistent with 7%/C Max Rate
Up by ~0.5F since 1950
Climate Change is Water Change
• Heat Drives the Water Cycle – 1000 km3 evaporates daily from the oceans
• The Water Cycle mixes heat from areas of too much to too little
• As the Atmosphere Warms it Holds More Moisture: ~5F warming is 20% increase
• Heating Up the Earth (and uneven heating) results in Water Cycle changes
– More Evaporation, More Precipitation, More Moisture
– Changes in weather patterns
– Wet Wetter, Dry Drier Standard Rule
– More Intense Floods and Droughts
• All Kinds of Water Changes Already Noted
– More rain/less snow, Earlier Runoff, Higher Water Temps, More Intense Rain
• Many of the most critical impacts of climate change will arise through water cycle changes driven by higher temps, not just higher temps rising temperatures
Latest IPCC/CMIP5 Climate Model Projections (Ensemble average of 39 global models)
IPCC, 2013
Projected Annual Precipitation Change by the End of Century Given Continued High Emissions (RCP8.5)
Middle
50%
Wettest 25%
Driest 25%
Bottom-line: North gets wetter, South drier. But note that precip is not runoff.
IPCC, 2013
Projected Annual Temperature Change by the End of Century Given Continued High Emissions (RCP8.5)
Middle
50%
Wettest 25%
Driest 25%
Latest IPCC/CMIP5 Climate Model Projections (Ensemble average of 39 global models)
Bottom-line: Western US will get hotter for sure, perhaps much hotter
Current 15-Year Colorado River Drought only has 40% of the Precipitation Decline associated with similar 1950s drought. You have to invoke temperatures to explain current drought.
Source: Udall & Overpeck 2015, in review
IPCC 5th Results RCP 8.5 at 2081 to 2100
Source: IPCC 2013
Repeat after me: Precipitation is not runoff!
Projected Drying in U.S. Southwest
• “Regional to global-scale projections of soil moisture and drought remain relatively uncertain compared to other aspects of the water cycle. Nonetheless, drying in the Mediterranean, southwestern U.S. and south African regions are consistent with projected changes in Hadley circulation, so drying in these regions as global temperatures increase is likely for several degrees of warming under the RCP8.5 scenario.”
Source: Water Cycle Box in IPCC 2013 WG1 Technical Summary, also Summary for Policy Makers
Soil Moisture CMIP5 RCP 8.5 @2100
Projected Changes in Snow, Runoff, and Soil Moisture
Figure source: Cayan et al. 2013
2041-2070 with 1971-2000 baseline, A2 Emissions
• Declines in April 1 SWE indicate the start of runoff has already occurred
• May or May Not indicate declines in total maximum SWE which will occur earlier in the year
• Not shown: increases in runoff during the Winter
Source: 2014 National Assessment
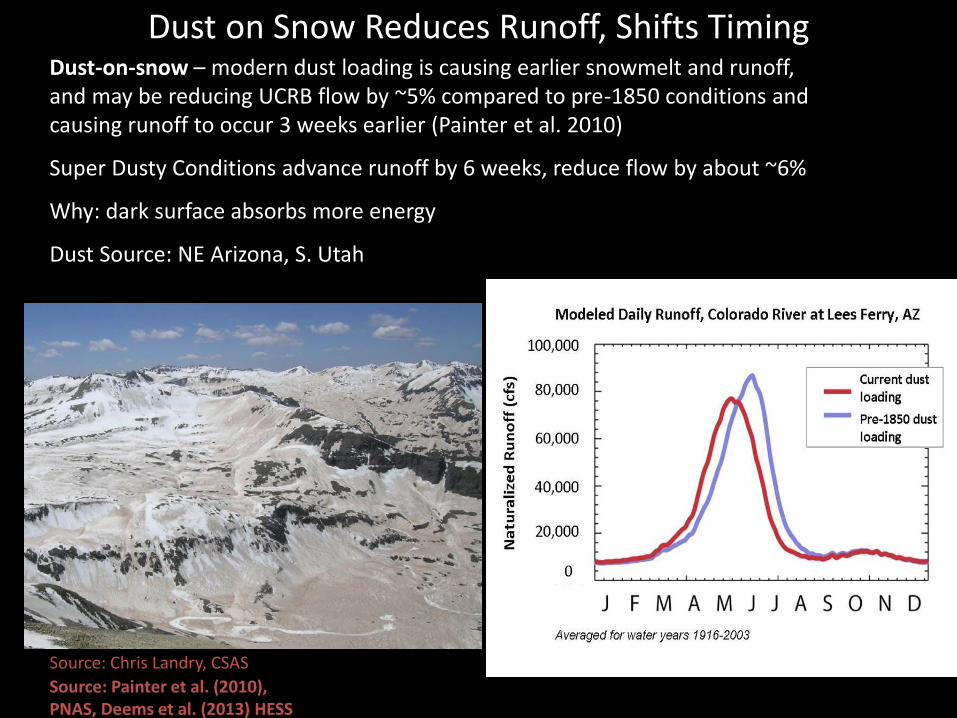
Dust-on-snow – modern dust loading is causing earlier snowmelt and runoff, and may be reducing UCRB flow by ~5% compared to pre-1850 conditions and causing runoff to occur 3 weeks earlier (Painter et al. 2010)
Super Dusty Conditions advance runoff by 6 weeks, reduce flow by about ~6%
Why: dark surface absorbs more energy
Dust Source: NE Arizona, S. Utah
Source: Chris Landry, CSAS
Source: Painter et al. (2010), PNAS, Deems et al. (2013) HESS
Dust on Snow Reduces Runoff, Shifts Timing
Sample Shifted Hydrograph in the Future
Historic Hydrograph Future Hydrograph
Month by Month Changes
Source: Lukas et al, 2014
Shifting Hydrograph will create winners and losers in Prior Appropriation.
These Juniors, historically out-of-priority, will be able store this water March to May
These historic Seniors who could divert July - September will be out of priority
Also Lack of Late Summer Exchange Potential
Montana
Utah
Idaho
California
Nevada
Oregon
Arizona
Iowa
Colorado
Wyoming
New Mexico
Nebraska
Georgia
Washington
South Dakota
North Dakota
2020s 2050s 2070s
-40
-20
0
20
40
-40
-20
0
20
40
Annual Dec-Mar Apr-Jul
Sacramento-San Joaquin Rivers at Delta
-40
-20
0
20
40
-40
-20
0
20
40
Annual Dec-Mar Apr-Jul
Klamath River near Klamath
-40
-20
0
20
40
-40
-20
0
20
40
Annual Dec-Mar Apr-Jul
Colorado River above Imperial Dam
-40
-20
0
20
40
-40
-20
0
20
40
Annual Dec-Mar Apr-Jul
Rio Grande at Elephant Butte Dam
-40
-20
0
20
40
-40
-20
0
20
40
Annual Dec-Mar Apr-Jul
Columbia River at Grand Coulee
-40
-20
0
20
40
-40
-20
0
20
40
Annual Dec-Mar Apr-Jul
Milk River at Nashua
-40
-20
0
20
40
-40
-20
0
20
40
Annual Dec-Mar Apr-Jul
Missouri River at Omaha
-40
-20
0
20
40
-40
-20
0
20
40
Annual Dec-Mar Apr-Jul
Colorado River at Lees Ferry
% C
ha
ng
e
% C
ha
ng
e%
Ch
an
ge
% C
ha
ng
e
% C
ha
ng
e
% C
ha
ng
e%
Ch
an
ge
% C
ha
ng
eRunoff Projections 2020s, 2050s, 2070s
3 Periods 1. Annual 2. Winter 3. Spring
Source: Reclamation
January 2014 Issue
Multi-decadal megadroughts also
likely, and will be on top of any
warming-related declines we will get…
A recent interdisciplinary
team reconciles future of
the Colorado River…
The Upper Colorado River Basin is Megadrought Country
Meko et al., (Geophysical Research Letters, 2007)
Reclamation Demand Projections • Modeled Changes in Irrigation Demands in
8 Basins
• Up to 12% increases in ET by 2080 (more in south, less north) – Perennial crops show highest increases – Annual crops show smaller increases (some
slight decreases)
• Modeled Changes in Reservoir Evaporation at 12 locations – Net Evap increases range from 2 to 6
inches/year – But precip increases add water thus many
sites overall show only slight increases in evap and some sites show decreases
•
Source: Reclamation, 2015
Expansion of Water Use
• Historically farmers allowed to divert when
needed in spring to water crops
• Longer growing seasons could allow additional cuttings of hay/alfalfa
• “Senior” Seniors could benefit at expense of “junior” seniors in late season
• Some ideas about quantifying rights in terms of consumptive use to ease transfers could apply here, too
– See Squillace, Water Transfers for a Changing Climate, 2013
Source: Reclamation, 2015
Rio Grande Climate Change
• Historical Trends over last 40 Years – Temps up by almost 3F – No changes to annual precip totals
• Projections – Additional 4-6F by 2100 – Declines in RG flow of approximately 1/3 by 2100 – SJC inflows decline by only (?) 25% – Decreases in summer flows, less in winter – Increases in variability and evaporative demand
• Water Management Implications – 50% less water for NM and Texas
• Less Everything: Ag, Muni, Hydropower, Env Flows, Recreation
– ‘Only’ 25% less for Colorado
• My Brief Analysis – Of all the Climate Change stream flow projections
in the Southwest that I’ve seen, this is by far the most serious
Source: Reclamation, 2013
Total Storage Heron
Take Home: Total New Mexico Large Reservoir Storage drops from ~800 kaf to ~350 kaf or about 55%
Total New Mexico Water Storage
A Summary
• Climate Change is Water Change
• Wetter North, Drier South
• More Rain, Less Snow
• Precipitation is not Runoff
• Temperatures Drive Lower Runoff
• Earlier Runoff, Lower Late Season Flows
• Dust on Snow advances runoff timing
• Fires, Megadroughts Additional Risks
• Water Demands Increase
• Climate Change makes ______ Worse
Longest megadrought in Colorado and Rio Grande headwaters…
50 years with 1 break year
GRL (2011)
Lee Ferry Projected Flows from Basin Study
Obs Max - Dash
Obs Min - Dash
Max Dark Shading 25-75% Light Shading 10-90% Horizontal Solid Line – Historical Average Bold Dark Line – 21st Century Median Red Line – One Representative Trace
Figure B-45 Tech Appendix B Each Year has 112 Projections
At 45 maf/year flood control may be an issue
-9%
Bottom Line: 75% Models Show Declines, Median Decline -9% at Mid - Century
Source: Reclamation, 2012
Cook Science
Increased Demands Due to Climate Change
Bottom Line: A Variety of Demand Increases Possible by Mid-Century, Average is 4%
4% More Annually Basin Wide
Source: Reclamation, 2012
IPCC FAR Results RCP 8.5 at 2081 to 2100
• Shifted Distribution Shows Increases in Frequency of Hot Events AND New All Time Hot Records.
• Actual Events are Difficult to Formally Attribute to Climate Change for a number of reasons.
• New Climate Curve will be moving to the right throughout the 21st Century.
Old (Lower) Frequency
New (Higher) Frequency
How Climate Change affects Event Intensity (How Far Right), Frequency (How Far Up), and Duration (Not shown)