WESTLAKE HIGH SCHOOL BIOLOGY SUMMER ASSIGNMENT 2017 Dear Future Biology Student, Hello! The Biology Team at Westlake High School is pleased to know that you are going to be a part of Biology in August! This is a challenging class, but it can be very rewarding if you put in the effort. You can understand the nature of science and the human impact on the environment. Biology is a hands on/inquiry course. We will support you in every way that we can and do our best to offer up exciting and engaging lessons. At the end of the school year, you will be expected to take the EOC test in Biology which accounts for 20% of your grade. Throughout the year, we will prepare you for the exam. We’re in this together and expect you to give your very best! **** Please complete the summer assignment below. Read the Biology content then complete the questions. The summer assignment will be graded as a performance assessment. Class supplies 2 Composition notebooks 4 pk of notecards Tape Highlighters Pens, pencils Thank you THE BIOLOGY TEAM!
Transcript
WESTLAKE HIGH SCHOOL BIOLOGY SUMMER ASSIGNMENT 2017 Dear Future Biology Student,
Hello! The Biology Team at Westlake High School is pleased to know that you are going to be a part of Biology in August! This is a challenging class, but it can be very rewarding if you put in the effort. You can understand the nature of science and the human impact on the environment. Biology is a hands on/inquiry course. We will support you in every way that we can and do our best to offer up exciting and engaging lessons. At the end of the school year, you will be expected to take the EOC test in Biology which accounts for 20% of your grade. Throughout the year, we will prepare you for the exam. We’re in this together and expect you to give your very best!
**** Please complete the summer assignment below. Read the Biology content then
complete the questions. The summer assignment will be graded as a performance assessment.
Class supplies
2 Composition notebooks
4 pk of notecards
Tape
Highlighters
Pens, pencils
Thank you
THE BIOLOGY TEAM!
Ecological Relationships 1
Ecological RelationshipsWhat symbiotic relationships are seen in ecosystems?
Why?All living organisms need each other in some way to survive. This can include the interactions between predators and their prey, the close associations between and among living things (symbiosis), or the com-petitive relationships between and among species. All of these relationships may be equally advantageous to the parties involved, or they may be more beneficial to one organism over the other.
Model 1 – Predator–Prey Relationships
Relationship between Snowshoe Hares and LynxNumber of haresNumber of lynx
c. For both y axes, what value do the numbers on the axes need to be multiplied by?
2. What was the approximate population of snowshoe hares in 1865?
2 POGIL™ Activities for High School Biology
3. What was the approximate population of lynx in 1865?
4. When the number of snowshoe hares is high, what happens to the number of lynx? Use actual data from the graph to support your observation.
5. What happens to the population of lynx as the number of snowshoe hares decreases? Use actual data from the graph to support your observation.
6. Propose an explanation for the apparent cause and effect relationship between the populations of lynx and hares.
7. What does this information tell you
a. about the effect of size of prey populations on the number of predators?
b. about the effect of predators on the populations of their prey?
8. What other factor would infl uence the size of the hare population in addition to the size of the population of lynx?
Ecological Relationships 3
Model 2 – Symbiosis
Organism 1 Organism 2 Description of the relationship Symbiotic Relationship
Dog Flea The flea feeds on blood from the dog. There is no benefit to the dog and the itching and bites may lead to infection.
Fungus Algae The photosynthetic algae provide food for the fungus, which in turn provides a suitable living environment for the algae.
Termite Cellulose- digesting bacteria
The bacteria in the gut of the termite breakdown and feed on some of the cellulose taken in by the termite. The termite would be unable to digest cellulose without these bacteria and they gain an additional source of nutrition from the surplus digested cellulose.
Shark Remora The Remora fish swim alongside the shark and take scraps of food that the shark drops during feeding. The shark does not eat the Remora and appears unaffected by its presence.
Cattle Cattle egret The cattle egret follows herds of cattle and eats the insects that the cattle stir up as they move through the grassland. The cattle appear to be unaffected by the egrets.
Human Tapeworm The tapeworm lives in the small intestines where it feeds and grows, robbing the human of essential nutrients.
9. Refer to the information given in Model 2.
a. In the dog and flea relationship, is there a benefit for one of the organisms or for both?
b. Is either the dog or the flea harmed by this relationship?
c. Which other relationship in Model 2 is similar to that between the dog and flea?
4 POGIL™ Activities for High School Biology
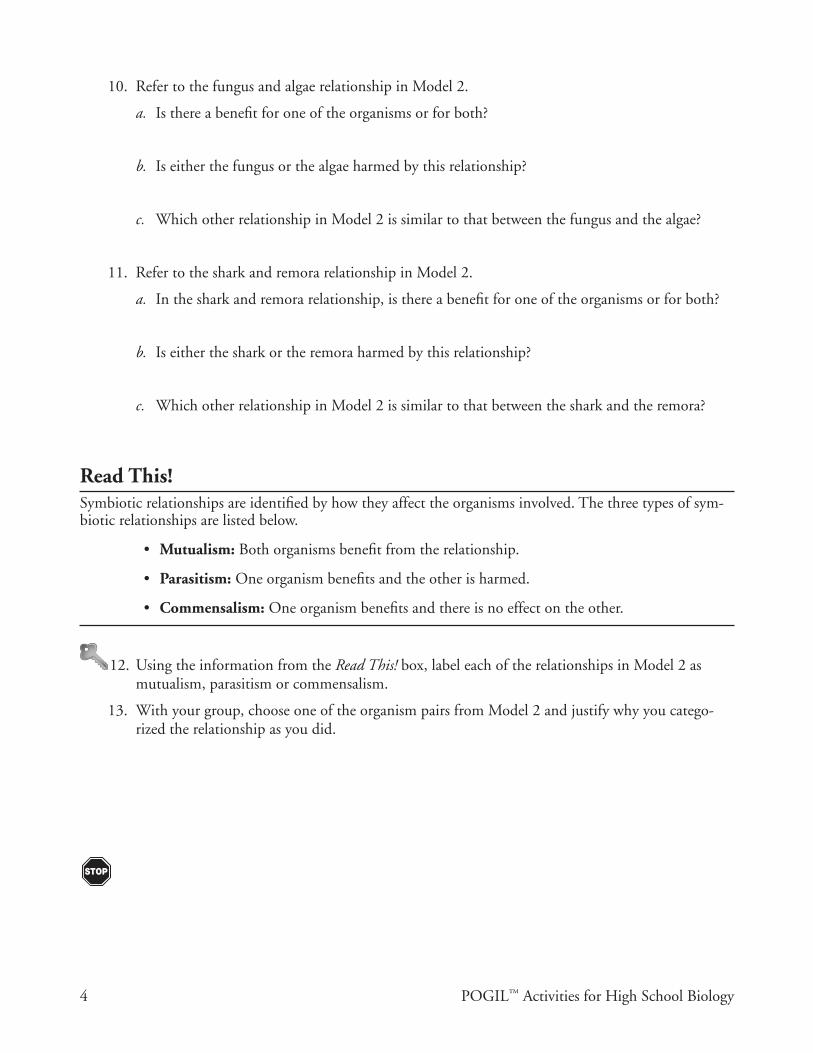
10. Refer to the fungus and algae relationship in Model 2.
a. Is there a benefi t for one of the organisms or for both?
b. Is either the fungus or the algae harmed by this relationship?
c. Which other relationship in Model 2 is similar to that between the fungus and the algae?
11. Refer to the shark and remora relationship in Model 2.
a. In the shark and remora relationship, is there a benefi t for one of the organisms or for both?
b. Is either the shark or the remora harmed by this relationship?
c. Which other relationship in Model 2 is similar to that between the shark and the remora?
Read This!Symbiotic relationships are identifi ed by how they affect the organisms involved. The three types of sym-biotic relationships are listed below.
• Mutualism: Both organisms benefi t from the relationship.
• Parasitism: One organism benefi ts and the other is harmed.
• Commensalism: One organism benefi ts and there is no effect on the other.
12. Using the information from the Read This! box, label each of the relationships in Model 2 as mutualism, parasitism or commensalism.
13. With your group, choose one of the organism pairs from Model 2 and justify why you catego-rized the relationship as you did.
Ecological Relationships 5
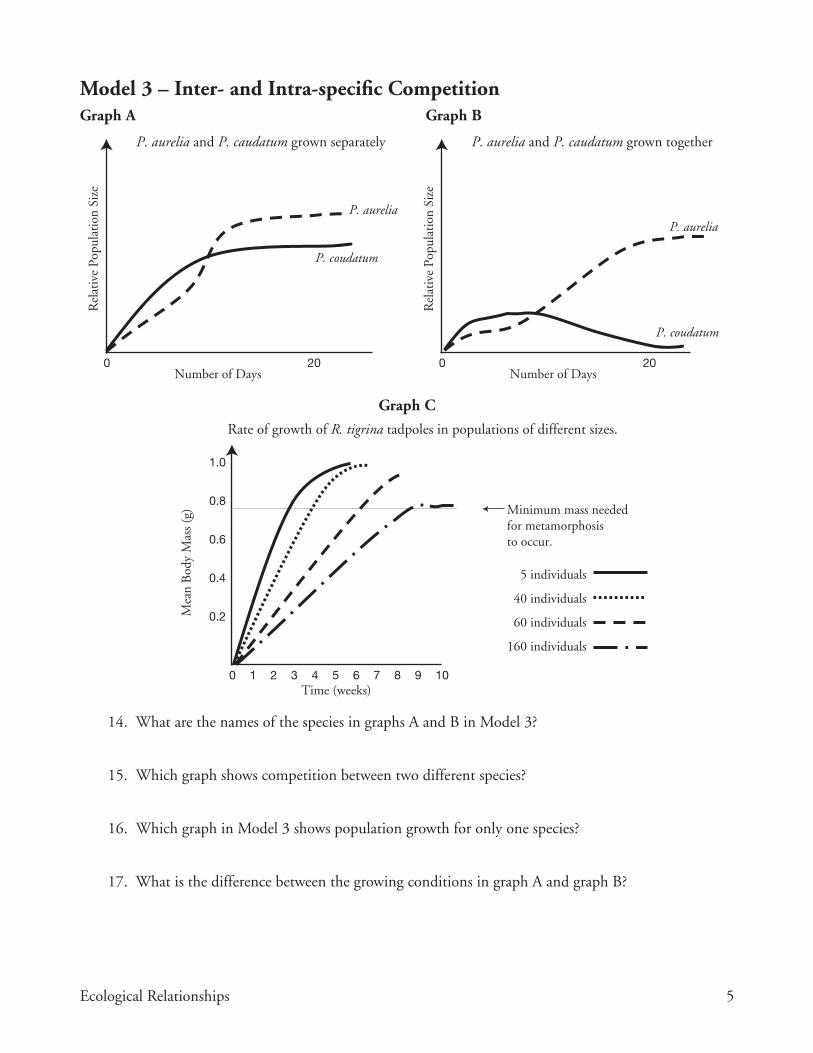
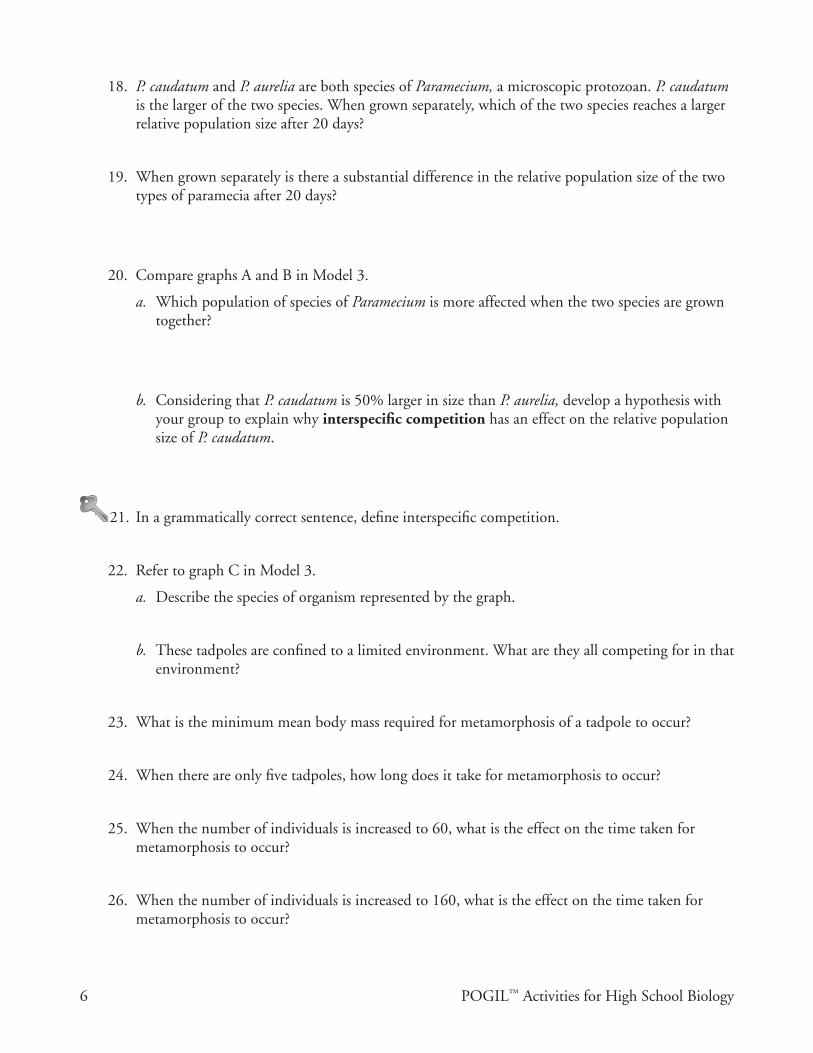
Model 3 – Inter- and Intra-specific CompetitionGraph A Graph B
Graph C
P. aurelia
P. aurelia and P. caudatum grown separately
P. coudatum
Number of Days0
Time (weeks)
Mea
n B
ody
Mas
s (g
)
Rate of growth of R. tigrina tadpoles in populations of different sizes.
0 1 2 3 4 5 6 7 8 9 10
20
Rel
ativ
e Po
pula
tion
Siz
e
P. aurelia
P. aurelia and P. caudatum grown together
P. coudatum
Number of Days0 20
Rel
ativ
e Po
pula
tion
Siz
e
1.0
0.8
0.6
0.4
0.2
Minimum mass neededfor metamorphosisto occur.
5 individuals
40 individuals
60 individuals
160 individuals
14. What are the names of the species in graphs A and B in Model 3?
15. Which graph shows competition between two different species?
16. Which graph in Model 3 shows population growth for only one species?
17. What is the difference between the growing conditions in graph A and graph B?
6 POGIL™ Activities for High School Biology
18. P. caudatum and P. aurelia are both species of Paramecium, a microscopic protozoan. P. caudatum is the larger of the two species. When grown separately, which of the two species reaches a larger relative population size after 20 days?
19. When grown separately is there a substantial difference in the relative population size of the two types of paramecia after 20 days?
20. Compare graphs A and B in Model 3.
a. Which population of species of Paramecium is more affected when the two species are grown together?
b. Considering that P. caudatum is 50% larger in size than P. aurelia, develop a hypothesis with your group to explain why interspecifi c competition has an effect on the relative population size of P. caudatum.
21. In a grammatically correct sentence, defi ne interspecifi c competition.
22. Refer to graph C in Model 3.
a. Describe the species of organism represented by the graph.
b. These tadpoles are confi ned to a limited environment. What are they all competing for in that environment?
23. What is the minimum mean body mass required for metamorphosis of a tadpole to occur?
24. When there are only fi ve tadpoles, how long does it take for metamorphosis to occur?
25. When the number of individuals is increased to 60, what is the effect on the time taken for metamorphosis to occur?
26. When the number of individuals is increased to 160, what is the effect on the time taken for metamorphosis to occur?
Ecological Relationships 7
27. Propose an explanation for why the population size affects the number of weeks before metamor-phosis of the tadpoles occurs.
28. The type of competition represented by graph C is referred to as intraspecifi c competition. What is different about this compared to the competition seen in graph B?
8 POGIL™ Activities for High School Biology
Extension Question29. An investigation was carried out into competition between two species of grass, Bromus madri-
tensis and B. rigidus. Equal numbers of seeds of B. madritensis were sown in a number of different pots. In each pot, an equal number of seeds of B. rigidus was then sown a different number of days after B. madritensis. The results are shown in the graph below.
Given that the total dry mass of plant material was the same in each pot, summarize the main conclusions that can be drawn from this investigation. Suggest an explanation for the results when the delay before sowing B. rigidus was 30 days.
100
80
60
40
20
00 10 20 30
Percentagecontribution ofB. madritensisto total dry massafter 45 days
Delay before planting B. madritensis/days
Ecological Pyramids 1
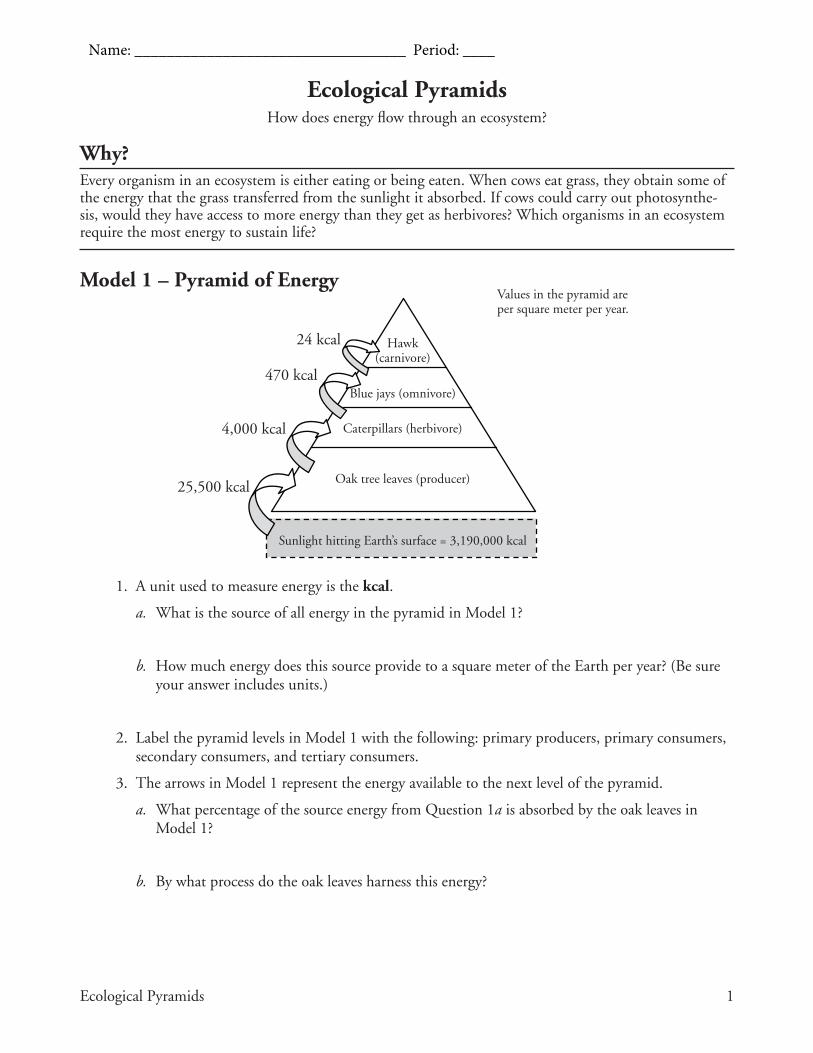
Ecological PyramidsHow does energy flow through an ecosystem?
Why?Every organism in an ecosystem is either eating or being eaten. When cows eat grass, they obtain some of the energy that the grass transferred from the sunlight it absorbed. If cows could carry out photosynthe-sis, would they have access to more energy than they get as herbivores? Which organisms in an ecosystem require the most energy to sustain life?
Model 1 – Pyramid of Energy
24 kcal Hawk(carnivore)
Values in the pyramid areper square meter per year.
Blue jays (omnivore)
Caterpillars (herbivore)
Oak tree leaves (producer)
Sunlight hitting Earth’s surface = 3,190,000 kcal
470 kcal
4,000 kcal
25,500 kcal
1. A unit used to measure energy is the kcal.
a. What is the source of all energy in the pyramid in Model 1?
b. How much energy does this source provide to a square meter of the Earth per year? (Be sureyour answer includes units.)
2. Label the pyramid levels in Model 1 with the following: primary producers, primary consumers,secondary consumers, and tertiary consumers.
3. The arrows in Model 1 represent the energy available to the next level of the pyramid.
a. What percentage of the source energy from Question 1a is absorbed by the oak leaves inModel 1?
b. By what process do the oak leaves harness this energy?
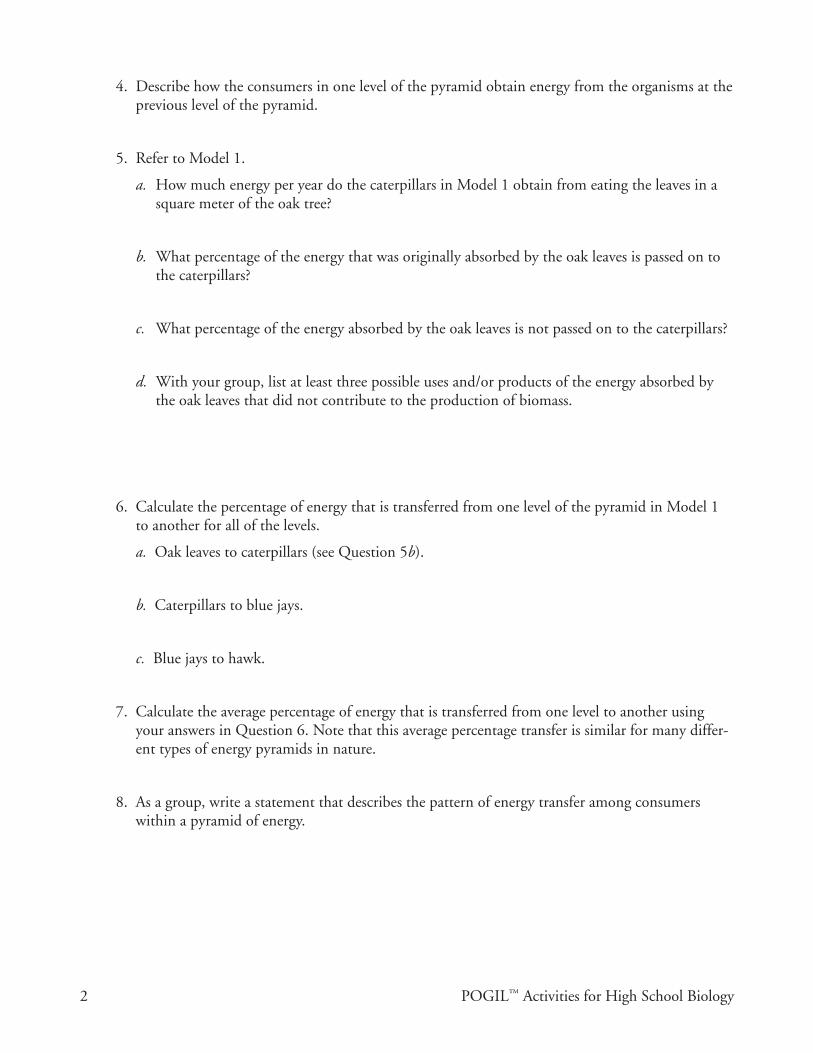
4. Describe how the consumers in one level of the pyramid obtain energy from the organisms at the previous level of the pyramid.
5. Refer to Model 1.
a. How much energy per year do the caterpillars in Model 1 obtain from eating the leaves in a square meter of the oak tree?
b. What percentage of the energy that was originally absorbed by the oak leaves is passed on to the caterpillars?
c. What percentage of the energy absorbed by the oak leaves is not passed on to the caterpillars?
d. With your group, list at least three possible uses and/or products of the energy absorbed by the oak leaves that did not contribute to the production of biomass.
6. Calculate the percentage of energy that is transferred from one level of the pyramid in Model 1 to another for all of the levels.
a. Oak leaves to caterpillars (see Question 5b).
b. Caterpillars to blue jays.
c. Blue jays to hawk.
7. Calculate the average percentage of energy that is transferred from one level to another using your answers in Question 6. Note that this average percentage transfer is similar for many differ-ent types of energy pyramids in nature.
8. As a group, write a statement that describes the pattern of energy transfer among consumers within a pyramid of energy.
Ecological Pyramids 3
9. What percentage of the caterpillars’ original energy is available to the hawk?
10. What percentage of the oak leaves’ original energy is available to the hawk?
11. Explain why an energy pyramid in any ecosystem typically is limited to four or fi ve levels only.
12. Propose an explanation for why populations of top carnivores, such as hawks, are always smaller than the populations of herbivores, such as caterpillars.
Read This!Each level in the pyramid in Model 1 is a trophic level. The word “trophic” refers to feeding or nutrition. Model 1 shows one example of one organism that would be included in each level, but each level in an ecosystem includes many species of organisms.
13. List at least three other species that might be found in the trophic level with the oak trees.
14. List at least three other species that might be found in the trophic level with the blue jays.
4 POGIL™ Activities for High School Biology
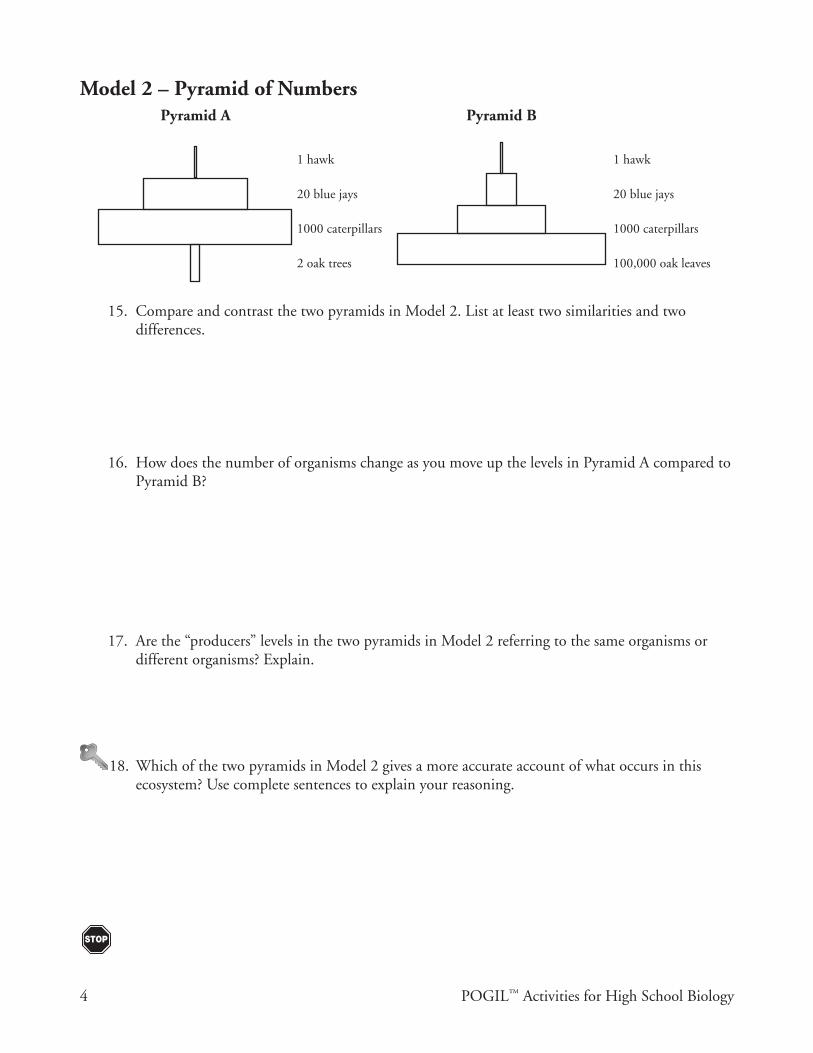
Model 2 – Pyramid of Numbers Pyramid A Pyramid B
1 hawk
20 blue jays
1000 caterpillars
2 oak trees
1 hawk
20 blue jays
1000 caterpillars
100,000 oak leaves
15. Compare and contrast the two pyramids in Model 2. List at least two similarities and two differences.
16. How does the number of organisms change as you move up the levels in Pyramid A compared to Pyramid B?
17. Are the “producers” levels in the two pyramids in Model 2 referring to the same organisms or different organisms? Explain.
18. Which of the two pyramids in Model 2 gives a more accurate account of what occurs in this ecosystem? Use complete sentences to explain your reasoning.
Ecological Pyramids 5
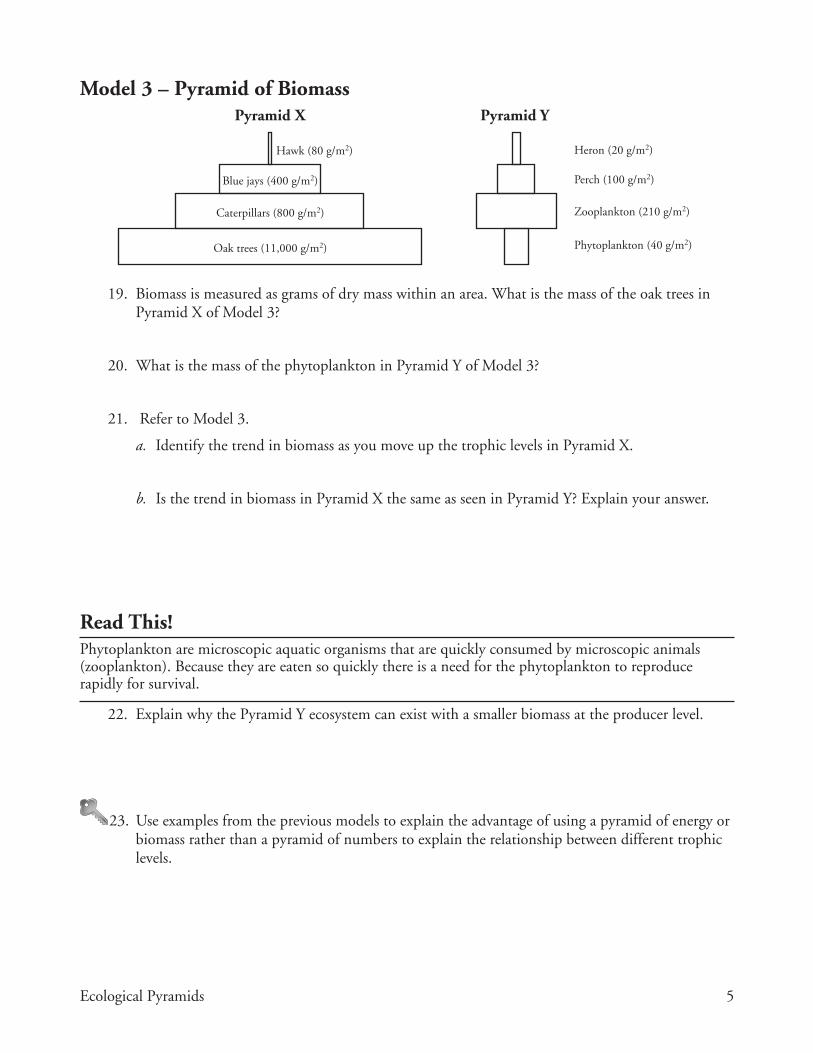
Model 3 – Pyramid of Biomass Pyramid X Pyramid Y
Hawk (80 g/m2)
Blue jays (400 g/m2)
Heron (20 g/m2)
Perch (100 g/m2)
Zooplankton (210 g/m2)
Phytoplankton (40 g/m2)Oak trees (11,000 g/m2)
Caterpillars (800 g/m2)
19. Biomass is measured as grams of dry mass within an area. What is the mass of the oak trees in Pyramid X of Model 3?
20. What is the mass of the phytoplankton in Pyramid Y of Model 3?
21. Refer to Model 3.
a. Identify the trend in biomass as you move up the trophic levels in Pyramid X.
b. Is the trend in biomass in Pyramid X the same as seen in Pyramid Y? Explain your answer.
Read This!Phytoplankton are microscopic aquatic organisms that are quickly consumed by microscopic animals (zooplankton). Because they are eaten so quickly there is a need for the phytoplankton to reproduce rapidly for survival.
22. Explain why the Pyramid Y ecosystem can exist with a smaller biomass at the producer level.
23. Use examples from the previous models to explain the advantage of using a pyramid of energy or biomass rather than a pyramid of numbers to explain the relationship between different trophic levels.
6 POGIL™ Activities for High School Biology
Extension Questions24. What type of organisms are missing from all of the trophic pyramids shown in Models 1–3?
25. Explain why a vegetarian diet is considered a more energy-efficient diet for humans than one based on beef, chicken or pork.