41
© 2012 Weatherford. All rights reserved. Introduction to Artificial Lift March 2013
| Date post: | 06-Jul-2016 |
| Category: |
Documents |
| Upload: | mohamed-m-ashraf |
| View: | 27 times |
| Download: | 4 times |
© 2012 Weatherford. All rights reserved.
Introduction to Artificial Lift
March 2013
© 2012 Weatherford. All rights reserved.
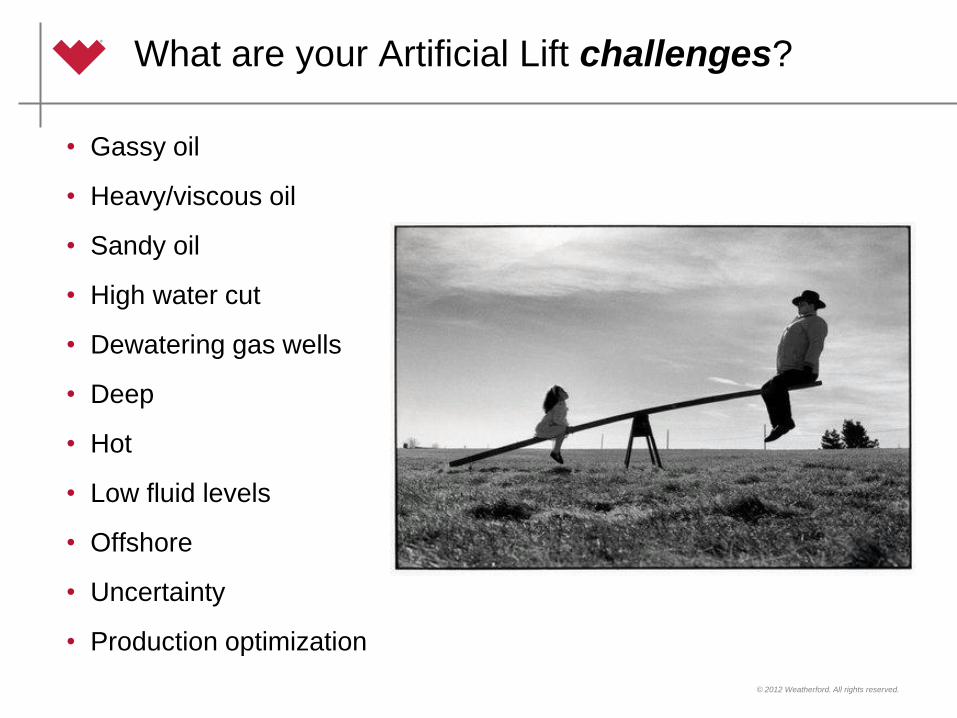
What are your Artificial Lift challenges?
• Gassy oil
• Heavy/viscous oil
• Sandy oil
• High water cut
• Dewatering gas wells
• Deep
• Hot
• Low fluid levels
• Offshore
• Uncertainty
• Production optimization
© 2012 Weatherford. All rights reserved.
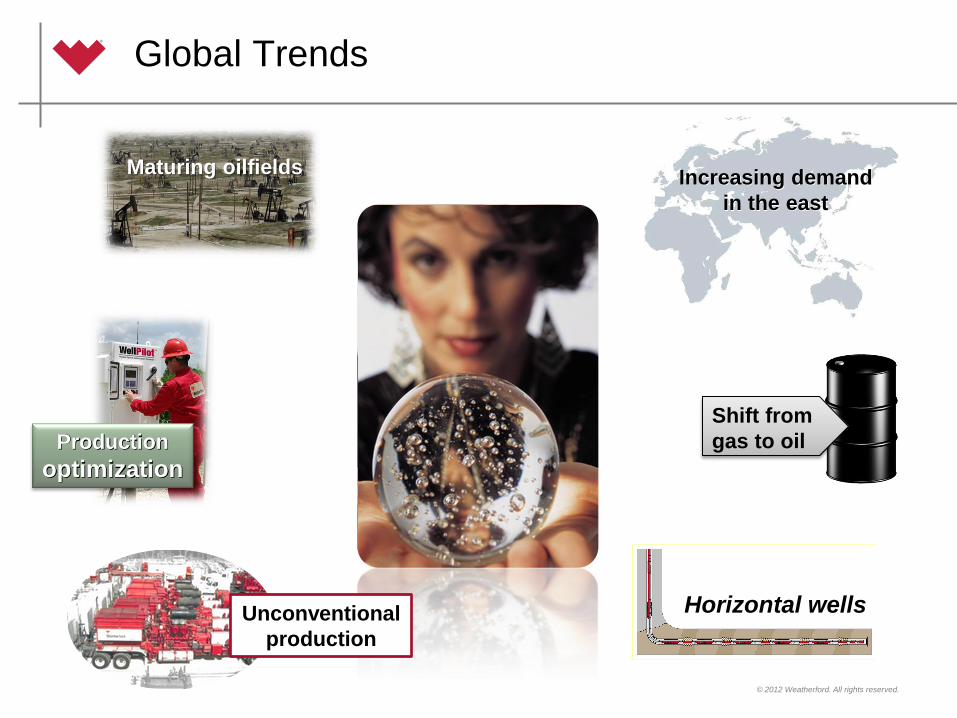
Global Trends
Horizontal wells
Maturing oilfields Increasing demand
in the east
Unconventional
production
Production
optimization
Shift from
gas to oil

© 2012 Weatherford. All rights reserved.
The shift toward lower volume mature wells
Source: Welling & Company 2010, Worldwide Survey of the Market of Artificial
Lift Equipment
54% 62%
16%
18% 10%
9% 9%
5% 11%
6%
0%
10%
20%
30%
40%
50%
60%
70%
80%
90%
100%
2004 2010
10,000+
3,000-10,000
1,500-3,000
500-1,500
0-500
Production Volume (BPD)
© 2012 Weatherford. All rights reserved.
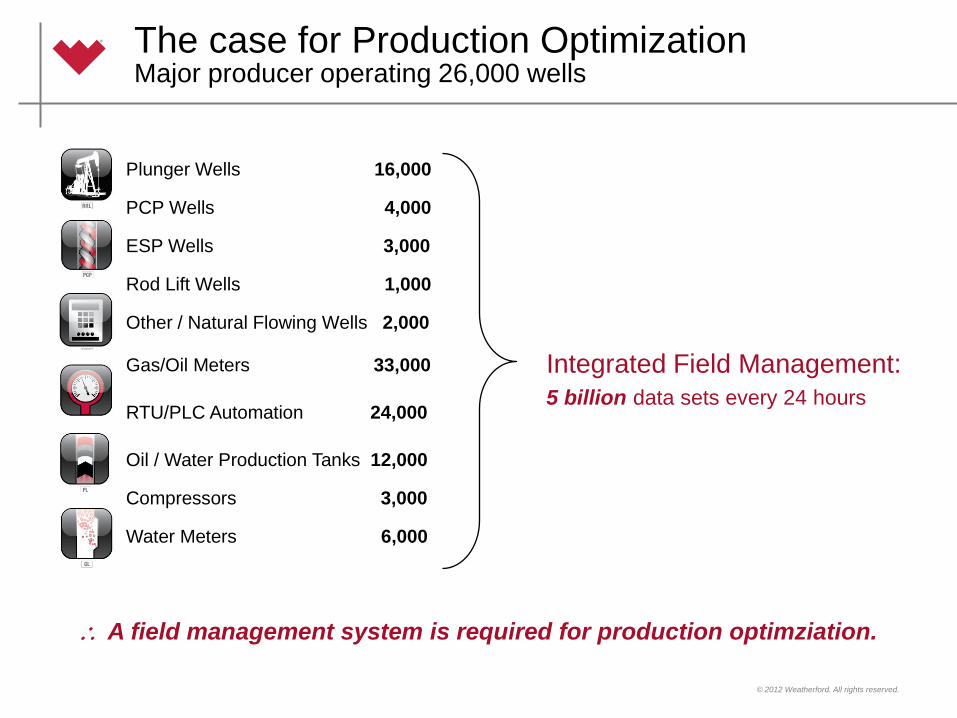
The case for Production Optimization Major producer operating 26,000 wells
Integrated Field Management:
5 billion data sets every 24 hours
Plunger Wells 16,000
PCP Wells 4,000
ESP Wells 3,000
Rod Lift Wells 1,000
Other / Natural Flowing Wells 2,000
Gas/Oil Meters 33,000
RTU/PLC Automation 24,000
Oil / Water Production Tanks 12,000
Compressors 3,000
Water Meters 6,000
A field management system is required for production optimziation.
© 2012 Weatherford. All rights reserved.
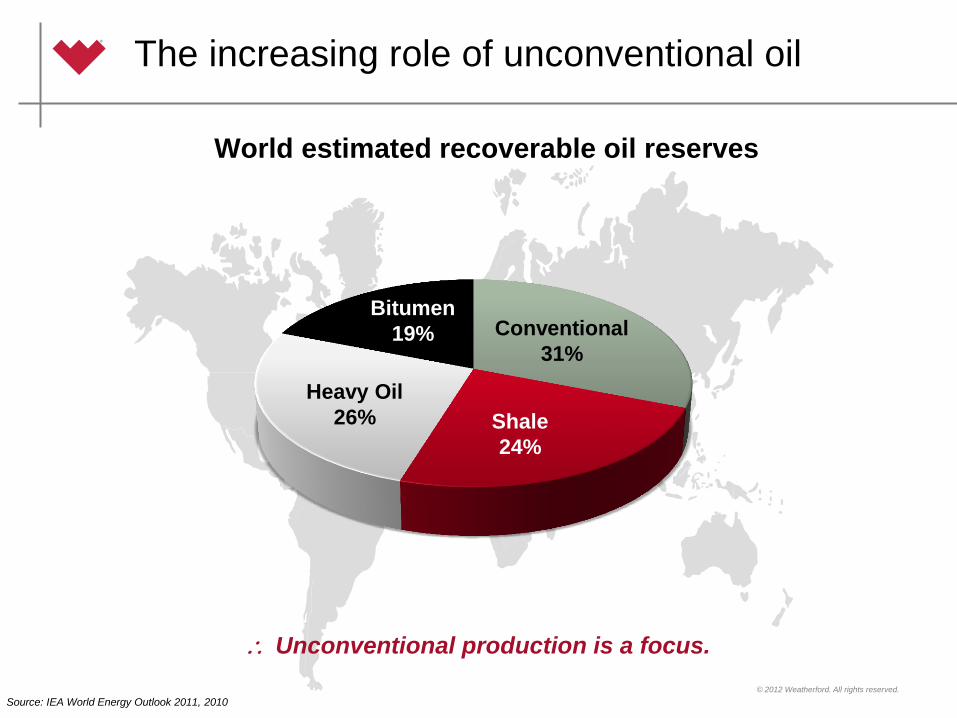
The increasing role of unconventional oil
World estimated recoverable oil reserves
Source: IEA World Energy Outlook 2011, 2010
Conventional
31%
Bitumen
19%
Heavy Oil
26% Shale
24%
Unconventional production is a focus.

© 2012 Weatherford. All rights reserved.
The shift from vertical to horizontal wells
Reaching hydrocarbons in shale
Steam Assisted Gravity Drainage
(SAGD) to mobilize heavy oil
© 2012 Weatherford. All rights reserved.
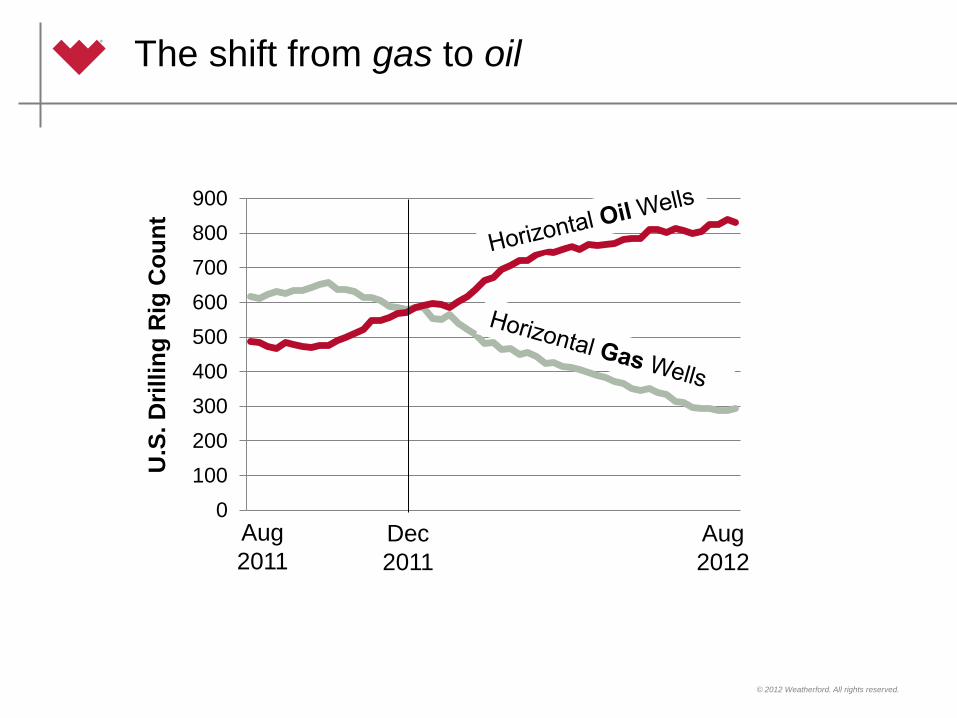
The shift from gas to oil
0
100
200
300
400
500
600
700
800
900
Aug
2011 Dec
2011
Aug
2012
U.S
. D
rill
ing
Rig
Co
un
t

© 2012 Weatherford. All rights reserved.
Global oil demand shifting to the east
USA
CANADA
MEXICO
BRAZIL
REST OF
WESTERN EUROPE
UK
NETHERLANDS
FRANCE
ITALY
GERMANY
FSU
MIDDLE EAST
AFRICA
AUSTRALIA
& NEW ZEALAND
Source EIA
35%
DEVELOPING
ASIA
86%
26 Mbbl/d 14 Mbbl/d
19 Mbbl/d 26 Mbbl/d
REST OF SOUTH
AMERICA
2020
2001
1990

© 2012 Weatherford. All rights reserved.
Increasing focus on production technologies
Revenue G
row
th
3Oilfield Market Report 2005-2013, Spears & Associates, Inc.
-20%
0%
20%
40%
60%
80%
100%
120%
140%
2007 2008 2009 2010 2011 2012 2013
117%
53%
© 2012 Weatherford. All rights reserved.
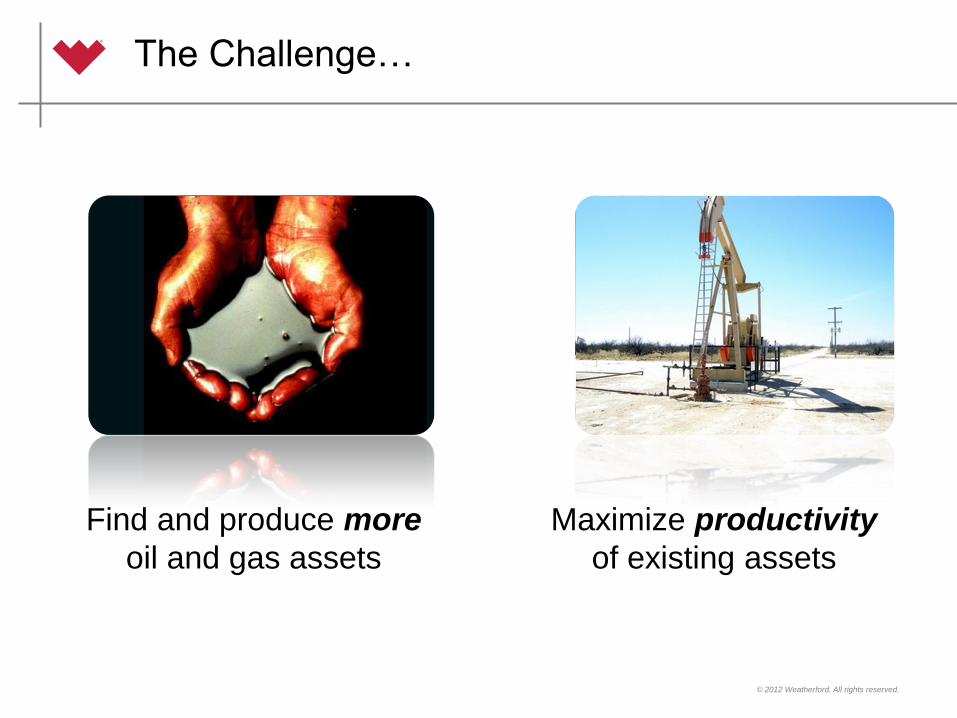
The Challenge…
Find and produce more
oil and gas assets
Maximize productivity
of existing assets

© 2012 Weatherford. All rights reserved.
Naturally Flowing versus Artificial Lifted Oil Wells
5% 95%
Source: World Oil, Feb 2012 “Based on the states for which the World Oil was able to obtain a breakout of flowing wells versus those on artificial lift, the percentage of
U.S. oil wells produced by artificial lift is staying steady at about 95%. That ratio has remained fairly constant throughout the past 10 years.”

© 2012 Weatherford. All rights reserved.
The Life of an Oil Well
Pro
du
cti
on
Vo
lum
e
TIME
Naturally
Flowing
Leverage
Formation
Pressure Mechanical
Assist
Artificial Lift
95% of active oil wells utilize
some type of artificial lift1.
1From World Oil, February, 2012.

© 2012 Weatherford. All rights reserved.
What liquids are being lifted?
0
20
40
60
80
100
Oil = 16%
Water = 84%
Ref: Produced Water Volumes and Management Practices in the United States (2007), Argonne National Laboratory; Sept, 2009
© 2012 Weatherford. All rights reserved.
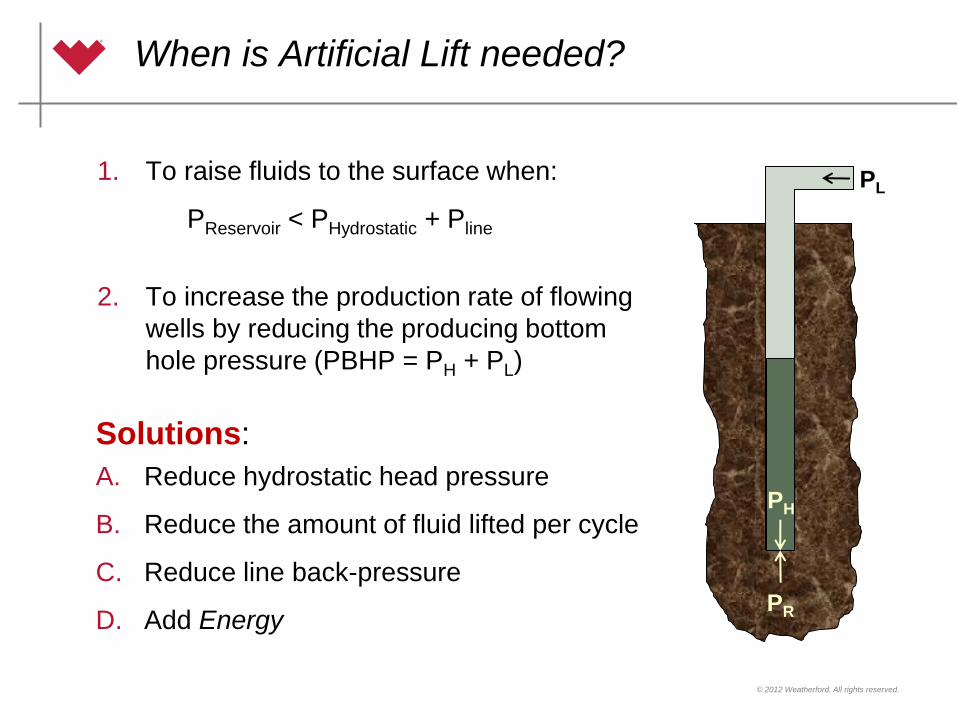
1. To raise fluids to the surface when:
PReservoir < PHydrostatic + Pline
2. To increase the production rate of flowing
wells by reducing the producing bottom
hole pressure (PBHP = PH + PL)
When is Artificial Lift needed?
Solutions:
A. Reduce hydrostatic head pressure
B. Reduce the amount of fluid lifted per cycle
C. Reduce line back-pressure
D. Add Energy
PH
PR
PL
© 2012 Weatherford. All rights reserved.
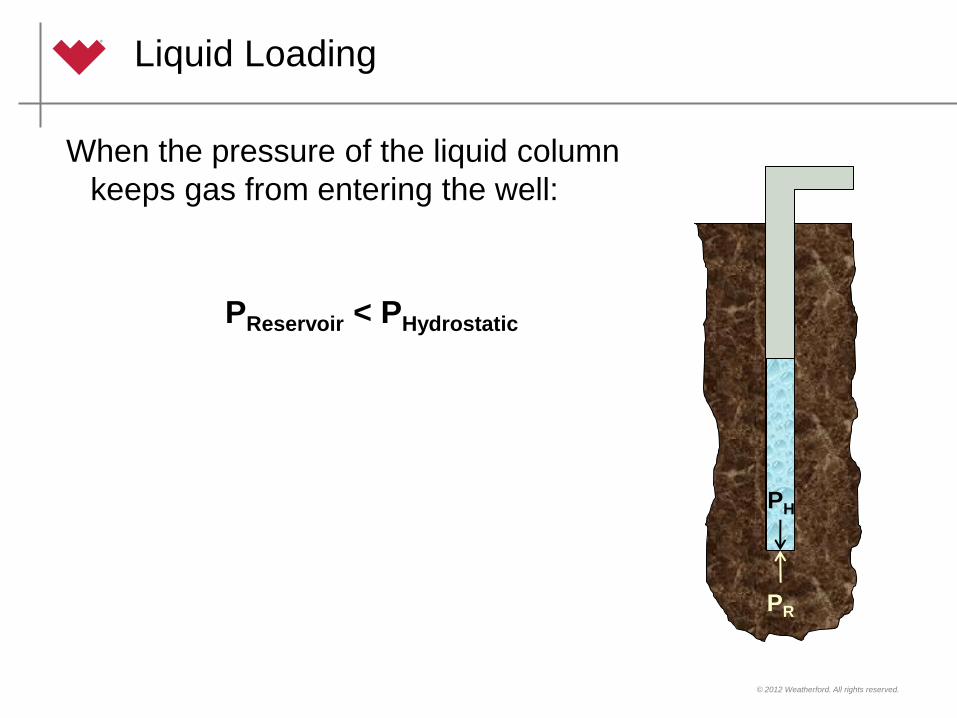
Liquid Loading
When the pressure of the liquid column
keeps gas from entering the well:
PH
PR
PReservoir < PHydrostatic

© 2012 Weatherford. All rights reserved.
Lift Technologies by Energy Source
Gas Lift Plunger
Lift
Foam
Lift
Formation Pressure
PCP Rod
Lift ESP Hydraulic
Lift
Mechanical Assist
© 2012 Weatherford. All rights reserved.
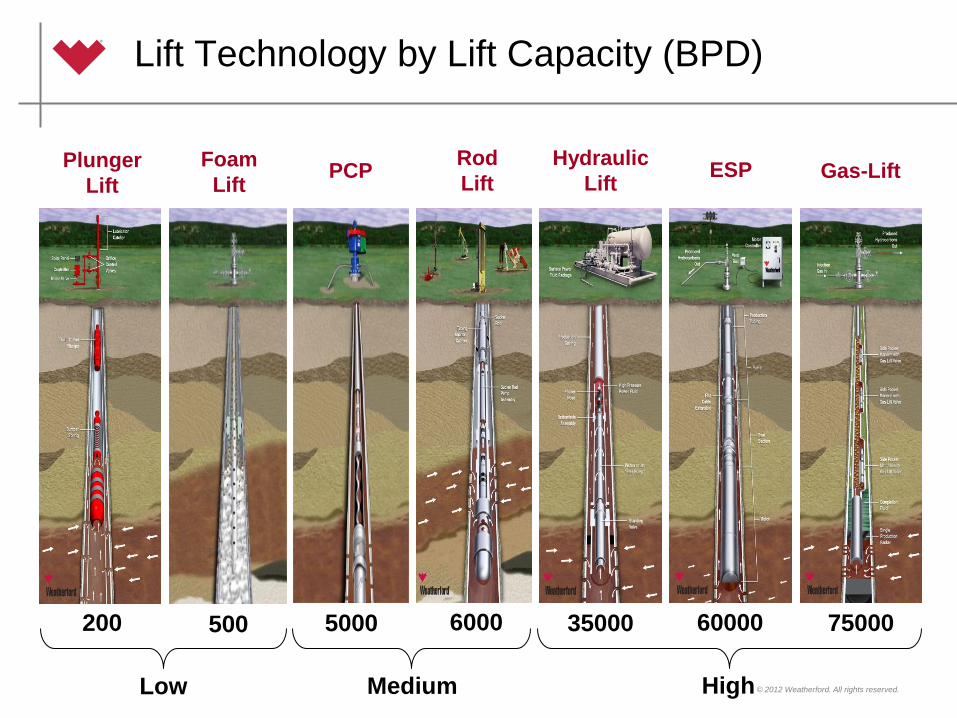
Lift Technology by Lift Capacity (BPD)
Foam
Lift
500
Plunger
Lift
200
Low
Hydraulic
Lift
35000
ESP
60000
Gas-Lift
75000
High
Rod
Lift
6000
PCP
5000
Medium
© 2012 Weatherford. All rights reserved.
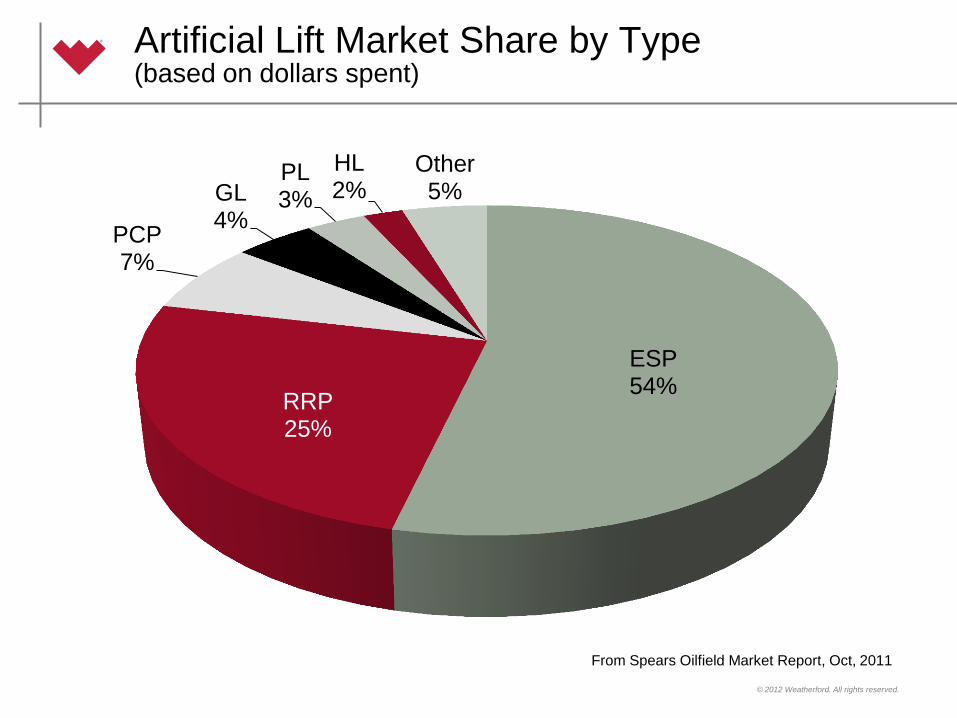
Artificial Lift Market Share by Type (based on dollars spent)
ESP 54%
RRP 25%
PCP 7%
GL 4%
PL 3%
HL 2%
Other 5%
From Spears Oilfield Market Report, Oct, 2011
© 2012 Weatherford. All rights reserved.
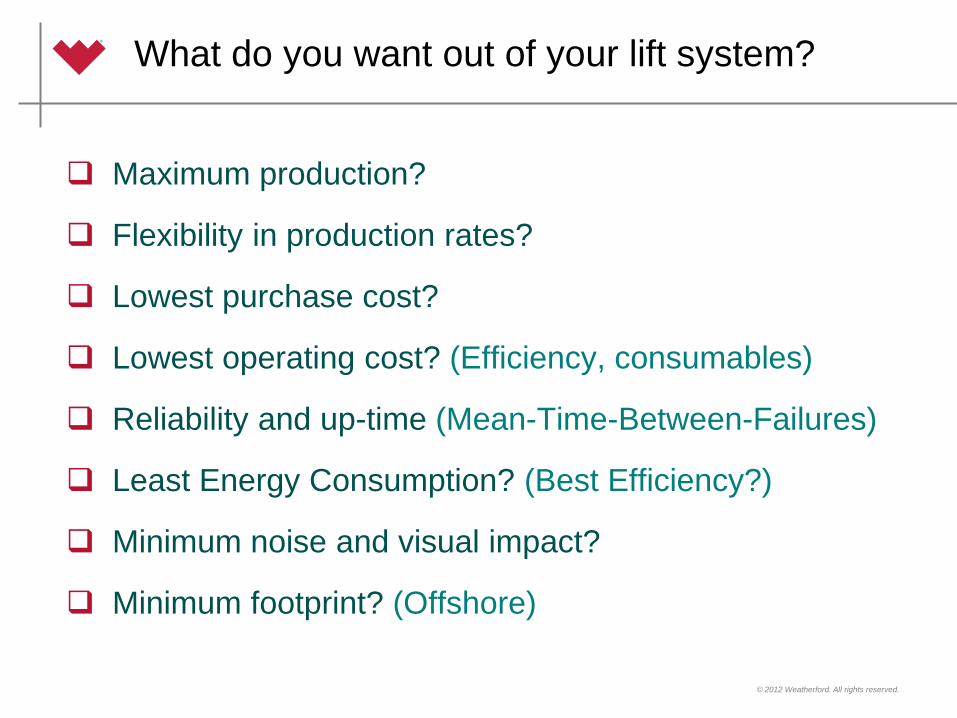
What do you want out of your lift system?
Maximum production?
Flexibility in production rates?
Lowest purchase cost?
Lowest operating cost? (Efficiency, consumables)
Reliability and up-time (Mean-Time-Between-Failures)
Least Energy Consumption? (Best Efficiency?)
Minimum noise and visual impact?
Minimum footprint? (Offshore)
© 2012 Weatherford. All rights reserved.
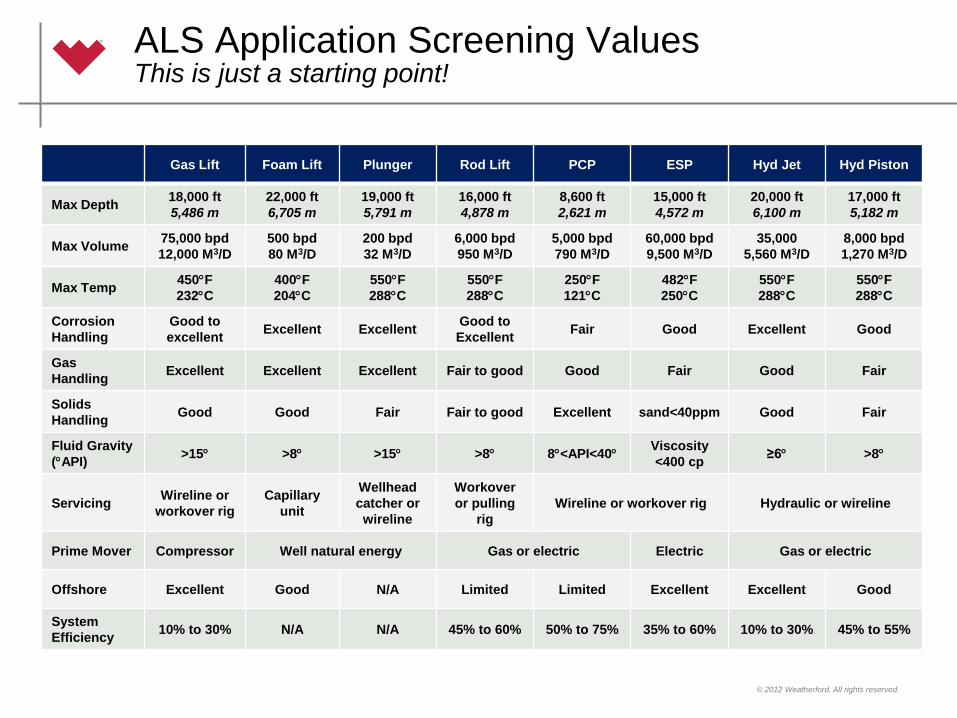
ALS Application Screening Values This is just a starting point!
Gas Lift Foam Lift Plunger Rod Lift PCP ESP Hyd Jet Hyd Piston
Max Depth 18,000 ft
5,486 m
22,000 ft
6,705 m
19,000 ft
5,791 m
16,000 ft
4,878 m
8,600 ft
2,621 m
15,000 ft
4,572 m
20,000 ft
6,100 m
17,000 ft
5,182 m
Max Volume 75,000 bpd
12,000 M3/D
500 bpd
80 M3/D
200 bpd
32 M3/D
6,000 bpd
950 M3/D
5,000 bpd
790 M3/D
60,000 bpd
9,500 M3/D
35,000
5,560 M3/D
8,000 bpd
1,270 M3/D
Max Temp 450F
232C
400F
204C
550F
288C
550F
288C
250F
121C
482F
250C
550F
288C
550F
288C
Corrosion
Handling
Good to
excellent Excellent Excellent
Good to
Excellent Fair Good Excellent Good
Gas
Handling Excellent Excellent Excellent Fair to good Good Fair Good Fair
Solids
Handling Good Good Fair Fair to good Excellent sand<40ppm Good Fair
Fluid Gravity
(API) >15 >8 >15 >8 8<API<40
Viscosity
<400 cp ≥6 >8
Servicing Wireline or
workover rig
Capillary
unit
Wellhead
catcher or
wireline
Workover
or pulling
rig
Wireline or workover rig Hydraulic or wireline
Prime Mover Compressor Well natural energy Gas or electric Electric Gas or electric
Offshore Excellent Good N/A Limited Limited Excellent Excellent Good
System
Efficiency 10% to 30% N/A N/A 45% to 60% 50% to 75% 35% to 60% 10% to 30% 45% to 55%

© 2012 Weatherford. All rights reserved.
1. Understand and predict reservoir potential performance.
2. Establish target production levels and conditions.
3. Eliminate technically infeasible lift technologies.
– Required performance
– Support infrastructure (power, skill base, etc.)
4. Economic evaluation
– Acquisition, installation, & training cost
– Operating cost
– Reliability
– Repair/replacement
ALS Technology Application Process
© 2012 Weatherford. All rights reserved.
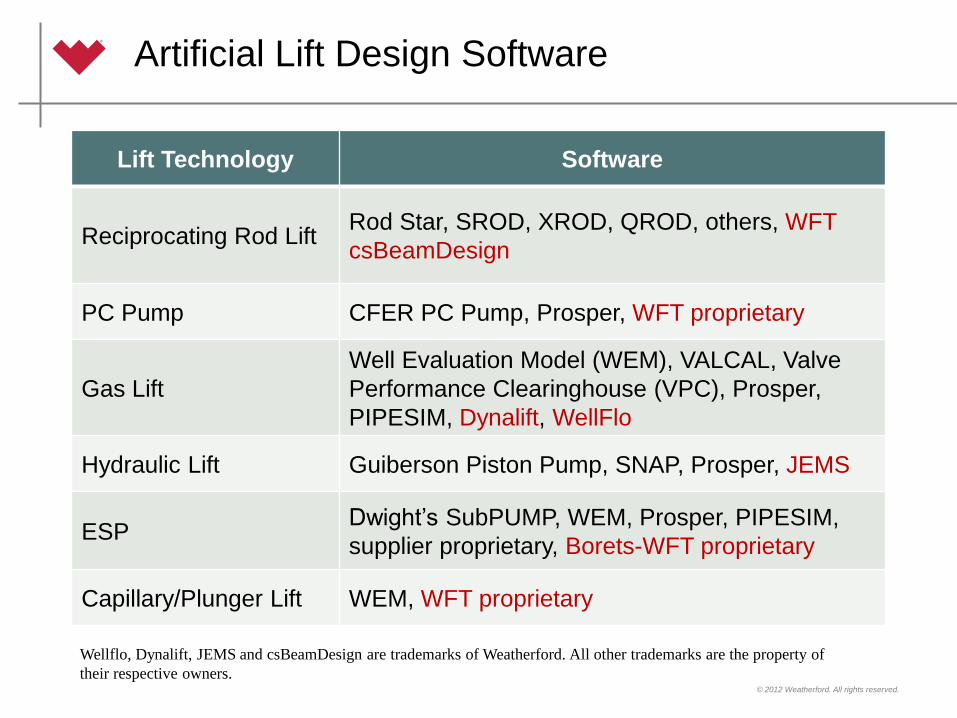
Artificial Lift Design Software
Lift Technology Software
Reciprocating Rod Lift Rod Star, SROD, XROD, QROD, others, WFT
csBeamDesign
PC Pump CFER PC Pump, Prosper, WFT proprietary
Gas Lift
Well Evaluation Model (WEM), VALCAL, Valve
Performance Clearinghouse (VPC), Prosper,
PIPESIM, Dynalift, WellFlo
Hydraulic Lift Guiberson Piston Pump, SNAP, Prosper, JEMS
ESP Dwight’s SubPUMP, WEM, Prosper, PIPESIM,
supplier proprietary, Borets-WFT proprietary
Capillary/Plunger Lift WEM, WFT proprietary
Wellflo, Dynalift, JEMS and csBeamDesign are trademarks of Weatherford. All other trademarks are the property of
their respective owners.

© 2012 Weatherford. All rights reserved.
What is Production Optimization?
Managing production of hydrocarbons as things change
over time
• Surveillance and measurement – What is happening?
• Analysis – Why is it happening?
• Design of solutions – How can performance be improved?
• Asset management – When and where?
• Reporting – KPI’s and feedback

© 2012 Weatherford. All rights reserved.
Real Results from Production Optimization
SPE study group surveyed PO literature, June, 20101:
• Production Improvements = 3% to 20% (avg = 3,000 BPD)
• CAPEX savings = $42,000 to $345,000 (avg = $200,000)
1Ref: http://www.spegcs.org/attachments/studygroups/4/DE%20Workshop%20Literature%20Review%20Slides.pdf 2Cumulative value, SPE#128245, March, 2010.
Value of PO to Shell2 from increased
production & reduced costs:
• 70,000 BPD
• $5 billion accumulated value
© 2012 Weatherford. All rights reserved.
Key Concepts for Understanding ALS
Inflow Performance Relationship (IPR)
Gas Lock
Cavitation
Pump Turndown Ratio

© 2012 Weatherford. All rights reserved.
Formation Pressure = {distance from well}
SBHPPw
Pt
Surface FacilitiesLift SystemFlow rate Q
Pressure
Distance
SBHP
PBHP
Drawdown
PBHP
Dp/Dr2
1Dp/Dr
© 2012 Weatherford. All rights reserved.
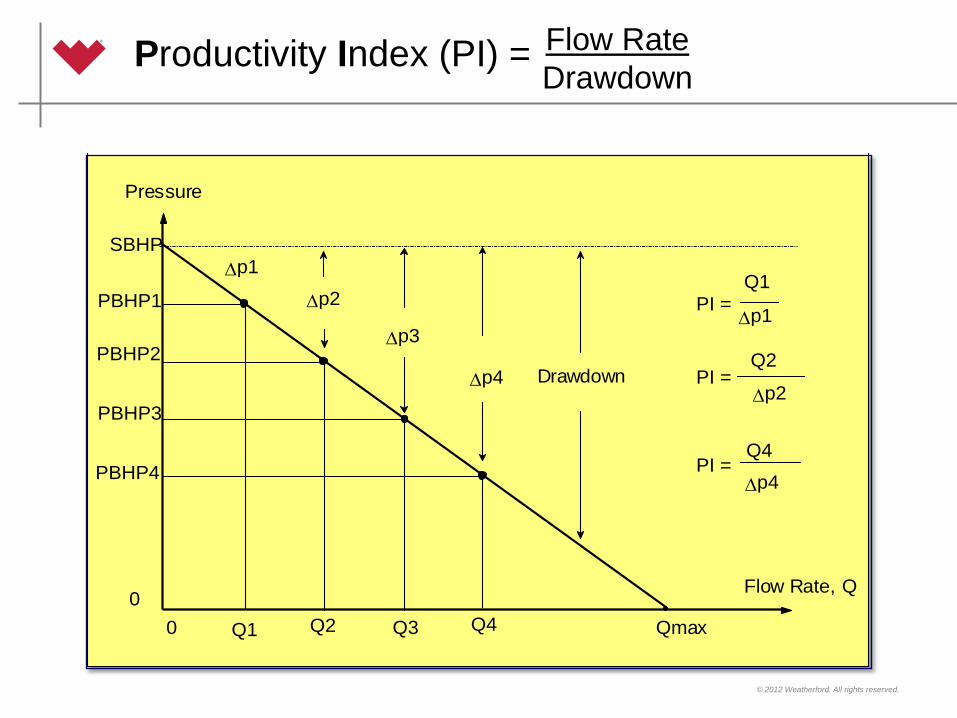
Productivity Index (PI) =
Pressure
Drawdown
Flow Rate, Q
SBHP
PBHP1
PBHP2
PBHP3
PBHP4
Q1 Q2 Q3 Q4
p1
p2
p3
p4
Productivity = Drawdown
Flow Rate
PI = p1
Q1
p2
Q2PI =
p4
Q4PI =
Qmax
0
0
Flow Rate
Drawdown

© 2012 Weatherford. All rights reserved.
Inflow Performance Relation (IPR)
Pressure
Flow Rate, Q
SBHP
PBHP1
PBHP2
PBHP3
PBHP4
Q1 Q2 Q3 Q4
p1
p2
p3
p4
Qmax(PI)
0
0
Doubling the Drawdown
does not Double the
Production
The slope is a function
of flow rate, defining a
curve known as the:
Inflow Performance Relation
or IPR.
Stabilized Formation Pressure
Qmax(IPR)

© 2012 Weatherford. All rights reserved.
Typical IPR versus Reservoir Drive System
Pwf
0 0 q
© 2012 Weatherford. All rights reserved.
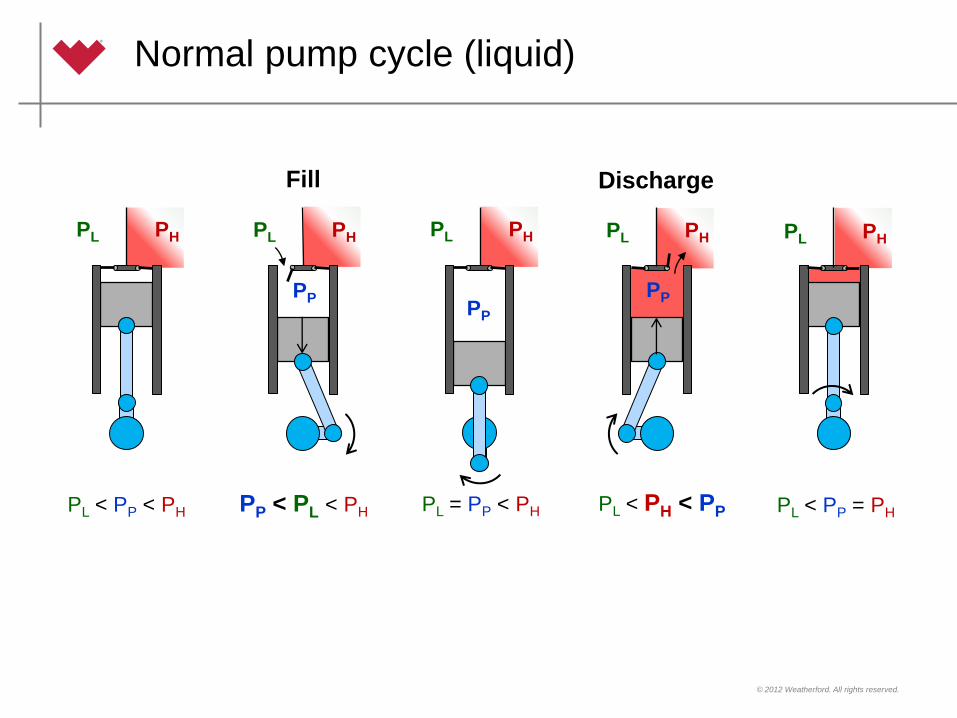
Normal pump cycle (liquid)
PL PH
PL < PP < PH
PL PH
PP
PL = PP < PH
PL PH
PL < PP = PH
PL PH
PP
PP < PL < PH
Fill
PL PH
PP
PL < PH < PP
Discharge

© 2012 Weatherford. All rights reserved.
Gas Lock
PL PH
PL < PP PH
PL PH
PP
PL PP < PH
PL PH
PL < PP PH
PL PH
PP
Fill?
PL < PP < PH
Gas in pump
expands, but
PL < PP
so no flow.
PL PH
PP
Discharge?
PL < PP < PH
Gas in pump
compresses, but
PP < PH
so no flow.

© 2012 Weatherford. All rights reserved.
Gas Locking in Rod Pumps
The swept volume in the pump is occupied by
gas. No fluid is pumped as the pump strokes:
• Downstroke
The gas compresses but does not have
enough pressure to open the traveling
valve.
• Upstroke
The gas decompresses, but it has higher
pressure than the reservoir so the standing
valve remains closed.
RESULT: No fluid enters or leaves the pump.
Upstroke Downstroke
© 2012 Weatherford. All rights reserved.
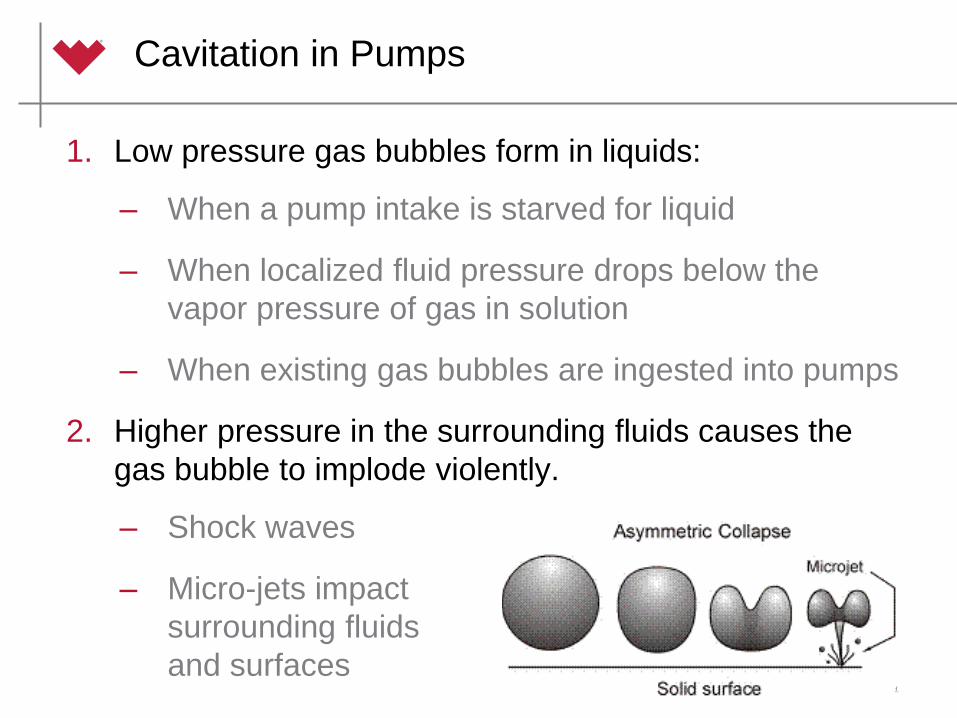
Cavitation in Pumps
1. Low pressure gas bubbles form in liquids:
– When a pump intake is starved for liquid
– When localized fluid pressure drops below the
vapor pressure of gas in solution
– When existing gas bubbles are ingested into pumps
2. Higher pressure in the surrounding fluids causes the
gas bubble to implode violently.
– Shock waves
– Micro-jets impact
surrounding fluids
and surfaces

© 2012 Weatherford. All rights reserved.
Cavitation Sequence

© 2012 Weatherford. All rights reserved.
Imploding Bubbles
Cavitation Shock Wave
Shock Wave

© 2012 Weatherford. All rights reserved.
Cavitation Micro-Jet

© 2012 Weatherford. All rights reserved.
Cavitation Damage Centrifugal Pump Impeller Stage

© 2012 Weatherford. All rights reserved.
Pump “Turndown Ratio”
Turndown ratio is a measure of a pump’s capacity to
change production volume:
40
Turndown Ratio = Maximum Volume
Minimum Volume
For example, a pump capable of 10 to 50 BPD would
have a turndown ratio of 5:
Turndown Ratio = = 5 50 BPD
10 BPD
Pumps with high turndown ratios are helpful when
production volumes are expected to vary:
© 2012 Weatherford. All rights reserved.
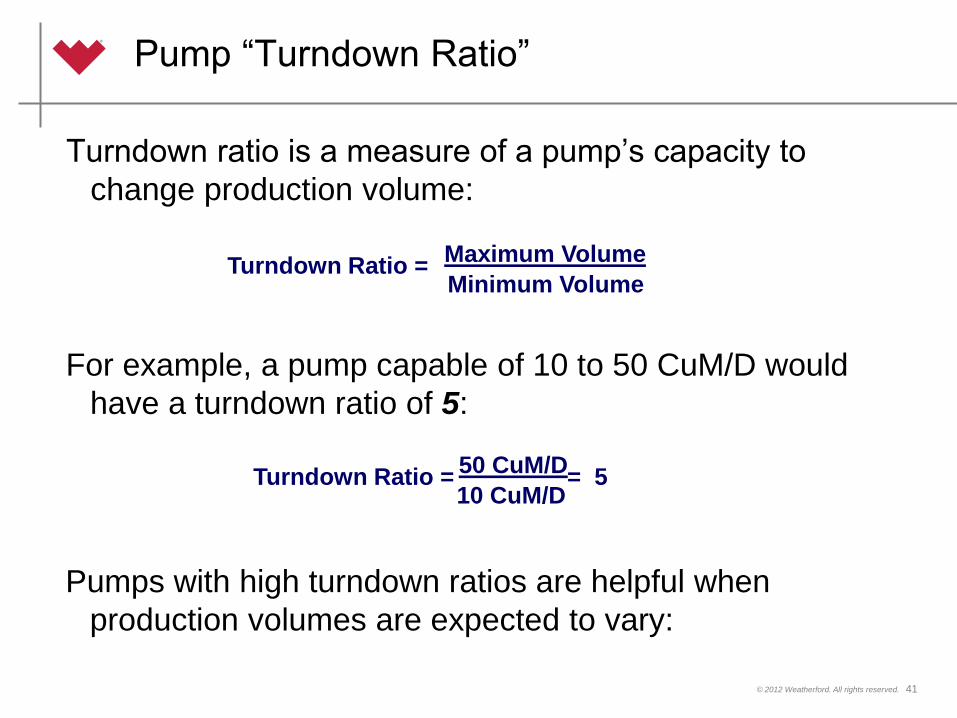
Pump “Turndown Ratio”
Turndown ratio is a measure of a pump’s capacity to
change production volume:
41
Turndown Ratio = Maximum Volume
Minimum Volume
For example, a pump capable of 10 to 50 CuM/D would
have a turndown ratio of 5:
Turndown Ratio = = 5 50 CuM/D
10 CuM/D
Pumps with high turndown ratios are helpful when
production volumes are expected to vary:

© 2012 Weatherford. All rights reserved.
42
Questions?


