What a Difference a Plan Makes Master Planning and Realignment of Marinas Pacific Coast Congress April 13, 2006 Julie Bassuk, AICP, partner, MAKERS Paul Sorensen, principal, BST Associates architecture urban design
Transcript
What a Difference a Plan MakesMaster Planning and Realignment of Marinas
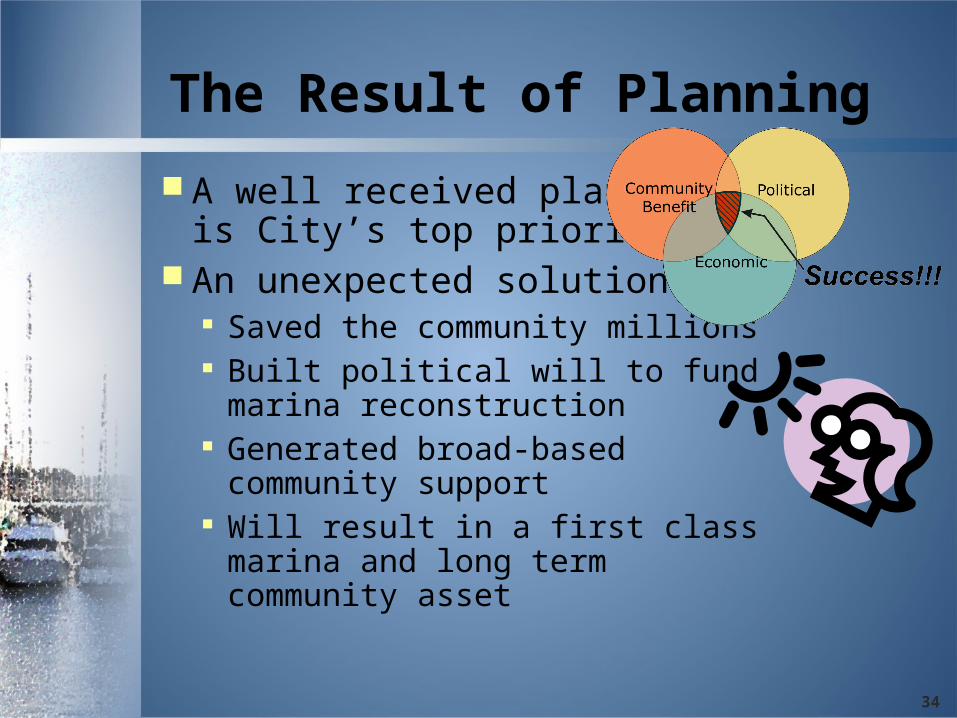
Oak Harbor Marina Master Plan An unexpected solution
Saved the community millions Built political will to fund marina reconstruction Generated broad-based community support Will result in a first class marina & long term
community asset
4
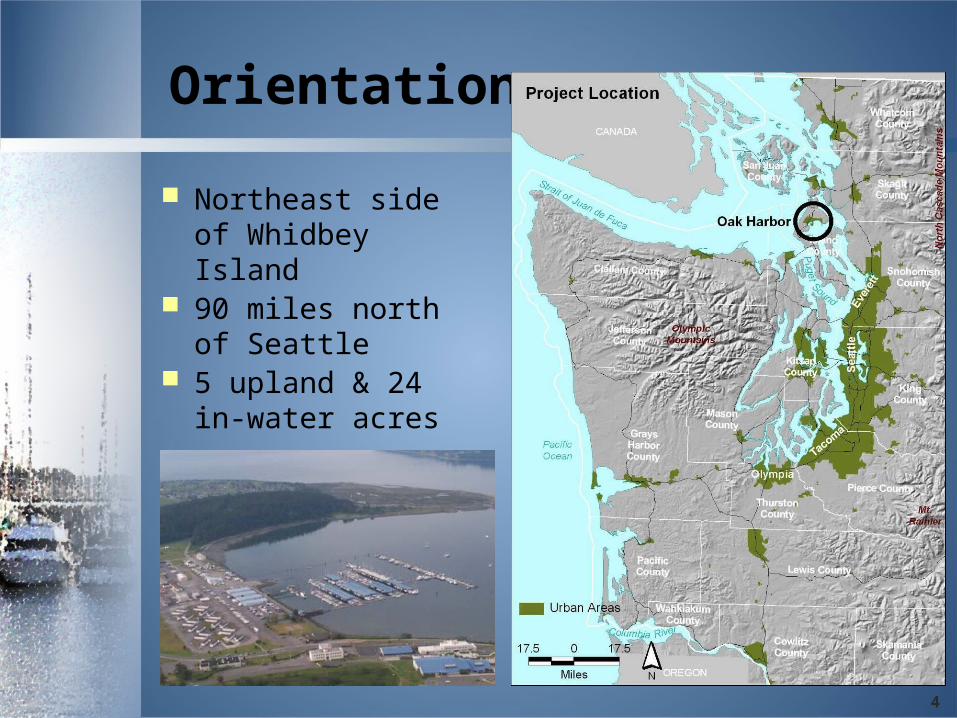
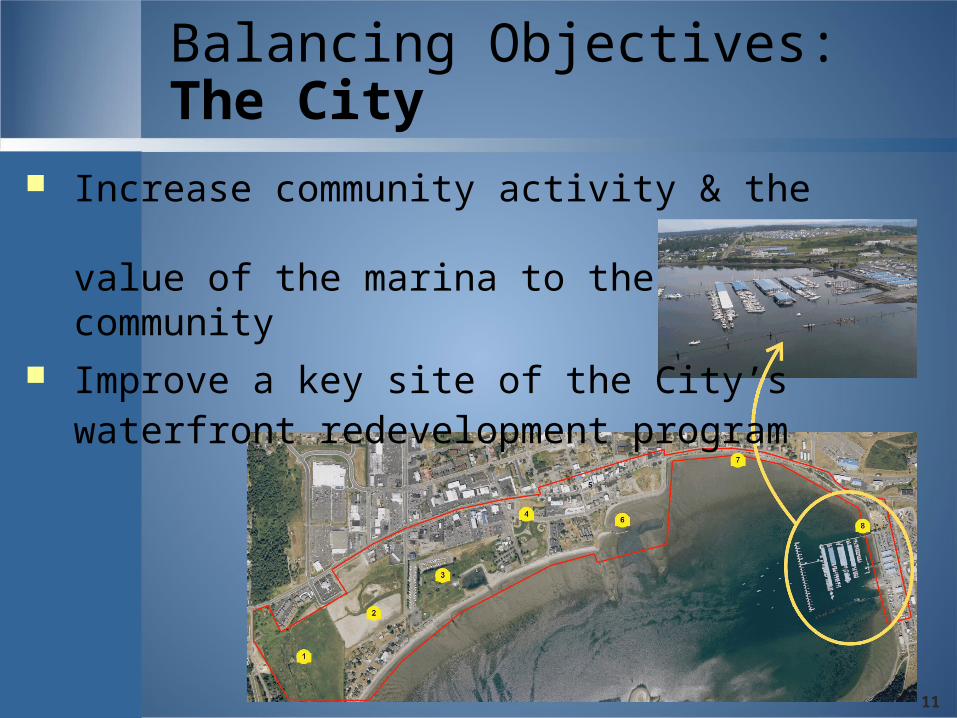
Orientation
Northeast side of Whidbey Island
90 miles north of Seattle
5 upland & 24 in-water acres
5
History
Formerly a Navy base & seaplane ramp Site transferred to City of Oak Harbor Marina built in 1974 with the promise
that no City funding would be used Dave Williams, a former Air Station
maintenance expense & vacancies Spending less now means spending more
later Building fewer slips reduces bond capacity Eliminating covered moorage & public facilities
reduces costs, but, does not meet tenant needs & reduces community benefits
Building a solely market-based slip mix does not accommodate many existing tenants
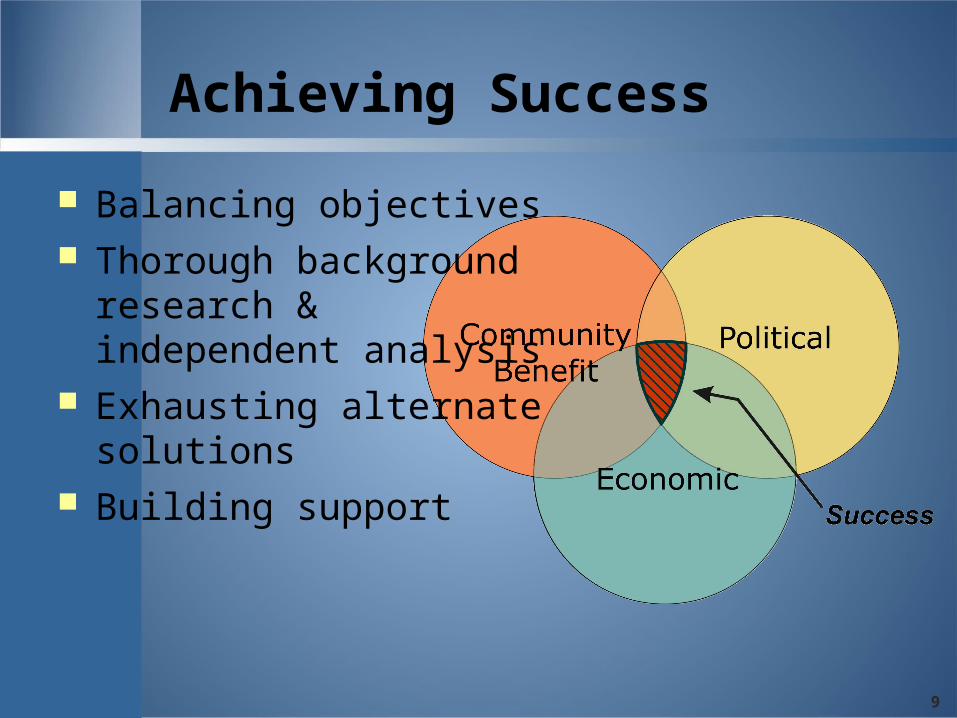
Exhausting Alternative Solutions
24
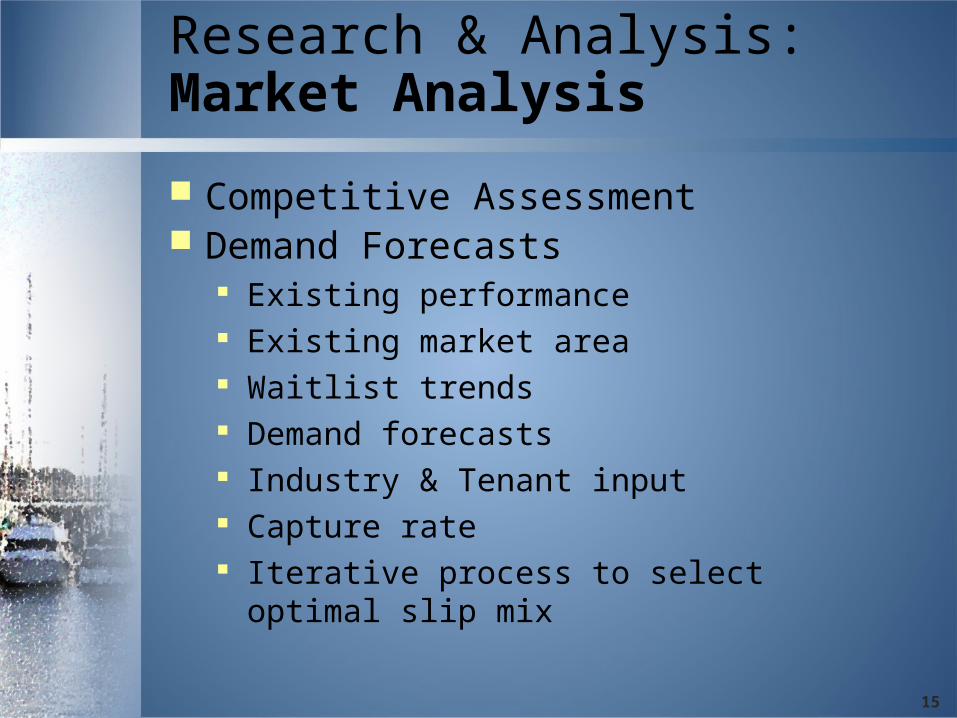
Research & Analysis: Developing a Recommended Slip Mix
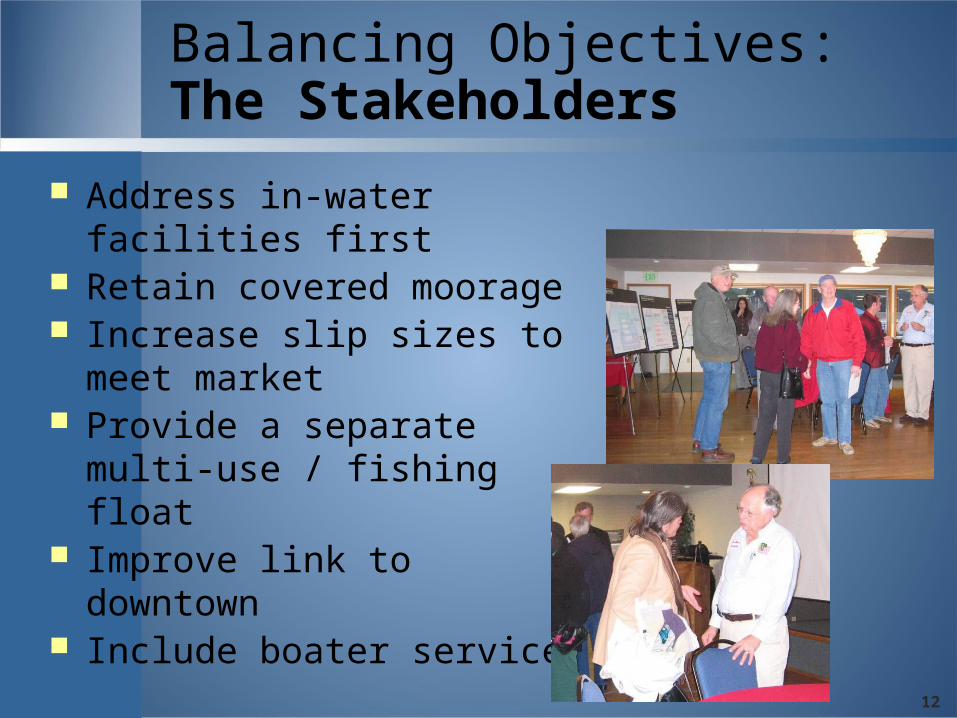
Market analysis, existing tenant profile, and stakeholder input used to develop a recommended slip mix
covered slips
total slips
25
Summary: Existing In-Water Facilities Issues
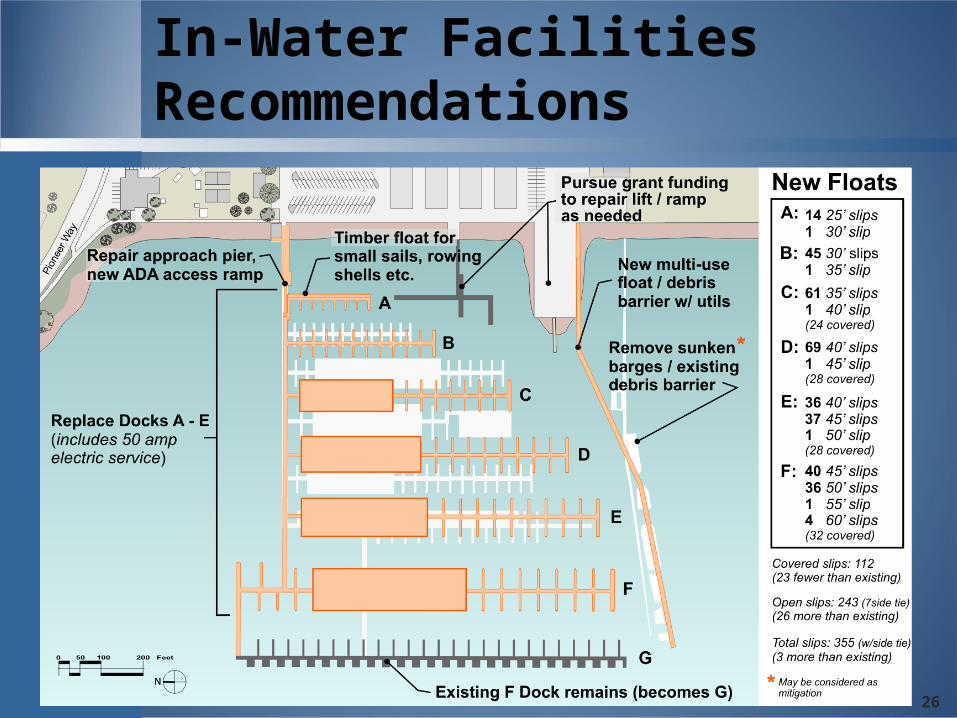
26
In-Water Facilities Recommendations
27
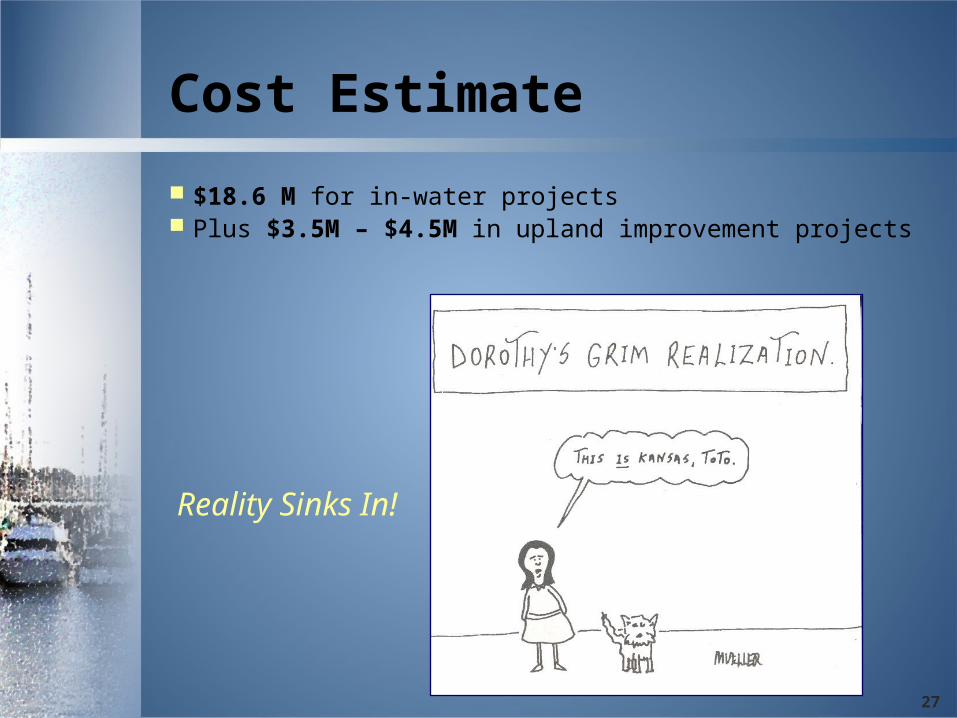
Cost Estimate
$18.6 M for in-water projects Plus $3.5M – $4.5M in upland improvement projects
Reality Sinks In!
28
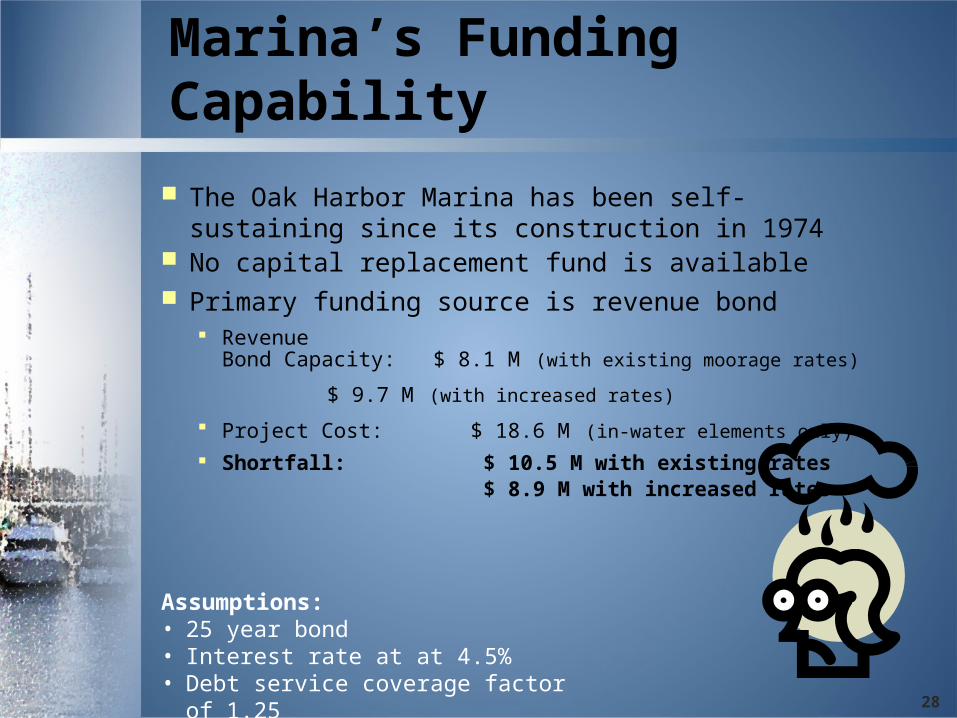
The Oak Harbor Marina has been self-sustaining since its construction in 1974
No capital replacement fund is available Primary funding source is revenue bond
RevenueBond Capacity: $ 8.1 M (with existing moorage rates)
$ 9.7 M (with increased rates)
Project Cost: $ 18.6 M (in-water elements only) Shortfall: $ 10.5 M with existing rates
$ 8.9 M with increased ratesAssumptions: • 25 year bond• Interest rate at at 4.5% • Debt service coverage factor of 1.25
Marina’s Funding Capability
29
Building Support
To make finding additional funds a City priority, the Team:
Emphasized community benefits & meeting of City goals Minimized costs where possible Identified potential additional funding sources Focused on the positive
Effective communication is
critical!
30
New slip mix generates approx. $5.2 M per year in direct revenue = $156 M in revenue over 30 years
Includes public access elements Supports community programs Creates a signature waterfront destination
* Estimate based on surveys of permanent and transient boaters conducted in 2005
Building Support:Community Benefit
31
Builds in a single construction phase Pursues partial grant funding Eliminates “band-aid” costs Reduces dredge volume by accounting for varying
vessel drafts (power boats vs. sail boats) Allows for clamshell dredge (vs. hydraulic) Removes creosote piles and sunken barges (debris
barrier), which may also be considered as mitigation
Building Support:Minimizing Costs
32
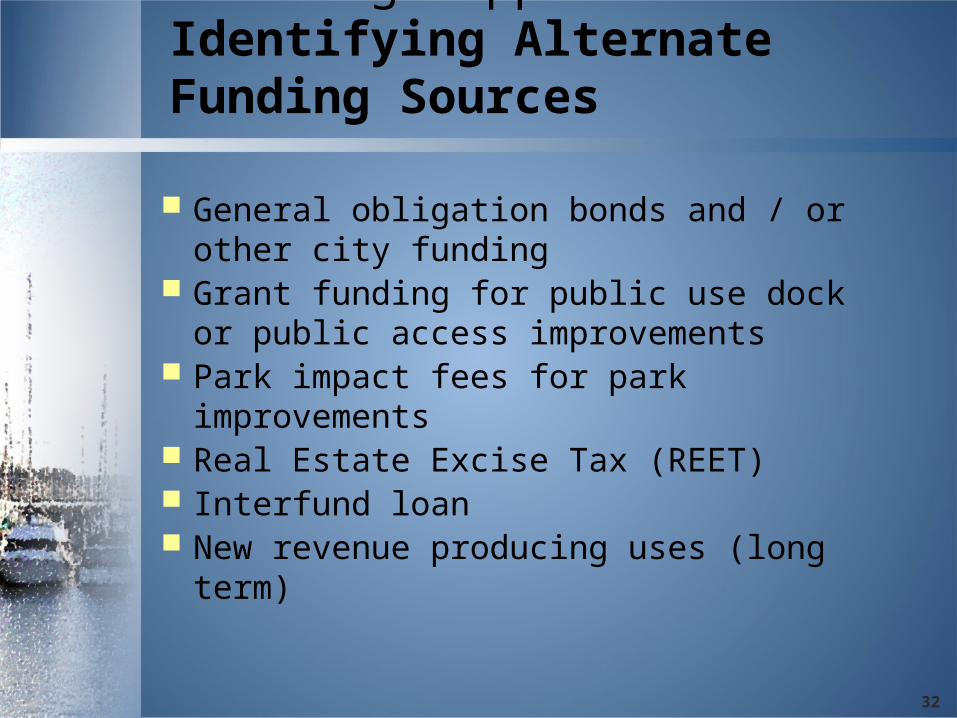
General obligation bonds and / or other city funding Grant funding for public use dock or public access
improvements Park impact fees for park improvements Real Estate Excise Tax (REET) Interfund loan New revenue producing uses (long term)
Building Support:Identifying Alternate Funding Sources
33
Building Support:Focus on the Positive
Generates approx. $5.2 M per year in direct revenue Improves the waterfront per the City’s plans Ensures the marina
remains an asset Meets market
demand Minimizes cost Builds a quality
facility Benefits the
community
34
The Result of Planning
A well received plan thatis City’s top priority
An unexpected solution that Saved the community millions Built political will to fund marina