Date post: | 19-Dec-2015 |
Category: |
Documents |
View: | 218 times |
Download: | 3 times |
What are the Economic Impacts on What are the Economic Impacts on Communities as They Change from Communities as They Change from
Black to Latino?Black to Latino?
Terra BennettTerra BennettSandra Kim Sandra Kim Michael ParkMichael Park
Economics 116Economics 116Professor ConradProfessor Conrad
5/02/055/02/05
Current ContextCurrent Context
Los Angeles Mayor Elections
• Highlights the tension between the Latino and Black communities
• Addresses the economic situation of the city and the perceived different interests of the two communities
Economic & Sociological TheoriesEconomic & Sociological Theories
Theories• Living Arrangements of
Latino Immigrants
• Job Searching Methods
• Ethnic Economy (food service and retail trade)
Predicted Effects• Higher rent
• Higher employment rate• Greater concentration in
low-wage jobs
• Higher rate of entrepreneurship
Economic ChangesEconomic Changes
• Total population in both cities is increased, driven primarily by the growing Latino population
• Inglewood experienced more dramatic change in industries of employment than Compton
• Median Household Income experienced dramatic changes over the past 30 years– Between 1990 and 2000, both communities’
medians lost most of the gain made between 1980 and 1990
Factors for Increased Latino Factors for Increased Latino ImmigrationImmigration
• Amendment to Immigration and Nationality Act in 1965
• Globalization: Latin America experienced great political and economic turmoil (1980 – 1990)
• Many immigrants and refugees arrived as uneducated and low skill workers
Economic Restructuring in LAEconomic Restructuring in LA
• 75,000 Manufacturing jobs lost (1970)• Decreased government funding for anti-poverty
and jobs programs in urban areas (1970)• Decreased funding social services (1970-2000)• Increased the perception and reality of
competition among minority groups as low-wage earners
• Business owners in urban areas left due to increasing fear of riots and urban unrest
Economic & Sociological TheoriesEconomic & Sociological Theories
• Living Arrangements of Latino Immigrants
• Job Searching Methods
• Ethnic Economy
Living Arrangements of Latino Living Arrangements of Latino ImmigrantsImmigrants
Tendency for extended family to live together • Cultural hypothesis: Reflection of traditional family patterns
brought from the home country• Economic resource hypothesis: Individuals with the fewest
economic resources will be the most likely to live in extended arrangements
• Life-course hypothesis: Living arrangements reflect the varying constraints and needs of life-course events and stages
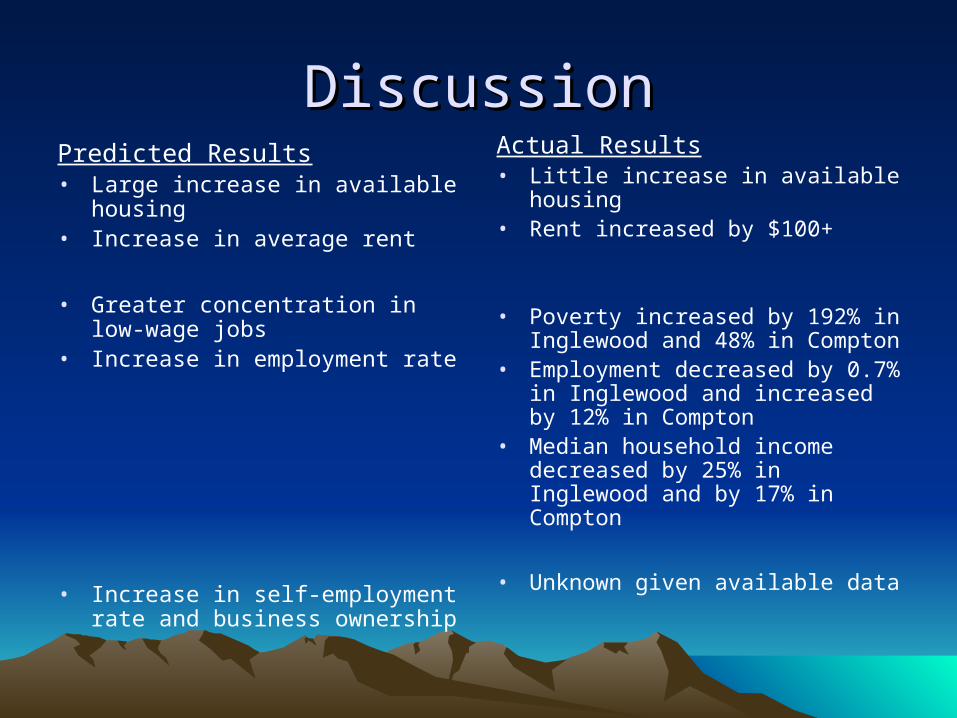
Predicted effect on the community:• Immigrants initially move into undesired areas with lower rents,
such predominantly lower-income black communities• Able to pay higher rents due to the multiple people contributing to
it• Overtime, this increases housing prices
Job Searching MethodsJob Searching MethodsLatino immigrants and their immigrant social network
• Tend to use friends, family, neighbors, and inside referrers to acquire jobs and develop highly localized and densely connected employment networks
• Reduce information costs in the job search • More willing to accept any job they can get quickly due to lack of
English, education, and papersBlack residents
• More likely to rely on third-parties outside of the local neighborhood and immediate ethnic niches.
• More selective in their job searches and won’t accept jobs with low-wages and bad working conditions because they are citizens, know their rights, and have access to welfare and unemployment benefits
Predicted effect on the community• Predominant jobs are increasingly characterized by lower wages
and worse working conditions • Higher employment rate
Ethnic EconomyEthnic Economy
Primarily in the food service and retail trade– Benefits
• Easier to get a job in ethnic stores• Protect from discrimination
– Costs• Not linked to social mobility• Longer commute times with lower wages• Relegate individuals to menial jobs and enforce a linguistic
isolation that obstructs advancement
Predicted effect on the community• Higher rates of self-employment and of business
ownership
Economic ChangeEconomic Change
• Population Change• Types of Housing
Units• Medium Household
Gross Rent• Medium Household
Income
• Poverty Rate• Employment Rate• Labor Force
Participation Rate• Unemployment• Employment
Residents by Industry
Population by Race/EthnicityPopulation by Race/Ethnicity
Inglewood
0
20,000
40,000
60,000
80,000
100,000
120,000
1965 1970 1975 1980 1985 1990 1995 2000 2005
Time
Population
White
Black
Other Races
Total Hispanic
Everyone
Compton
0
20,000
40,000
60,000
80,000
100,000
120,000
1965 1970 1975 1980 1985 1990 1995 2000 2005
Time
Population
White
Black
Other Races
Total Hispanic
Everyone
Housing Units by Occupancy Housing Units by Occupancy StatusStatus
Inglewood
0
5,000
10,000
15,000
20,000
25,000
30,000
35,000
40,000
45,000
1965 1970 1975 1980 1985 1990 1995 2000 2005
Time
Population
Total Units
Occupied Units
owner occupied
Renter Occupied
Vacant Units
Compton
0
5,000
10,000
15,000
20,000
25,000
30,000
35,000
40,000
45,000
1965 1970 1975 1980 1985 1990 1995 2000 2005
Time
Population
Total Units
Occupied Units
Owner Occupied
Renter Occupied
Vacant Units
Median Household Gross RentMedian Household Gross Rentin 1999 dollarsin 1999 dollars
Inglewood
$0
$100
$200
$300
$400
$500
$600
$700
$800
$900
1965 1970 1975 1980 1985 1990 1995 2000 2005
Time
Dollars
Compton
$0
$100
$200
$300
$400
$500
$600
$700
$800
$900
1965 1970 1975 1980 1985 1990 1995 2000 2005
Time
Dollars
Median Household Income in 1999 Median Household Income in 1999 DollarsDollars
Inglewood
$30,000
$32,000
$34,000
$36,000
$38,000
$40,000
$42,000
1965 1970 1975 1980 1985 1990 1995 2000 2005
Time
Dollars
Compton
$30,000
$32,000
$34,000
$36,000
$38,000
$40,000
$42,000
1965 1970 1975 1980 1985 1990 1995 2000 2005
Time
Dollars
Poverty RatePoverty Rate
Compton
0
5
10
15
20
25
30
35
40
45
50
1965 1970 1975 1980 1985 1990 1995 2000 2005
Time
Percent
Inglewood
0
5
10
15
20
25
30
35
40
45
50
1965 1970 1975 1980 1985 1990 1995 2000 2005
Time
Percent
Employment & Labor Force Employment & Labor Force Participation RateParticipation Rate
Inglewood
0
10,000
20,000
30,000
40,000
50,000
60,000
1965 1970 1975 1980 1985 1990 1995 2000 2005
Time
Population
Labor Force
Employed Residents
Compton
0
10,000
20,000
30,000
40,000
50,000
60,000
1965 1970 1975 1980 1985 1990 1995 2000 2005
Time
Population
Labor Force
Employed Residents
Unemployment RateUnemployment Rate
Compton
0
2
4
6
8
10
12
14
16
1965 1970 1975 1980 1985 1990 1995 2000 2005
Time
Percent
Inglewood
0
2
4
6
8
10
12
14
16
1965 1970 1975 1980 1985 1990 1995 2000 2005
Time
Percent
Employed Residents by IndustryEmployed Residents by Industry
Inglewood
0
2,000
4,000
6,000
8,000
10,000
12,000
14,000
1960 1970 1980 1990 2000 2010
Time
Population
Manufacturing
Wholesale and RetailTrade
Professional Services
TransportationCommunication andPublic Utilities
Finance Insurance andReal Estate
Public Administration
Business and RepairServices
Personal Services
Construction
Agriculture and Mining
Compton
0
5
10
15
20
25
30
35
40
1960 1970 1980 1990 2000 2010
Time
Percent
Manufacturing
Professional Services
Wholesale and RetailTrade
TransportationCommunication andPublic Utilities
Construction
Personal Services
Business and RepairServices
Public administration
Finance Insurance andReal Estate
Agriculture and Mining
DiscussionDiscussionPredicted Results• Large increase in available
housing• Increase in average rent
• Greater concentration in low-wage jobs
• Increase in employment rate
• Increase in self-employment rate and business ownership
Actual Results• Little increase in available housing• Rent increased by $100+
• Poverty increased by 192% in Inglewood and 48% in Compton
• Employment decreased by 0.7% in Inglewood and increased by 12% in Compton
• Median household income decreased by 25% in Inglewood and by 17% in Compton
• Unknown given available data
Further ResearchFurther Research
• Evidence on the topic is inconclusive• Race-Specific data needs augmentation
for this type of research• Qualitative research is necessary,
including site visits and interviews• Though most immigration occurred
between 1980 and 1990, the time period, 1990-2000, witnessed severe economic fluctuations and warrants further study