64
What do Border Rejections tell us about Trade Standards Compliance of Developing Countries? Analysis of EU and US Data 2002-2008 UNIDO Working Paper
What do Border Rejections tell us about Trade Standards Compliance of Developing Countries?
Analysis of EU and US Data 2002-2008
UNIDO Working Paper

Disclaimer: This document has been produced without formal United Nations editing. The designations employed and the presentation of the mate-rial in this document do not imply the expression of any opinion whatsoever on the part of the Secretariat of the United Nations Industrial Development Organization (UNIDO) concerning the legal status of any country, territory, city or area or of its authorities, or concerning the delimitation of its frontiers or boundaries, or its economic system or degree of development. Designations such as “developed”, “industri-alized” and “developing” are intended for statistical convenience and do not necessarily express a judgment about the stage reached by a particular country or area in the development process. Mention of firm names or commercial products does not constitute an endorsement by UNIDO.
This document represents work in progress and is intended to generate comment and discussion. It is not a fully polished publication. The views expressed herein are those of the author(s) and do not necessarily reflect the views of the United Nations Industrial Development Organization.
The opinions, statistical data and estimates contained in signed articles are the responsibility of the author(s) and should not necessarily be considered as reflecting the views or bearing the endorsement of UNIDO. Although great care has been taken to maintain the accuracy of information herein, neither UNIDO nor its Member States assume any responsibility for consequences which may arise from the use of the material.
The full report as well as a digital copy of this Working Paper can be downloaded from: www.unido.org/tradestandardscompliance
For comments and feedback, kindly contact us at: [email protected]
Cover photo: Wikipedia, under the GNU Free Documentation License, size 459x344 pixel, MIME-Type: image/jpeg, Author: Marc.Jetzkowitz
What do Border Rejections tell us about Trade Standards Compliance of Developing Countries?
Analysis of EU and US Data 2002-2008
UNIDO Working PaperPrepared by Spencer Henson and Edward Olale
Contents
Acronyms
Executive Summary
What do Border Rejections tell us about Trade Standards Compliance of Developing Countries? 1
1. Introduction 1
2. Indicators of compliance-related trade problems 2
3. Measures of border rejections in the EU and the US 3
4. Analysis of total rejections 8
5. Analysis by product group 17
5.1 Fish and fishery products 17
5.2 Fruits and vegetables and fruit and vegetable products 24
5.3 Nuts and seeds and nut and seed products 31
5.4 Herbs and spices 38
6. Comparative analysis of rejections in EU and US markets 45
7. Further analysis 52
8. References 53
Country abbreviations 54

Acronyms
APHIS Animal and Plant Health and Inspection Service (US)DG SANCO Directorate General for Health and Consumers (EC)EC European CommissionEU European UnionFAO Food and Agriculture OrganizationFDA Food and Drugs Administration (US)FD&C Federal Food, Drug and Cosmetic Act (US)FSIS Food Safety Inspection ServiceGAO Government Accountability Office (US)HACCP Hazard analysis and critical control pointIDS Institute of Development StudiesIPPC International Plant Protection ConventionOASIS Operational and Administrative System for Import Support (US FDA system)OECD Organisation for Economic Co-operation and DevelopmentOIE World Organization for Animal HealthPRA Pest Risk AssessmentRASFF Rapid Alert System for Food and Feed (EU)RRRI Relative Rejection Rate IndicatorSPS Sanitary and phytosanitary measuresUNIDO United Nations Industrial Development OrganizationUSDA US Department of Agriculture
Executive Summary
UNIDO and IDS launched in 2010 the Trade Standards Compliance Report (TSCR), a cooperation to provide developing countries, technical assistance agencies and donors with a policy making support tool. The TSCR enables them to make better informed deci-sions on where to concentrate their development efforts in the area of trade-related capacity-building, in particular with respect to the compliance with trade standards. A core element of the related research is the analysis of major international markets’ border rejections of agri-food products originating from developing countries. The TSCR further estimates related export losses and pro-vides indications where technical assistance is best allocated.
The analysis of border rejections was undertaken for the US and EU markets based on unprecedented access to data granted by the US Food and Drug Administration (FDA) and the European Commission Directorate General for Health and Consumers (DG SANCO). The wealth of innovative analysis and interesting findings, including for specific commodity groups (i.e. fish and fishery products, fruit and vegetables, nuts and seeds, as well as herbs and spices) and across both markets, however, went beyond the scope of the TSCR. UNIDO and IDS therefore decided to separately publish the present working paper to make the full analysis available.
Examining EU and US border rejection data indeed generates a rich set of findings and insights. Most importantly, patterns and trends in border rejections clearly point to the sectors and products where the real compliance challenges lie for developing coun-tries. They also reveal the reasons for missed trade opportunities for developing countries when exporting their products to either the EU or the US or even to both markets.
The paper finds that there are significant differences in the patterns of rejections between the EU and the US, reflecting both pat-terns of trade and distinct food safety and other requirements as well as associated systems of enforcement. While EU rejections have been dominated by products that contravene restrictions on levels of mycotoxins, in the US non-compliance with labelling and company/process registration requirements has been the prevalent cause of rejections.
The analysis also reveals that the vast majority of border rejections, both of all agri-food products and of particular commodities, are accounted for by a relatively small number of countries. Some countries have high rates of rejection in both the EU and US, and for all or most of the commodities they export, suggesting systemic weaknesses in compliance capacities. This is true, for instance, for India and China. Other countries face significant border rejection rates for exports to particular markets and/or for particular commodities only, suggesting weaknesses in certain value chains or with specific food safety controls. Examples include exports to the EU of nuts from Iran and fish and fishery products from China and Thailand. There are, however, also a number of countries that have had a good compliance performance in both the EU and the US and across most (if not all) of the agri-food commodities they export. Among them are many of the major exporters of agri-food products like Chile, Argentina, Ecuador and South Africa.
While the crude numbers of border rejections are perhaps most headline-grabbing, it is more informative to examine and consider how rates of rejections vary across countries and commodities and over time for particular countries. On the one hand, such pat-terns and trends serve to highlight where particular countries perform relatively well or badly, compared to competitors and peer groups, in their degree of compliance with regulatory requirements in export markets. This Working Paper presents a summary measure of relative rates of border rejections, the Relative Rejection Rate Indicator (RRRI), which facilitates such comparisons. On the other hand, the rejection analysis undertaken in this paper also gives an indication of how compliance challenges change over time, perhaps as investments are made in particular areas of capacity and/or in response to particular compliance problems.
Overall, border rejections provide a useful rough indicator of key trade standards compliance challenges in the developing world. Future work will aim both to validate the patterns and trends revealed by the rejection data and to explain these patterns and trends. A particular focus of this work will be on relating rejections to the status of compliance capacity of exporting countries. It is envisaged that this further analysis, with in-depth case studies, will allow for compliance performance to be benchmarked across developing countries, thus providing the basis for informed policy decision-making on capacity-building investment at both supply-side and quality infrastructure levels.

1EU and US Border Rejection Analysis
1. Introduction
Concerns about the challenges that developing countries face in complying with food safety, quality and other requirements in industrialised country markets, whether laid down by technical regulations or by standards, are well documented (see, for ex-ample, World Bank, 2005; Caswell and Bach, 2007). While there is a growing body of evidence that supports such concerns, predominantly this comes from a relatively disparate collec-tion of case studies and econometric analyses. Indeed, existing empirical studies largely fail to provide a consistent basis on which to compare the nature and level of compliance challenges across countries and/or to monitor changes in the compliance challenges faced by particular countries over time. Their utility is to provide evidence that problems exist rather than to guide the setting of priorities for trade capacity-building and/or to support impact assessment of capacity-building investments, which require more broad-based indicators of trade-related compliance performance.
In the search for a consistent set of data to explore patterns of compliance across developing countries and/or trends in com-pliance by particular countries over time, considerable attention has been given to border rejections of agri-food products in ma-jor industrialised country markets (for an example of an applica-tion see Ababouch et al., 2005). Given that these records relate to specific and actual instances of non-conformity that result in a consignment being refused entry, intuitively they can be used to identify specific areas where developing countries face problems across export markets, products and areas of compli-ance. Some analysts have gone further and inferred the value of rejected consignments (see, for example, Jaffee and Henson, 2004; Diaz Rios and Jaffee, 2008). In interpreting these data, however, attention needs to be given to the underlying systems of border inspection and the instances of non-compliance that the data include/exclude. It is all too easy to over-interpret the data.
This report presents a comprehensive analysis of border rejec-tion data for the European Union (EU) and United States (US). This analysis aims to:
Derive and assess alternative measures of non-compliance from border rejection data;
Identify broad patterns in border rejections across develop-ing countries, food product exports and areas of non-com-pliance;
Identify trends in the compliance performance of develop-ing countries, including broad groups of countries by in-come and individual countries, over time.
While the analysis has value in and of itself, a more general and important objective is to explore the utility of border rejection data for assessing compliance performance in agri-food product trade and to provide themes that require further analysis.
What do Border Rejections tell us about Trade Standards Compliance of Developing Countries?
Analysis of EU and US Data 2002-2008

2 UNIDO Working Paper
2. Indicators of compliance-related trade problemsIn identifying the compliance challenges faced by developing countries in international trade, the challenge is to relate spe-cific weaknesses in compliance capacity to the ability to meet food safety, quality and other requirements in export markets. In practice, we rarely have a complete data set to accomplish this task; for example, assessments of compliance capacity are often undertaken in isolation from analyses of specific trade problems and/or longer-term trends in export flows. As a result, we are almost inevitably forced to ‘piece together’ sometimes disparate evidence and infer inter-relationships that may be somewhat tenuous. That having been said, there is a growing body of data that can conceivably be used to throw some light on the status of compliance capacity in developing countries and the consequences for export performance, if used with care.
Henson and Masakure (2009) distinguish between three broad indicators of trade-related compliance performance for agri-food products (Figure 1). Although this taxonomy is defined with sanitary and phytosanitary (SPS) measures as its main focus, it can quite easily be extended to compliance issues more gener-ally, for example those relating to labelling requirements and/or social and environmental standards:
Capacity-based indicators focus directly on weaknesses in SPS controls, either in the broad areas of food safety, animal health and plant health, or with respect to particular SPS control functions, for example laboratory capacity. Standard capacity assessment instruments have been developed by FAO (FAO, 2006), OIE (OIE, 2008) and the IPPC (FAO, 2005) for this purpose that effectively benchmark national capac-ity to international norms. This group of indicators does not, however, explicitly relate weaknesses in compliance capac-ity to trade problems and/or export performance.
Compliance-based indicators focus on evidence of non-compliance with SPS requirements in export and/or domes-tic markets. Examples include inspection reports, such as those undertaken to assess the efficacy of veterinary con-trols in developing countries by the European Commission, and official lists of approved countries and/or exporters maintained by importing countries, such as those main-tained by the US Animal and Plant Health and Inspection Service (APHIS) for imports of animal and plant products.
Typically, these indicators are based on a relatively objec-tive assessment of capacity, for example in the form of an audit schedule or pest risk assessment (PRA). The focus of such indicators is on system compliance, whether through the value chain for particular products or official systems of SPS control.
Trade-based indicators provide ex post evidence that trade is impeded due to non-compliance with export market SPS requirements. The focus of such indicators is on the compli-ance of products. Examples include data on import rejec-tions (for example as is available for the EU and the US), analysis of trade flows, administrative actions in importing countries (for example bans), reports from exporters of im-port problems, etc. A key challenge with some of these indi-cators, however, is isolating the impact of SPS compliance issues from other trade impediments.
In principle, many of the compliance- and trade-based indi-cators in Figure 1 are available for developing countries that already engage in trade with major industrialised countries. However, these data are not always publicly available and even when they are accessible there has been only limited systemat-ic analysis across countries and/or time. While capacity-based indicators exist for many developing countries, predominantly these remain ad hoc and, at least until recently, have employed inconsistent methods. The initiatives of FAO, OIE and IPPC in establishing a common framework for such assessments is a major improvement in this regard.
Both the compliance and trade-based indicators in Figure 1 are generally absent for countries that do not have established exports of a particular commodity but may have aspirations to commence export. Thus, for example, rejection data is only created when a product consignment is exported and fails an instance of border inspection. While capacity-based indica-tors may be available for such cases, it can be difficult to re-late these to potential export performance; latent exports can be constrained by a multitude of factors, including weaknesses in transport infrastructure, production inefficiencies and lack of SPS capacity. Thus, care must be taken not to over-attribute la-tent exports to SPS issues.
Looking across the possible indicators of trade-related compli-ance performance in Figure 1, rejection data are evidently the most comprehensive of those available at the current time. These data are captured and assembled on a systematic basis by most industrialised countries and are available at a relatively disaggregated level across agri-food products and time. Sub-ject to the limitations and provisos detailed in Section 3 below, these data permit patterns and trends in compliance-related trade problems to be identified across countries and products and through time. Thus, for example, rejection data have been employed in a number of previous studies of food safety compli-ance in international trade (Allshouse et al., 2003; Ababouch et al., 2005; Buzby et al., 2008; Buzby and Regmi, 2009; Jaud et al., 2009). The analysis presented below uses rejection data for both the EU and the US. In so doing, it aims to establish a series of measures that can be used to monitor the trade-related com-pliance performance of developing countries over time, both in aggregate and for exports of particular agri-food products, and across export markets.
Figure 1. Categories of indicators of SPS capacity building needs
Type of Assessment Examples of Indicators
Capacity-basedBenchmarking
Ad hoc capacity assessments
Compliance-basedInspection reports
Approved import lists
Trade-based
Import rejections
Trade flow trends and disruptions
Administrative actions in import markets
Reports of trade problems from exporters
Exporter and/or importer interviews and surveys
Ad hoc problem reports/questionnaires

3EU and US Border Rejection Analysis
3. Measures of border rejections in the EU and the USBoth the EU and the US have systems for collecting and collating data on rejections of imports of agricultural and food products. Both systems provide data on import consignments that are re-fused entry because they are judged not to conform to regula-tory requirements. A record is provided for each consignment that details the commodity, port of entry where the inspection was undertaken, country of origin, reason for the rejection and date of rejection. Various other data may be recorded, includ-ing the name and/or address of the exporter and the volume of the consignment, although these are often not made publically available for reasons of confidentiality.
The EU’s Rapid Alert System for Food and Feed (RASFF) provides a platform for the exchange of information between Member States on measures taken in response to food and feed prod-ucts that pose an immediate risk to human health, both in the EU internal market and with respect to imports from Third Coun-tries. All EU Member States plus Norway, Liechtenstein and Ice-land are members of the RASFF. Members are required to make a notification through the RASFF of1:
Immediate measures aimed at preventing products being placed on the market, forcing the withdrawal of products from the market or the recall of products in order to protect human health;
Recommendations or agreements with suppliers of prod-ucts, whether voluntary or obligatory, laying down condi-tions on the placing on the market or the use of products that pose a serious risk to human health;
Border rejections of product consignments that pose a di-rect or indirect risk to human health.
The first two of these scenarios relate to so-called ‘market noti-fications’: products on the EU’s internal market that are found to pose an immediate risk to human health. The third scenario relates to products that are the subject of a border rejection and never enter the EU, but rather are sent back to the country of origin, destroyed or diverted to another destination.
In the analysis below, the major focus is on border rejections since this is the main mechanism through which controls are exerted on imports of food and feed products from Third Coun-tries. However, included in the data are a relatively small num-ber of market notifications. In principle, these instances could be removed from the data so that the focus is entirely on border rejections. In so doing, however, information would be lost on cases of non-compliance. The reference below to ‘border rejec-tions’ therefore encompasses all forms of notifications to which food and feed imports from Third Countries are subject over the period 2002 to 2008.
In recent years, EU border rejections of food and feed products have increased appreciably, predominantly reflecting growth in the rate of rejections rather than growth in the volume of food and feed imports. Thus, over the period 2002 to 2008, whilst the number of notifications increased by 110 per cent (Figure 2) the volume of food and feed imports expanded by only 49
1 See Regulation (EC) No. 178/2002.
per cent. Predominantly, this reflects an appreciable increase in the number of rejections over the period to 2005, since when the numbers have stabilised. On the basis of the information available, it is not possible to say whether this trend reflects higher rates of border inspection (as no data are available on this) and/or lower rates of compliance.
Table 1 details the number of EU rejections of food and feed product imports by commodity and origin. Over the period 2002 to 2008, nuts, nut products and seeds, fish and fishery products, fruit and vegetables and herbs and spices accounted for 74 per cent of the total rejections, with nuts, nut products and seeds alone accounting for 35 per cent. There were nota-ble trends in the number of notifications over this period, for example increased rejections of nuts, nut products and seeds and food contact materials, and reduced rejections of fish and fishery products, some of which are discussed below.2
Of the total rejections of food and feed product imports to the EU over the period 2002 to 2008, lower middle-income and upper middle-income countries accounted for 54 per cent and 27 per cent, respectively. Developing countries as a whole ac-counted for 89 per cent of rejections. Over this same period, up-per middle-income countries accounted for 41 per cent of food and feed imports and lower middle-income countries for 25 per cent. Developing countries as a whole accounted for 72 per cent of food and feed imports. The fact that lower middle-income countries accounted for a significantly greater proportion of re-jections than of food and feed imports provides an initial indi-cation that these countries have faced considerable challenges in complying with EU food safety requirements relative to other country income groups. In contrast, upper middle-income coun-tries recorded rejections that were low relative to the level of food and feed imports, suggesting relatively good compliance performance.
The US Food and Drugs Administration (FDA) is responsible for controls on imports of pharmaceuticals, medical devices, cosmetics and food products, with the exception of meat and poultry and meat and poultry products.3 Data on border rejec-
2 Note that data for commodities with low rates of rejection should be treated with caution. They generally reflect limited and often sporadic incidences of non-conformity within the context of a large overall num-ber of inspections and rejections.3 Regulation of meat and poultry and meat and poultry products is the responsibility of the Food Safety Inspection Service (FSIS) of the US De-partment of Agriculture (USDA).
Figure 2. Trend in value of EU imports and number of rejections of food and feed products from Third Countries, 2002-2008

4 UNIDO Working Paper
Table 1. Number of EU rejections of food and feed products from Third Countries by product, 2002-2008
ProductYear
Total2002 2003 2004 2005 2006 2007 2008
Nuts and seeds 244 731 777 858 707 619 744 4,680
Fish and fishery products 396 483 372 417 380 344 288 2,680
Fruits and vegetables 110 166 175 244 258 313 353 1,619
Herbs and spices 26 85 159 230 129 113 88 830
Food contact materials 2 12 28 116 109 151 165 583
Cereals and bakery products 3 13 12 27 140 76 114 385
Poultry meat and poultry meat products 112 73 61 39 7 14 22 328
Meat and meat products 37 75 60 71 28 29 20 320
Confectionery 2 19 28 30 34 47 79 239
Dietetic foods, food supplements, fortified foods 8 9 11 24 52 88 41 233
Honey and royal jelly 41 24 18 38 23 24 30 198
Fats and oils 3 2 76 57 8 22 19 187
Soups, broths and sauces 13 31 39 23 30 22 17 175
Feed for food-producing animals 1 0 0 0 12 70 64 147
Non-alcoholic beverages 3 24 15 14 22 33 28 139
Animal nutrition 21 16 11 36 39 0 0 123
Cocoa and cocoa preparations, coffee and tea 15 7 14 8 26 14 29 113
Pet food 0 0 0 0 16 34 47 97
Prepared dishes and snacks 3 5 11 17 14 6 9 65
Other food products/ mixed foods 1 5 4 8 11 9 10 48
Milk and milk products 4 2 8 7 3 4 10 38
Food additives 2 2 0 1 2 6 6 19
Egg and egg products 0 13 1 0 0 1 3 18
Water for human consumption (other than natural mineral water)
0 0 0 5 5 4 4 18
Natural mineral water 1 0 0 4 4 3 5 17
Alcoholic beverages (other than wine) 1 2 1 2 2 2 1 11
Wine 0 0 3 1 4 2 0 10
Feed additives 0 0 0 0 4 2 3 9
Ices and desserts 0 0 1 0 1 0 4 6
Total 1,049 1,799 1,885 2,277 2,070 2,052 2,203 13,335
tions are available through the Operational and Administrative System for Import Support (OASIS), an automated FDA system for processing and making admissibility determinations for shipments of imported products that come under the jurisdic-tion of the FDA. Prior to 1998, records were kept of all import consignments subject to rejection regardless of whether these were eventually permitted to enter the US. Since that time, only consignments actually refused entry have been recorded, mak-ing the data more directly comparable to those of the RASFF (although see below for certain incompatibilities between the OASIS and RASFF data). The basis on which imports are regu-lated is the Federal Food, Drug and Cosmetic (FD&C) Act that lays down requirements not only for product safety but also for labelling and quality, at least as these relate to adulteration.
Figure 3. Trend in value of US imports and number of rejections of food products, 2002-2008
Note: Excludes meat and poultry and meat and poultry products.

5EU and US Border Rejection Analysis
Over the period 2002 to 2008, the number of rejections of food products by the FDA declined 17 per cent (Figure 3), while im-ports increased 63 per cent. This is in stark contrast to the trend in the number of rejections recorded in the EU, as discussed above. Whilst it is not possible to discern whether this reflects changes in the rate of inspection and/or the rate of non-com-pliance, it should be noted that the US Government Account-ability Office (GAO) has raised concerns that, whilst the regula-tory responsibilities of the FDA in the area of food safety have increased appreciably over time, its funding and staffing have not expanded commensurately (GAO, 2008). Specifically on seafood imports, the GAO has raised concerns about limitations in inspection resources (GAO, 2004). This suggests that rates of border inspection through the 2000s are unlikely to have kept up with the growth in food imports.
Of the total rejections of food products under the FDA’s jurisdic-tion from 2002 to 2008, fruits, vegetables and fruit and vegeta-ble products and fishery/seafood products accounted for 51 per cent (Table 2). However, rejections of these products declined rapidly over this period, accounting for 53 per cent of rejections in 2002 but only 38 per cent in 2008. At the same time, rejec-tions of spices, flavours and salts increased appreciably, from four per cent of rejections in 2002 to 11 per cent in 2008. Sig-nificant increases in rejections were also recorded for chocolate and cocoa products. Note that nuts and edible seeds, the com-modity subject to the highest rate of EU border rejections over the period 2002 to 2008, accounted for less than two per cent of US rejections.
Over the period 2002 to 2008, lower middle-income countries accounted for 33 per cent of rejections but only 21 per cent of imports. As with the EU, this presents an initial indication of high rates of non-compliance relative to other country income groups. Upper middle-income countries accounted for around 31 per cent of US border rejections over the period 2002 to 2008, in line with their share of food imports.
In using rejection data, the intention is to throw some light on the compliance performance of developing countries, indi-vidually and as income sub-groupings. It is necessary from the outset, however, to reflect on how reliable rejection data is for this purpose and, perhaps more importantly, how patterns and trends in rejections should be interpreted. Broadly, EU and US rejection data should be recognised as an imperfect indicator of the compliance problems faced by developing countries, whilst at the same time representing the best data currently available.4
First, it is important to recognise that rejection data tells us noth-ing about the state of capacity in countries that do not export. These countries may have very weak compliance capacity (and perhaps this is the reason they do not export), or, alternatively, very good compliance capacity while not exporting for other reasons (for example, lack of productive capacity and/or high transport costs). Zero exports could also result from prohibi-tions on exports due to persistent non-compliance and/or non-approval of food safety control systems in the exporting country.
Second, border inspections cover a small fraction of total food
4 As recognised by Buzby et al. (2008) in their analysis of US border rejections over the period 1998 to 2004.
imports.5 Further, the RASFF and OASIS data do not record the number of consignments offered for inspection or the number of inspections undertaken. Thus, it is not possible to estimate the share of consignments from any one country or over time that is in non-compliance.
Third, the rate of rejection will reflect the exporting country’s compliance capacity relative to the importing market’s official requirements, which is of interest here. However it will also be influenced by the efforts and attentions of border officials in the importing country, which may vary in a non-random manner across time, products, exporting firms and/or country of origin according to historical rejection rates, administrative priorities in the importing country, etc. Thus, conceivably, enhancements in compliance performance could be accompanied by (but not related to) increases in levels of rejections.
While the crude rejection data reported above provides a broad picture of patterns and trends across products, exporting coun-tries and destination markets, these data also reflect changes in the volumes of exports over time. Thus, in the analysis below, three measures are presented that aim to provide a more com-plete picture of patterns and trends in rates of non-conformity:
1. Aggregate number of rejections: The simple sum of the an-nual number of rejections over the period 2002 to 2008. Increases in the number of rejections can reflect both increases in the volume of exports and in the rate of non-compliance.
2. Unit rejection rate: The number of rejections per US$1 mil-lion of exports over the period 2002 to 2008. This measure takes account of changes in the volume of exports such that it provides a direct measure of the rate of non-compliance. It is presented as a series of three-year moving averages to smooth out often appreciable year-on-year variations.
3. Relative rejection rate: The ratio of country share of total re-jections to share of total imports for the entire period 2002 to 2008. This provides a convenient measure of the perfor-mance of countries relative to one another over the longer term. Thus, a country whose share of rejections is less/more than its share of imports is defined as a relatively good/bad performer in terms of rates of non-conformity. These data can be presented graphically (using a logarithmic scale) or presented numerically.
The fact that rejection data for both the EU and the US are avail-able potentially permits comparison of compliance performance at the country and products levels. However, strictly speaking, the RASFF and OASIS data are not directly comparable in that their coverage is somewhat different across products and the basis on which non-compliance is assessed, notably:
The RASFF data provide information on rejections of all food and feed products, while the OASIS data exclude meat and poultry and meat and poultry products. This is not consid-ered a particularly significant issue since rejections of meat and poultry and meat and poultry products only account for five per cent of EU rejections. Further, exports of these
5 It is estimated that only about one per cent of US food imports were subject to FDA inspection in the 2000 financial year (GAO, 2001).

6 UNIDO Working Paper
products are insignificant for all but a very small number of developing countries.
The RASFF data provides data on border rejections that are related predominantly to non-compliance with food safety requirements. Conversely, the OASIS data includes rejec-tions due to non-compliance with a range of quality and la-belling requirements.
In most cases, the RASFF data record a single reason for the rejection of a particular product consignment, whereas mul-tiple reasons are typically recorded in the OASIS data. Either the OASIS data provide a more complete record of the ar-
eas in which a particular consignment is in non-conformity, or the definitions of non-conformity are more specific than those of the RASFF.
The ways in which commodities are categorised differ be-tween the RASFF and OASIS data. In some cases, however, it is possible to rearrange the data to define broadly compara-ble commodity groupings and this has been undertaken for the four commodity groups analysed in detail below.
The RASFF data include some limited instances of market notifications as well as border rejections. The OASIS data, however, are restricted to border rejections.
Table 2. Number of US rejections of food products by product, 2002-2008
ProductYear
Total2002 2003 2004 2005 2006 2007 2008
Fruits and vegetables 3,182 2,800 3,397 3,074 2,660 2,721 1,624 19,458
Fish and fishery products 2,205 2,062 2,196 1,860 1,606 1,731 1,290 12,950
Confectionery without chocolate/chewing gum 592 580 499 678 717 596 633 4,295
Spices, flavours and salts 409 381 443 398 490 632 844 3,597
Bakery products/dough/mix/icing 445 402 592 610 495 486 481 3,511
Multi-food dinner/gravy/sauce 414 436 347 300 299 350 428 2,574
Soft drink/water 293 369 315 273 287 334 388 2,259
Cheese/cheese products 350 379 492 244 195 248 201 2,109
Chocolate/cocoa products 202 148 148 153 154 217 545 1,567
Snack food items 123 97 227 191 271 178 190 1,277
Macaroni/noodle products 413 229 129 96 107 86 118 1,178
Dressings/condiments 137 141 125 142 147 246 165 1,103
Milk/butter/dried milk products 254 252 182 115 91 124 77 1,095
Nuts/edible seed 136 158 168 146 204 158 73 1,043
Whole grain/milled grain products/starch 178 86 109 108 151 157 100 889
Beverage bases/concentrates/nectar 115 121 113 119 101 89 55 713
Coffee/tea 98 50 75 76 81 82 111 573
Soup 189 105 75 42 67 43 51 572
Food sweeteners 74 78 63 49 79 73 70 486
Dietary convenience foods/ meal replacements 39 84 59 56 54 46 37 375
Gelatin/rennet/pudding mix/pie filling 99 38 32 50 44 30 56 349
Vegetable oils 43 44 49 42 39 43 26 286
Cereal preparations/breakfast food 32 41 36 28 30 20 17 204
Food additives (human use) 26 51 18 25 25 18 21 184
Baby food products 35 16 33 26 14 24 10 158
Ice cream products 14 34 10 11 14 23 15 121
Colour additive food/drug/cosmetic 10 16 8 4 13 55 10 116
Alcoholic beverages 7 7 63 7 4 19 4 111
Meat, meat products and poultry 21 17 27 15 18 8 4 110
Vegetable protein products 28 4 4 10 4 18 4 72
Filled milk/milk products 8 16 11 2 9 2 9 57
Egg/egg products 2 8 24 2 3 0 9 48
Prepared salad products 4 3 9 9 4 1 3 33
Total 10,177 9,253 10,078 8,961 8,477 8,858 7,669 63,473

7EU and US Border Rejection Analysis
While recognising the distinct features of the RASFF and OA-SIS data, it is possible to discern distinct features of rates of rejection in the EU and the US which need to be recognised in interpreting patterns at the more disaggregated level. First, the overall unit rejection rate, the number of rejections per US$1 million of imports, was consistently greater in the US than the EU over the period 2002 to 2008 (Figure 4). While the US unit rejection rate declined from 2002 to 2008, from 0.217 to 0.089, it remained five times greater than the EU unit rejection rate in 2008 of 0.015 detentions per US$1 million of agri-food imports. Second, the unit rejection rate varied significantly across food commodity groups (Figure 5).6 In the EU, the highest unit rejec-tion rate was for nuts and seeds and herbs and spices, with much lower rates for fruits and vegetables and fish and fishery products. For all commodities, with the one exception of nuts and edible seeds, the unit rejection rate was appreciably higher in the US. By far, herbs and spices had the highest unit rejection rate in the US, whilst nuts and edible seeds had the lowest rate.
In both the EU and the US, a relatively small number of coun-tries accounted for the majority of border rejections over the period 2002 to 2008, both in aggregate and for particular food commodities. Table 3 presents five (CR5) and ten (CR10) country concentration ratios for the aggregate number of rejections over this period.7 For example, ten countries accounted for 69 per cent of the total rejections of EU food and feed product imports, and 60 per cent of US rejections. In the case of nuts and edible
6 Here the focus is on four commodity groups that account for a substan- ve propor on of developing country agri-food exports to the EU and the
US, namely: 1) fi sh and fi shery products; 2) fruits and vegetables; 3) nuts and edible seeds; and 4) herbs and spices.7 The concentra on ra o shows the propor on of rejec ons accounted for by the fi ve or ten countries with the largest number of rejec ons.
seeds, five countries accounted for 78 per cent and 58 per cent of rejections in the EU and the US, respectively. Across all com-modities, with the exception of fish and fishery products, five countries accounted for over half of EU or US rejections.
Before proceeding to the more disaggregated analysis, it is im-portant to provide further words of caution about the interpreta-tion of the rejection data, notably as a measure of rates of non-conformity with food safety and other requirements in the EU and the US. At best, rates of rejection provide a crude and par-tial picture of the compliance difficulties faced by developing countries with agri-food product exports. While the patterns and trends discussed below provide a broad picture of where prob-lems exist and how the scale of problems differs across coun-tries and changes over time, in terms of compliance challenges they evidently represent the ‘tip of the iceberg’. Thus, the data in effect provide observations of specific instances where an ex-porter attempts to gain access to EU or US markets and where these fail due to non-conformity with official requirements that are enforced through border inspection. The data tell us noth-ing, for example, about exporters that choose not to export be-cause of real or perceived weaknesses in compliance capacity. At the same time, care must be taken not to over-interpret the data. The focus should be on broader patterns and trends rather than the very wide scatter of small numbers of rejections which arguably provide ‘noise’ rather than indicate concrete compli-ance concerns.
Figure 5. Unit rejection rate for selected food commodity im-ports to the EU and the US, 2002-2008
Note: EU rejection rate converted at current exchange rate.
Figure 4. Trend in unit rejection rate for food imports to the EU and the US, 2002-2008
Note: EU rejection rate converted to US$ at respective average annual exchange rate.
Table 3. Five and ten country concentration ratios for EU and US rejections by product
RecipientConcentration
RatioTotal Food
Fruits and Vegetables
FishNuts and Edible
SeedsHerbs and Spices
EUCR5 51.2 67.5 46.9 78.4 61.0
CR10 69.6 75.9 63.3 90.3 78.8
USCR5 42.8 56.5 46.4 58.1 68.2
CR10 60.3 67.7 66.1 72.5 78.8
8 UNIDO Working Paper
4. Analysis of total rejections
To provide a broad picture of compliance challenges with agri-food exports to the EU and the US, we first focus on total rejec-tions over the period 2002 to 2008. As noted above, these data reflect both the volume of exports from particular countries to the EU/US and the rate of non-compliance. In turn the rate of non-compliance can reflect such factors as the state of compli-ance capacity in the exporting country, the products exported (for example whether they are high or low risk with respect to food safety) and the regulatory regime in place for these prod-ucts in the importing country.
In both the EU and the US, a relatively small number of countries accounted for the majority of rejections (Tables 4 and 5). China and India had high levels of rejections in both the EU and the US. Other countries, for example Iran, Turkey and the Dominican Republic, had a large number of rejections in either the EU or US, but not both. It is notable that some industrialised countries also had large numbers of rejections. Thus, the US was in the top five countries by number of rejections in the EU, and the UK and Canada were amongst the six countries with the greatest number of rejections in the US.
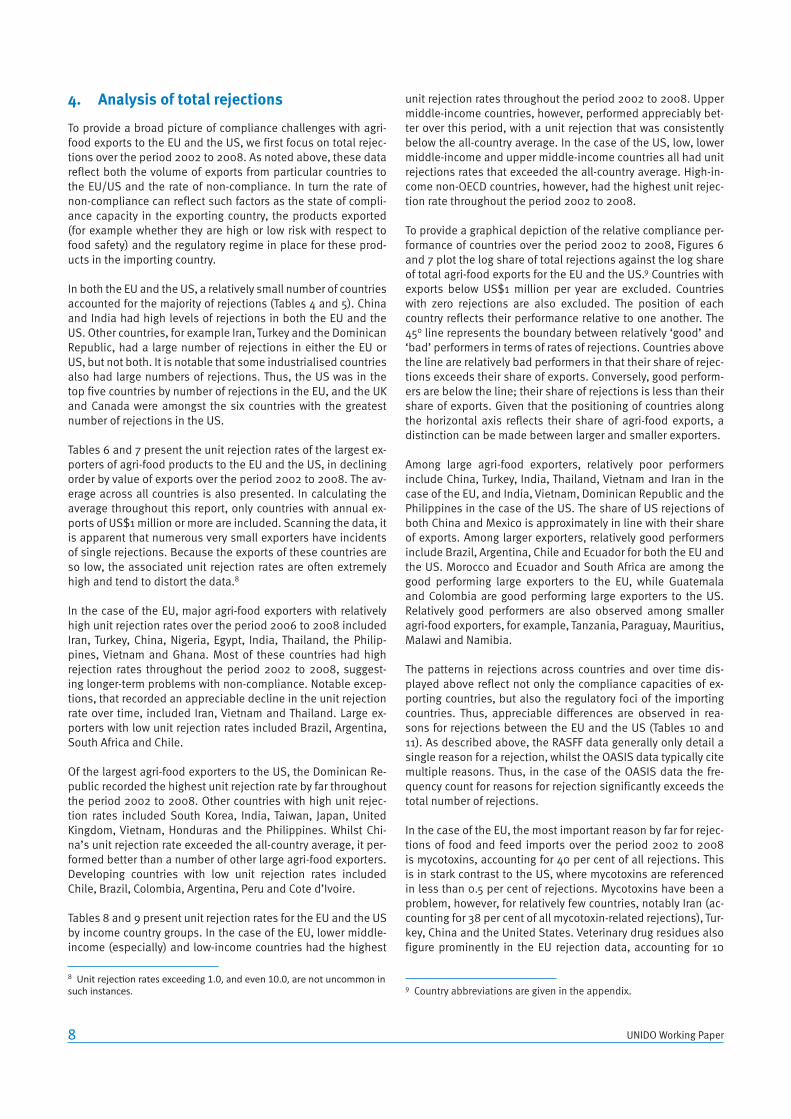
Tables 6 and 7 present the unit rejection rates of the largest ex-porters of agri-food products to the EU and the US, in declining order by value of exports over the period 2002 to 2008. The av-erage across all countries is also presented. In calculating the average throughout this report, only countries with annual ex-ports of US$1 million or more are included. Scanning the data, it is apparent that numerous very small exporters have incidents of single rejections. Because the exports of these countries are so low, the associated unit rejection rates are often extremely high and tend to distort the data.8
In the case of the EU, major agri-food exporters with relatively high unit rejection rates over the period 2006 to 2008 included Iran, Turkey, China, Nigeria, Egypt, India, Thailand, the Philip-pines, Vietnam and Ghana. Most of these countries had high rejection rates throughout the period 2002 to 2008, suggest-ing longer-term problems with non-compliance. Notable excep-tions, that recorded an appreciable decline in the unit rejection rate over time, included Iran, Vietnam and Thailand. Large ex-porters with low unit rejection rates included Brazil, Argentina, South Africa and Chile.
Of the largest agri-food exporters to the US, the Dominican Re-public recorded the highest unit rejection rate by far throughout the period 2002 to 2008. Other countries with high unit rejec-tion rates included South Korea, India, Taiwan, Japan, United Kingdom, Vietnam, Honduras and the Philippines. Whilst Chi-na’s unit rejection rate exceeded the all-country average, it per-formed better than a number of other large agri-food exporters. Developing countries with low unit rejection rates included Chile, Brazil, Colombia, Argentina, Peru and Cote d’Ivoire.
Tables 8 and 9 present unit rejection rates for the EU and the US by income country groups. In the case of the EU, lower middle-income (especially) and low-income countries had the highest
8 Unit rejec on rates exceeding 1.0, and even 10.0, are not uncommon in such instances.
unit rejection rates throughout the period 2002 to 2008. Upper middle-income countries, however, performed appreciably bet-ter over this period, with a unit rejection that was consistently below the all-country average. In the case of the US, low, lower middle-income and upper middle-income countries all had unit rejections rates that exceeded the all-country average. High-in-come non-OECD countries, however, had the highest unit rejec-tion rate throughout the period 2002 to 2008.
To provide a graphical depiction of the relative compliance per-formance of countries over the period 2002 to 2008, Figures 6 and 7 plot the log share of total rejections against the log share of total agri-food exports for the EU and the US.9 Countries with exports below US$1 million per year are excluded. Countries with zero rejections are also excluded. The position of each country reflects their performance relative to one another. The 45o line represents the boundary between relatively ‘good’ and ‘bad’ performers in terms of rates of rejections. Countries above the line are relatively bad performers in that their share of rejec-tions exceeds their share of exports. Conversely, good perform-ers are below the line; their share of rejections is less than their share of exports. Given that the positioning of countries along the horizontal axis reflects their share of agri-food exports, a distinction can be made between larger and smaller exporters.
Among large agri-food exporters, relatively poor performers include China, Turkey, India, Thailand, Vietnam and Iran in the case of the EU, and India, Vietnam, Dominican Republic and the Philippines in the case of the US. The share of US rejections of both China and Mexico is approximately in line with their share of exports. Among larger exporters, relatively good performers include Brazil, Argentina, Chile and Ecuador for both the EU and the US. Morocco and Ecuador and South Africa are among the good performing large exporters to the EU, while Guatemala and Colombia are good performing large exporters to the US. Relatively good performers are also observed among smaller agri-food exporters, for example, Tanzania, Paraguay, Mauritius, Malawi and Namibia.
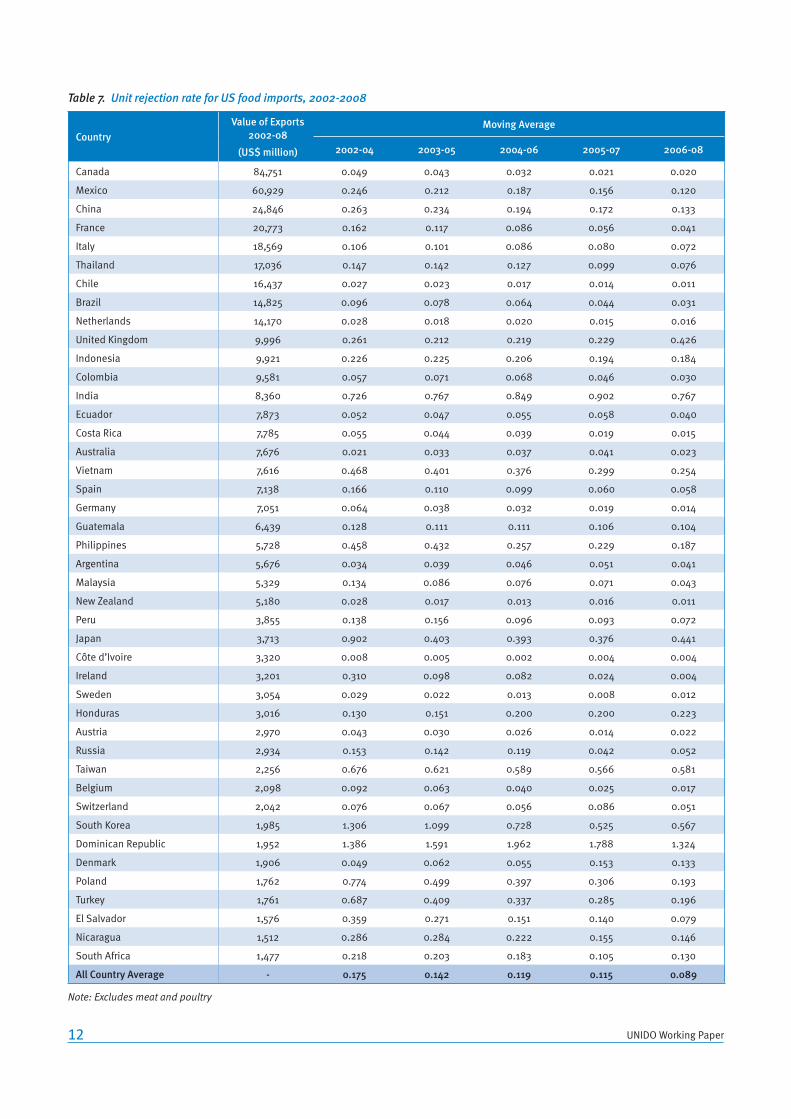
The patterns in rejections across countries and over time dis-played above reflect not only the compliance capacities of ex-porting countries, but also the regulatory foci of the importing countries. Thus, appreciable differences are observed in rea-sons for rejections between the EU and the US (Tables 10 and 11). As described above, the RASFF data generally only detail a single reason for a rejection, whilst the OASIS data typically cite multiple reasons. Thus, in the case of the OASIS data the fre-quency count for reasons for rejection significantly exceeds the total number of rejections.
In the case of the EU, the most important reason by far for rejec-tions of food and feed imports over the period 2002 to 2008 is mycotoxins, accounting for 40 per cent of all rejections. This is in stark contrast to the US, where mycotoxins are referenced in less than 0.5 per cent of rejections. Mycotoxins have been a problem, however, for relatively few countries, notably Iran (ac-counting for 38 per cent of all mycotoxin-related rejections), Tur-key, China and the United States. Veterinary drug residues also figure prominently in the EU rejection data, accounting for 10
9 Country abbreviations are given in the appendix.

9EU and US Border Rejection Analysis
Table 4. Number of EU rejections of food and feed products from Third Countries, 2002-2008
CountryYear
TotalAnnual Average 2002 2003 2004 2005 2006 2007 2008
Iran 63 492 491 470 243 130 172 2,061 294.4
China 149 133 158 253 262 354 498 1,807 258.1
Turkey 141 200 180 198 250 294 302 1,565 223.6
India 60 119 110 137 86 111 157 780 111.4
United States 25 53 52 74 231 184 144 763 109.0
Thailand 143 85 45 117 85 92 103 670 95.7
Brazil 102 116 109 124 91 58 61 661 94.4
Vietnam 67 35 56 124 68 44 55 449 64.1
Argentina 11 42 46 57 75 47 58 336 48.0
Indonesia 39 36 70 58 43 25 14 285 40.7
Ghana 1 8 78 59 44 31 23 244 34.9
Egypt 9 40 33 24 30 35 48 219 31.3
Nigeria 1 7 15 30 28 49 25 155 22.1
Hong Kong 2 4 6 31 29 45 25 142 20.3
Bangladesh 11 18 18 25 29 15 22 138 19.7
Ukraine 13 0 6 20 18 40 36 133 19.0
Pakistan 7 12 14 25 19 28 27 132 18.9
Morocco 17 29 9 15 23 22 11 126 18.0
Malaysia 14 34 23 8 13 22 8 122 17.4
Philippines 4 18 6 14 41 13 23 119 17.0
Chile 9 28 20 14 8 18 8 105 15.0
Russia 8 3 10 34 25 15 10 105 15.0
Singapore 5 54 19 1 7 10 5 101 14.4
Tunisia 5 3 11 17 7 16 33 92 13.1
Sri Lanka 6 4 14 5 9 22 23 83 11.9
Australia 2 4 6 25 17 14 12 80 11.4
Taiwan 5 36 13 1 5 5 15 80 11.4
Somalia 13 17 12 11 7 8 7 75 10.7
Lebanon 2 9 9 5 8 19 17 69 9.9
Ecuador 11 14 16 3 5 7 8 64 9.1
South Korea 3 4 16 19 11 3 7 63 9.0
Senegal 4 12 3 8 6 13 10 56 8.0
Israel 4 4 9 9 10 5 14 55 7.9
Other 93 126 202 262 237 258 222 1,400 200.0
Total 1,049 1,799 1,885 2,277 2,070 2,052 2,203 13,335 1,905.0

10 UNIDO Working Paper
Table 5. Number of US rejections of food products, 2002-2008
CountryYear
TotalAnnual Average 2002 2003 2004 2005 2006 2007 2008
Mexico 1,804 1,502 1,581 1,735 1,477 1,270 1,066 11,926 1490.7
India 746 725 871 1,026 1,132 1,113 707 7,223 902.9
China 541 667 616 672 664 740 479 5,005 625.6
United Kingdom 377 288 325 245 369 430 1,262 3,767 470.9
Dominican Republic 263 266 535 415 663 512 77 3,121 390.1
Canada 414 543 551 284 246 238 361 3,014 376.7
Vietnam 428 332 478 350 300 378 306 2,939 367.4
Japan 755 241 192 147 285 203 319 2,448 306
Indonesia 138 269 331 214 313 374 250 2,159 269.9
Thailand 280 258 351 307 216 233 212 2,122 265.3
France 461 365 345 223 159 155 113 2,081 260.1
South Korea 297 344 285 205 112 166 287 1,938 242.3
Philippines 203 456 248 214 135 244 168 1,906 238.3
Italy 197 226 252 245 175 287 223 1,834 229.3
Taiwan 244 180 183 210 165 173 272 1,631 203.9
Poland 259 129 121 117 58 59 40 895 111.9
Brazil 125 118 153 118 122 84 61 893 111.6
Pakistan 113 116 106 114 90 129 61 833 104.1
Guatemala 107 91 87 98 109 100 126 821 102.6
Spain 172 93 160 58 78 62 64 785 98.1
Turkey 180 101 84 82 70 83 28 718 89.7
Honduras 38 46 57 76 122 73 134 624 78
Bangladesh 30 22 188 98 50 67 42 568 71
Sri Lanka 84 71 28 32 89 109 29 505 63.1
Colombia 26 47 119 102 54 50 41 502 62.7
China 99 64 33 70 44 51 53 473 59.1
Peru 23 71 45 70 29 75 67 434 54.3
Ecuador 75 26 51 72 59 74 15 425 53.1
Israel 40 52 106 33 19 43 60 403 50.4
Ireland 230 19 68 29 1 4 1 402 50.3
Egypt 49 54 62 48 41 66 28 398 49.7
Syria 32 74 23 45 74 82 14 393 49.1
Lebanon 61 53 67 51 31 45 32 389 48.6
Malaysia 63 26 38 68 35 60 46 384 48
Nicaragua 25 37 77 32 15 65 45 338 42.3
Ghana 56 40 70 55 39 12 17 330 41.3
Netherlands 65 34 58 14 48 36 24 319 39.9
Chile 45 60 45 34 35 43 16 318 39.7
Jamaica 31 38 40 45 35 23 30 277 34.6
South Africa 29 39 55 27 37 11 43 275 34.4
El Salvador 44 56 14 47 25 31 22 273 34.1
Russia 22 44 83 13 31 18 28 273 34.1
Costa Rica 45 36 73 17 33 19 9 265 33.1
Ukraine 17 91 37 32 25 20 10 265 33.1
Other 844 843 786 772 568 748 381 5,648 706.0
Total 10,177 9,253 10,078 8,961 8,477 8,858 7,669 72,541 9,067.6
Note: Excludes meat and poultry.

11EU and US Border Rejection Analysis
Table 6. Unit rejection rate for EU food and feed imports from Third Countries, 2002-2008
CountryValue of Exports
2002-08
(US$ million)
Moving Average
2002-04 2003-05 2004-06 2005-07 2006-08
Brazil 85,254 0.012 0.011 0.010 0.008 0.005
United States 58,836 0.006 0.008 0.015 0.019 0.020
Argentina 49,291 0.006 0.009 0.010 0.009 0.007
China 28,370 0.061 0.058 0.059 0.062 0.064
Norway 23,975 0.002 0.004 0.004 0.003 0.001
Turkey 23,740 0.072 0.065 0.059 0.063 0.067
Switzerland 17,093 0.003 0.003 0.003 0.003 0.002
New Zealand 17,037 0.002 0.002 0.003 0.002 0.002
South Africa 16,810 0.000 0.000 0.000 0.000 0.000
Chile 16,711 0.011 0.011 0.006 0.005 0.004
Indonesia 16,502 0.028 0.028 0.027 0.019 0.011
Thailand 15,512 0.061 0.047 0.043 0.045 0.033
Morocco 14,854 0.012 0.010 0.008 0.009 0.007
Côte d’Ivoire 14,661 0.003 0.003 0.004 0.004 0.004
Canada 14,557 0.002 0.003 0.003 0.004 0.004
India 14,334 0.065 0.074 0.060 0.053 0.043
Ecuador 12,858 0.011 0.008 0.005 0.002 0.003
Colombia 12,432 0.007 0.007 0.003 0.002 0.003
Australia 12,096 0.003 0.007 0.009 0.010 0.008
Malaysia 11,142 0.021 0.017 0.010 0.008 0.007
Vietnam 9,850 0.088 0.078 0.073 0.058 0.026
Costa Rica 9,833 0.000 0.001 0.002 0.003 0.002
Iceland 9,578 0.001 0.001 0.001 0.000 0.000
Ukraine 9,278 0.007 0.010 0.015 0.021 0.017
Israel 8,793 0.006 0.006 0.007 0.006 0.007
Peru 8,507 0.006 0.006 0.004 0.006 0.006
Russia 8,238 0.007 0.017 0.023 0.022 0.012
Kenya 7,480 0.001 0.002 0.002 0.003 0.004
Ghana 7,083 0.031 0.052 0.063 0.044 0.027
Mexico 4,651 0.010 0.012 0.009 0.006 0.003
Tunisia 4,566 0.016 0.017 0.017 0.018 0.021
Philippines 4,167 0.019 0.024 0.036 0.038 0.039
Cameroon 3,814 0.002 0.001 0.001 0.001 0.001
Egypt 3,753 0.081 0.084 0.055 0.046 0.051
Uruguay 3,678 0.011 0.009 0.006 0.008 0.008
Mauritius 3,462 0.002 0.005 0.005 0.006 0.003
Faroe Islands 3,381 0.000 0.000 0.000 0.000 0.000
Nigeria 3,347 0.017 0.036 0.054 0.075 0.069
Croatia 2,944 0.008 0.023 0.026 0.021 0.017
Iran 2,809 0.882 1.231 0.989 0.723 0.432
Papua New Guinea 2,770 0.000 0.001 0.001 0.001 0.001
All Country Average - 0.021 0.024 0.023 0.021 0.018
Note: EU rejection rate converted to US$ at respective average annual exchange rate.
12 UNIDO Working Paper
Table 7. Unit rejection rate for US food imports, 2002-2008
CountryValue of Exports
2002-08
(US$ million)
Moving Average
2002-04 2003-05 2004-06 2005-07 2006-08
Canada 84,751 0.049 0.043 0.032 0.021 0.020
Mexico 60,929 0.246 0.212 0.187 0.156 0.120
China 24,846 0.263 0.234 0.194 0.172 0.133
France 20,773 0.162 0.117 0.086 0.056 0.041
Italy 18,569 0.106 0.101 0.086 0.080 0.072
Thailand 17,036 0.147 0.142 0.127 0.099 0.076
Chile 16,437 0.027 0.023 0.017 0.014 0.011
Brazil 14,825 0.096 0.078 0.064 0.044 0.031
Netherlands 14,170 0.028 0.018 0.020 0.015 0.016
United Kingdom 9,996 0.261 0.212 0.219 0.229 0.426
Indonesia 9,921 0.226 0.225 0.206 0.194 0.184
Colombia 9,581 0.057 0.071 0.068 0.046 0.030
India 8,360 0.726 0.767 0.849 0.902 0.767
Ecuador 7,873 0.052 0.047 0.055 0.058 0.040
Costa Rica 7,785 0.055 0.044 0.039 0.019 0.015
Australia 7,676 0.021 0.033 0.037 0.041 0.023
Vietnam 7,616 0.468 0.401 0.376 0.299 0.254
Spain 7,138 0.166 0.110 0.099 0.060 0.058
Germany 7,051 0.064 0.038 0.032 0.019 0.014
Guatemala 6,439 0.128 0.111 0.111 0.106 0.104
Philippines 5,728 0.458 0.432 0.257 0.229 0.187
Argentina 5,676 0.034 0.039 0.046 0.051 0.041
Malaysia 5,329 0.134 0.086 0.076 0.071 0.043
New Zealand 5,180 0.028 0.017 0.013 0.016 0.011
Peru 3,855 0.138 0.156 0.096 0.093 0.072
Japan 3,713 0.902 0.403 0.393 0.376 0.441
Côte d’Ivoire 3,320 0.008 0.005 0.002 0.004 0.004
Ireland 3,201 0.310 0.098 0.082 0.024 0.004
Sweden 3,054 0.029 0.022 0.013 0.008 0.012
Honduras 3,016 0.130 0.151 0.200 0.200 0.223
Austria 2,970 0.043 0.030 0.026 0.014 0.022
Russia 2,934 0.153 0.142 0.119 0.042 0.052
Taiwan 2,256 0.676 0.621 0.589 0.566 0.581
Belgium 2,098 0.092 0.063 0.040 0.025 0.017
Switzerland 2,042 0.076 0.067 0.056 0.086 0.051
South Korea 1,985 1.306 1.099 0.728 0.525 0.567
Dominican Republic 1,952 1.386 1.591 1.962 1.788 1.324
Denmark 1,906 0.049 0.062 0.055 0.153 0.133
Poland 1,762 0.774 0.499 0.397 0.306 0.193
Turkey 1,761 0.687 0.409 0.337 0.285 0.196
El Salvador 1,576 0.359 0.271 0.151 0.140 0.079
Nicaragua 1,512 0.286 0.284 0.222 0.155 0.146
South Africa 1,477 0.218 0.203 0.183 0.105 0.130
All Country Average - 0.175 0.142 0.119 0.115 0.089
Note: Excludes meat and poultry

13EU and US Border Rejection Analysis
Figure 6. Share of EU rejections versus share of imports for food and feed products from Third Countries, 2002-2008
Note: Includes countries with annual exports of food and feed products of US$1 million or above and with non-zero rejections; converted to US$ at respective average annual exchange rate.
AF
AL
DZ
AO
AR
AM
AW
AU
AZ
BD
BYBE
BOBA
BW
BR
BF
KH
CM
CA
CV
CL
CN
CO
KM
CG
CR
CIHR
CU
DO
CD
EC
EG
SV
ER
ET
FK
FJ
GA
GMGE
GH
GL
GD
GTGN
GY
HTHN
HK
IS
IN
ID
IR
IL
JM
JP
JOKZ
KE
KR
KG
LB
MK
MG
MY
MW
MVML
MR
MU
MX
MD
MN
MA
MZ
MM
NA
NP
NZNI
NG
NO
OM
PK
PS
PA
PG
PYPE
PHRU
RW
SA
SN
ME
RS
SC
SL
SGLK
SD
SR
SZ
CHSY
TW
TZ
TH
TG
TN
TR
AE UG
UA
UY
US
UZ
VE
VN
YE
ZM
ZW
-7
-6
-5
-4
-3
-2
-1
0
1
2
3
4
-7 -6 -5 -4 -3 -2 -1 0 1 2 3 4
Ln Sh
are
of D
eten
tions
Ln Share of Imports
Table 8. Unit rejection rate for EU food and feed imports from Third Countries, 2002-2008
CountryValue of Exports
2002-08
(US$ million)
Moving Average
2002-04 2003-05 2004-06 2005-07 2006-08
Low-income 43,460 0.027 0.033 0.036 0.031 0.021
Lower middle-income 173,365 0.048 0.055 0.049 0.043 0.035
Upper middle-income 276,216 0.015 0.015 0.014 0.013 0.011
High-income OECD 155,652 0.004 0.006 0.009 0.010 0.010
High-income non-OECD 26,408 0.017 0.019 0.013 0.010 0.011
Average - 0.021 0.024 0.023 0.021 0.018
Note: EU rejection rate converted to US$ at respective average annual exchange rate.
Table 9. Unit rejection rate for US food imports, 2002-2008
CountryValue of Exports
2002-08
(US$ million)
Moving Average
2002-04 2003-05 2004-06 2005-07 2006-08
Low-income 13,268 0.382 0.352 0.330 0.257 0.209
Lower middle-income 94,312 0.286 0.271 0.242 0.227 0.188
Upper middle-income 140,041 0.203 0.178 0.159 0.129 0.097
High-income OECD 199,824 0.114 0.084 0.070 0.057 0.062
High-income non-OECD 7,253 0.473 0.438 0.375 0.344 0.331
Average - 0.175 0.142 0.119 0.115 0.089
Note: Excludes meat and poultry.

14 UNIDO Working Paper
per cent of rejections over the period 2002 to 2008. Conversely, veterinary drug residues are referenced in less than two per cent of US rejections.10 While pesticide residues are cited in 11 per cent of US rejections, they account for less than five per cent of EU rejections.
The most frequently referenced reason for US rejections of food imports is contravention of labelling requirements, being asso-ciated with 58 per cent of all rejections. A further 29 per cent of US rejections reference unregistered process/manufacturer; the US requires that manufacturers of certain products (for ex-
10 While this may partly refl ect the absence of meat and poultry and meat and poultry products from the US rejec on data, it should be noted that the majority of EU rejec ons for reasons of veterinary drug residues are fi sh and fi shery products. Thus, this diff erence appears to be more a refl ec on of the dis nct regulatory requirements of the EU and the US.
ample low-acid canned foods) register their process with the FDA). Broadly, the EU does not enforce labelling requirements through border inspection and rates of non-compliance are not recorded in the RASFF data.
In both the EU and the US data, microbiological contamination is widely cited as a reason for rejection of agri-food products, accounting for around 13 per cent of EU rejections and 12 per cent of US rejections. The OASIS data make frequent reference to the broader concept of unsanitary or ‘filthy’, which is cited in 25 per cent of rejections.
Note: Includes countries with annual exports of food and feed products of US$1 million or above and with non- zero rejections. Excludes meat and poultry.
Figure 7. Share of US rejections versus share of imports for food products, 2002-2008
AF
AL
AR
AM
AU
AT
AZ
BS
BD
BB
BE
BZ
BM
BO
BA
BR
BN
BG
VG
KH
CM
CA
CL
CN
CO
CR
CI
HR
CY CZ
DK
DO
ECEG
SV
ET
FJ
FI
FR
PF
GE
DE
GH
GR
GL
GT
GYHT
HN
HK
HUIS
IN
ID
IRIE
IL
IT
JM
JP
JO
KE
KR
LV
LB
LT
MO
MK
MG
MY
MW
MV
MT MH
MU
MX
FM
MD
MA
MZ
MM
NA
NL
NZ
NI
NG
NO
OM
PK
PA
PG
PY
PE
PH
PL
PT
RO
RU
RW
WS
SA
SN
RS
ME
SC
SG
SK
SI
ZAES
LK
PM
VC
SD
SRSE
CH
SY
TW
TZ
TC
TH
TG
TO
TT
TN
TR
AE
UG
GB
UA
UY
UZ
VE
VN
YE
ZW
-7
-6
-5
-4
-3
-2
-1
0
1
2
3
4
-7 -6 -5 -4 -3 -2 -1 0 1 2 3 4
Ln Sh
are
of D
eten
tions
Ln Share of Imports

15EU and US Border Rejection Analysis
Table 10. Reasons for EU rejections of food and feed products from Third Countries, 2002-2008
Country
Iran 2,041 1 0 3 9 0 15 0 1 0 4 0 0 0 0 0 2 0 0 0 0 3 2,079
China 503 89 286 300 139 77 25 229 86 41 45 8 31 26 14 12 20 14 12 3 0 109 2,069
Turkey 983 95 15 30 177 114 153 19 8 0 47 2 2 8 0 2 11 0 2 4 0 20 1,692
India 193 148 179 77 48 139 65 9 5 7 7 3 7 18 1 0 3 0 1 2 0 16 928
United States 340 32 8 18 48 36 5 0 15 206 13 0 43 7 8 4 13 1 7 3 3 26 836
Thailand 20 233 191 47 78 12 111 13 21 0 7 13 18 3 4 0 0 4 2 1 0 25 803
Brazil 178 234 78 29 70 4 12 2 1 1 5 3 3 11 16 6 4 19 3 1 13 22 715
Vietnam 20 147 186 46 26 28 8 1 30 1 3 13 5 5 7 2 0 1 0 1 0 16 546
Argentina 174 78 27 7 15 1 14 1 1 1 2 1 0 12 8 5 0 0 0 0 2 6 355
Indonesia 14 36 72 88 4 37 1 1 0 1 1 44 3 4 1 6 0 0 1 1 0 3 318
Ghana 91 13 0 5 11 101 0 0 8 0 5 0 0 6 6 0 4 4 0 0 0 8 262
Egypt 130 30 2 1 8 23 41 1 1 0 11 0 0 1 2 0 3 0 0 0 0 5 259
Hong Kong 4 6 0 57 19 5 0 57 10 4 1 0 4 3 0 0 1 0 2 0 0 6 179
Nigeria 90 13 0 10 16 18 0 0 1 0 7 0 1 2 2 1 1 0 0 0 0 2 164
Pakistan 56 10 4 3 19 55 1 0 0 0 3 0 0 6 0 0 1 0 0 1 0 1 160
Ukraine 8 22 27 7 6 6 9 0 17 0 23 3 4 5 13 0 2 2 0 1 0 4 159
Bangladesh 9 28 85 2 1 15 2 0 0 0 3 1 0 1 0 0 1 0 0 0 0 0 148
Morocco 5 44 0 15 17 1 30 1 4 0 1 14 0 4 5 1 2 2 1 0 0 0 147
Russia 8 7 9 2 9 65 0 1 5 0 0 0 4 2 7 1 0 6 1 0 0 10 137
Malaysia 6 70 11 2 6 5 1 1 7 0 0 13 0 0 1 0 3 0 0 0 0 3 129
Philippines 24 5 11 5 19 6 0 0 15 0 0 6 1 1 0 0 1 2 0 0 0 29 125
Singapore 11 1 1 89 3 1 0 0 2 1 2 0 3 0 0 0 0 0 0 3 0 0 117
Chile 3 38 16 17 9 3 18 1 1 0 2 1 0 0 2 1 0 1 1 0 0 2 116
Tunisia 1 31 0 8 24 0 1 0 2 0 16 1 0 4 6 2 4 1 0 0 0 6 107
Taiwan 0 0 33 13 4 0 9 24 2 0 0 0 1 0 0 2 0 0 0 0 0 14 102
Other 423 329 86 243 224 233 130 29 49 17 43 89 39 31 56 60 22 10 9 16 1 67 2,206
Total 5,335 1,740 1,327 1,124 1,009 985 651 390 292 280 251 215 169 160 159 105 98 67 42 37 19 403 14,858
% rejections 40.0 13.0 10.0 8.4 7.6 7.4 4.9 2.9 2.2 2.1 1.9 1.6 1.3 1.2 1.2 0.8 0.7 0.5 0.3 0.3 0.1 3.0 -
Note: The reason the count exceeds the number of rejections is because any one rejection can have multiple reasons.
Myc
otox
ins
Mic
robi
olog
ical
con
tam
inan
ts
Vete
rinar
y dr
ug re
sidu
esHe
avy
met
als
Unau
thor
ized
food
add
itive
s
Prod
uct c
ompo
sitio
nPe
stic
ide
resi
dues
Mig
ratio
nIn
dust
rial c
onta
min
ants
GMO
/nov
el fo
odFo
reig
n bo
dies
Biot
oxin
s/co
ntam
inan
tsRa
diat
ion
Org
anol
eptic
Bad
or in
suffi
cien
t con
trol
sPa
rasi
tic in
fest
atio
nLa
belli
ngPa
ckag
ing
Oth
er ch
emic
al c
onta
min
atio
n
Alle
rgen
sFe
ed a
dditi
ves
Not d
eter
min
ed/o
ther
Tota
l
16 UNIDO Working Paper
Table 11. Reasons for US rejections of food products, 2002-2008
Country
Mexico 3,328 475 3,476 1,475 1,328 2,109 16 135 5 27 114 91 14 17 10 14 7 1 8 0 0 12,650
India 3,829 1,246 1,722 1,346 1,532 454 16 48 2 28 0 37 15 38 10 4 4 1 1 0 0 10,333
United Kingdom
5,899 1,228 65 833 40 1 0 5 7 5 13 0 16 2 0 0 0 9 0 1 0 8,124
China 1,266 1,236 1,625 931 290 402 582 45 5 12 7 7 9 11 35 9 1 0 1 3 0 6,477
Canada 2,516 356 548 524 124 254 16 26 0 16 27 33 6 5 0 0 0 3 0 5 0 4,459
Japan 1,124 1,726 279 272 76 4 0 12 4 5 58 0 1 1 2 1 1 0 0 0 0 3,566
Vietnam 798 376 866 285 770 16 172 106 99 2 29 22 0 1 8 0 1 0 1 0 0 3,552
Dominican Republic
117 32 170 8 2 2456 0 4 5 15 0 0 1 0 0 2 0 0 0 0 0 2,812
Italy 1037 1268 215 68 63 10 0 11 0 4 6 1 5 1 0 0 0 0 1 0 0 2,690
South Korea 875 1068 181 299 129 13 0 8 0 7 49 0 2 1 1 0 2 0 0 0 0 2,635
Indonesia 335 347 949 82 600 0 120 56 95 6 2 3 13 0 0 1 0 0 0 0 0 2,609
France 725 561 186 83 541 22 0 16 0 371 0 1 0 0 0 1 0 0 0 0 0 2,507
Taiwan 707 693 398 436 153 14 11 10 42 5 1 2 4 13 5 4 1 1 0 0 0 2,500
Thailand 452 557 846 241 250 64 18 7 10 1 11 2 1 1 5 0 2 0 1 0 0 2,469
Philippines 455 662 624 353 210 10 0 26 43 4 0 3 7 1 3 6 0 0 0 0 0 2,407
Pakistan 589 298 98 150 154 15 0 13 0 7 0 3 5 1 0 3 0 0 0 0 0 1,336
Poland 608 513 19 81 1 55 0 0 0 0 13 0 4 0 0 0 0 1 0 0 1 1,296
Brazil 438 364 151 62 135 27 1 21 1 6 1 0 0 0 0 1 1 0 0 0 0 1,209
Turkey 513 358 67 70 66 17 0 7 0 4 0 11 0 0 0 5 0 2 0 0 0 1,120
Guatemala 521 134 37 52 11 306 0 0 0 4 1 4 8 0 0 0 0 2 0 0 0 1080
Spain 339 418 42 43 16 184 0 9 1 0 1 0 3 1 0 1 1 0 1 0 0 1060
Sri Lanka 464 240 89 80 42 2 0 10 5 1 2 0 0 0 1 1 0 0 0 0 0 937
Honduras 437 69 211 14 161 10 0 3 0 11 0 0 0 0 0 0 0 0 0 0 0 916
Other 9,462 4,015 3,034 1,318 1,200 598 95 232 92 69 72 39 118 15 7 20 18 12 16 1 0 20,433
Total 36,834 18,240 15,898 9,106 7,894 7,043 1,047 810 416 610 407 259 232 109 87 73 39 32 30 10 1 99,177
% rejections 58.0 28.7 25.0 14.3 12.4 11.1 1.6 1.3 0.7 1.0 0.6 0.4 0.4 0.2 0.1 0.1 0.1 0.1 0.0 0.0 0.0 -
Note: The reason the count exceeds the number of rejections is because any one rejection can have multiple reasons.
Labe
lling
Unre
gist
ered
pro
cess
/
man
ufac
ture
rFi
lthy/
unsa
nita
ryUn
auth
oriz
ed fo
od a
dditi
ves
Mic
robi
olog
ical
con
tam
inan
tsPe
stic
ide
resi
dues
Vete
rinar
y dr
ug re
sidu
esPo
ison
ous
Biot
xins
/con
tam
inan
tPr
oduc
t not
app
rove
d/
no im
port
per
mit
HACC
PM
ycot
oxin
sPr
oduc
t com
posi
tion
Fore
ign
bodi
esO
ther
chem
ical
con
tam
inat
ion
Pack
agin
gAl
lerg
ens
Adul
tera
tion
Qua
lity
stan
dard
sIn
adeq
uate
info
rmat
ion
Radi
atio
n
Tota
l

17EU and US Border Rejection Analysis
Table 12. Number of EU rejections of fish and fishery products from Third Countries, 2002-2008
CountryYear
TotalAnnual Average 2002 2003 2004 2005 2006 2007 2008
Vietnam 61 19 36 90 45 22 31 304 43.4
India 48 46 25 35 35 26 41 256 36.6
Indonesia 37 34 63 48 38 19 7 246 35.1
China 59 23 13 21 24 52 29 221 31.6
Thailand 69 57 12 13 30 16 13 210 30.0
Bangladesh 11 16 13 21 27 6 14 108 15.4
Brazil 5 6 21 26 20 19 4 101 14.4
Malaysia 13 25 21 4 3 15 5 86 12.3
Singapore 4 52 16 0 2 6 1 81 11.6
Morocco 13 24 7 2 11 14 6 77 11.0
Sri Lanka 5 3 10 1 8 16 17 60 8.6
Chile 5 23 13 6 5 5 2 59 8.4
Tunisia 3 1 5 12 4 10 23 58 8.3
Taiwan 2 34 6 0 3 1 1 47 6.7
Senegal 4 8 2 8 6 11 7 46 6.6
Ecuador 9 14 11 3 2 1 6 46 6.6
Australia 0 1 4 17 12 6 0 40 5.7
Norway 1 2 14 11 8 0 2 38 5.4
USA 1 16 2 3 3 5 6 36 5.1
Philippines 0 13 2 3 4 5 5 32 4.6
Turkey 3 4 5 8 1 3 4 28 4.0
Croatia 0 0 6 2 1 4 14 27 3.9
Namibia 6 1 1 5 3 7 4 27 3.9
Panama 6 1 0 2 6 11 1 27 3.9
Argentina 2 9 1 4 4 2 0 22 3.1
South Korea 1 4 6 1 7 0 3 22 3.1
Russian Federation 0 1 8 7 1 1 2 20 2.9
Angola 1 0 0 9 2 6 0 18 2.6
Colombia 0 8 3 1 3 2 0 17 2.4
Cote d’Ivoire 1 1 2 0 3 6 2 15 2.1
Other 26 37 44 54 59 47 38 305 41.4
Total 396 483 372 417 380 344 288 2,680 383
5. Analysis by product group
5.1 Fish and fishery products
In the following sub-sections, patterns and trends in border rejections for four main food commodity groups are examined. The first of these is fish and fishery products. In both the EU and the US, Vietnam, Indonesia, China, India and Thailand are amongst the countries with the greatest number of rejections of fish and fishery products over the period 2002 to 2008 (Tables 12 and 13), collectively accounting for over 45 per cent of total rejections. In the US, the Philippines also recorded a large num-ber of rejections, accounting for almost six per cent of the total.
Examining unit rejection rates, however, presents a somewhat different picture to the total number of rejections. In the EU, the
largest unit rejection rates for fish and fishery products over the period 2002 to 2008 were recorded by Vietnam, Indonesia, In-dia, Sri Lanka and Malaysia (Table 14). In all of these countries, however, the unit rejection rate declined more rapidly than the all-country average over this period, suggesting appreciable improvements in compliance. However, while China had a rela-tively low unit rejection rate, this needs to be interpreted with some caution. Over much of the period 2002 to 2008, China faced restrictions on exports of certain fish and fishery products due to persistent non-compliance, for example with controls on veterinary drug residues. Because no exports of these products could take place, clearly rejections were zero. Morocco, Argen-tina, Ecuador, Chile, Namibia, Seychelles and Senegal all stand out as developing countries with large exports of fish and fish-ery products but low unit rejection rates.

18 UNIDO Working Paper
Table 13. Number of US rejections of fish and fishery products, 2002-2008
CountryYear
TotalAnnual Average 2002 2003 2004 2005 2006 2007 2008
Vietnam 256 228 365 285 194 237 229 1,794 256.3
Indonesia 122 230 267 173 213 271 203 1,479 211.3
China 119 132 107 156 282 387 160 1,343 191.9
Philippines 113 142 127 114 57 109 65 727 103.9
Thailand 109 99 114 130 71 78 65 666 95.1
India 154 131 75 86 47 51 12 556 79.4
Mexico 228 98 55 70 41 29 26 547 78.1
Korea, South 60 92 65 66 46 56 105 490 70.0
Japan 90 86 71 50 131 25 36 489 69.9
Taiwan 86 74 75 57 50 69 57 468 66.9
Bangladesh 28 19 186 66 41 35 38 413 59.0
Canada 97 100 60 60 31 14 15 377 53.9
Ecuador 57 17 30 54 43 40 8 249 35.6
Brazil 25 49 46 31 60 18 13 242 34.6
Ireland 212 9 6 4 0 0 1 232 33.1
United Kingdom 36 53 50 7 6 11 38 201 28.7
Malaysia 12 16 16 37 21 43 37 182 26.0
Venezuela 14 20 53 34 5 34 11 171 24.4
Chile 25 28 31 22 20 17 4 147 21.0
Spain 14 10 65 16 29 7 3 144 20.6
Hong Kong 39 9 13 11 23 27 4 126 18.0
Sri Lanka 12 18 5 11 29 18 9 102 14.6
Singapore 13 46 6 10 9 8 9 101 14.4
Ghana 15 22 23 18 9 6 7 100 14.3
Guyana 21 17 26 21 10 3 0 98 14.0
Italy 15 11 22 18 3 16 11 96 13.7
Peru 10 44 10 9 1 14 8 96 13.7
Poland 5 34 25 21 2 0 7 94 13.4
Panama 12 9 40 7 12 3 7 90 12.9
Honduras 4 20 1 33 7 0 4 69 9.9
Other 202 199 161 183 113 105 98 1061 151.6
Total 2,205 2,062 2,196 1,860 1,606 1,731 1,290 12,950 1,850.0
Countries with high US unit rejections rates over the period 2002 to 2008 included South Korea, the Philippines, Taiwan, Guyana, Indonesia, Vietnam, Bangladesh, Japan, Spain and the United Kingdom (Table 15). Among the developing countries with large exports of fish and fishery products, Chile, Thailand, Argentina, Mexico and Panama had unit rejection rates that were appreci-ably below the all-country average.
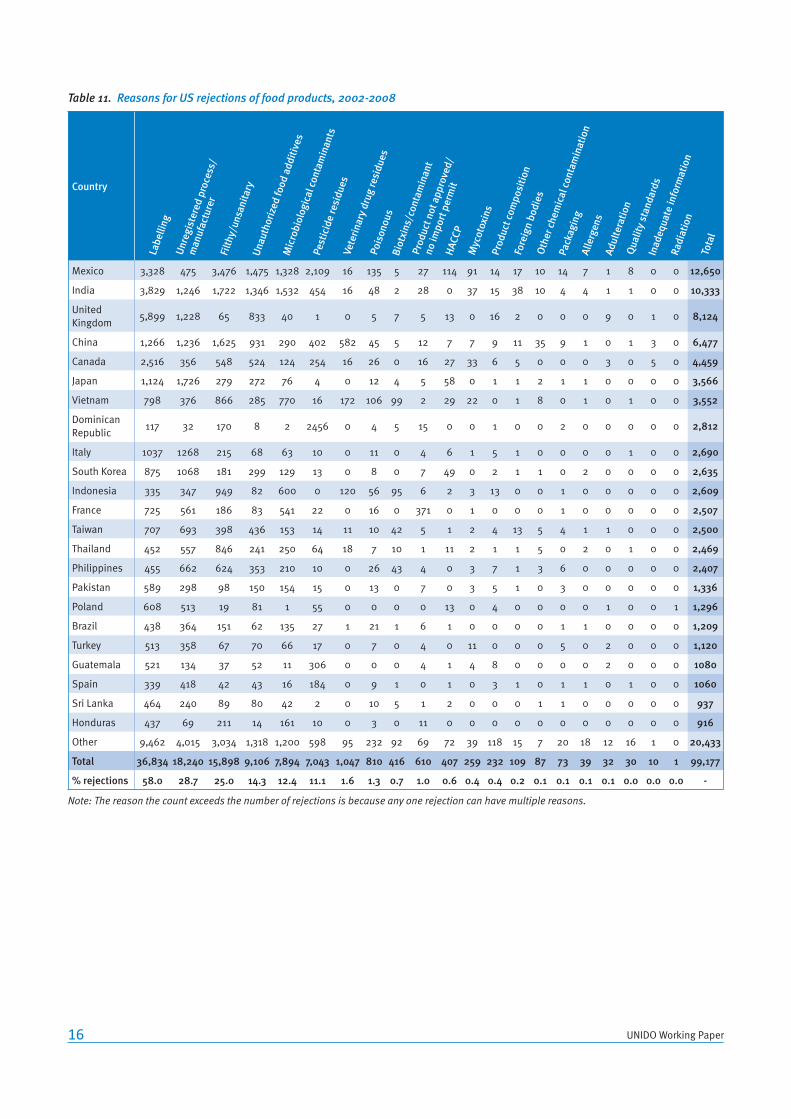
Figures 8 and 9 report relative rejection rates for fish and fishery products in the EU and the US, excluding countries with annual exports of less than US$500,000 and those with zero rejections. For both the EU and the US, Chile and Ecuador are large export-ers with good relative compliance performance. Conversely, Vi-etnam, Indonesia and Bangladesh have relatively poor compli-ance performance in both the EU and the US. In both the EU and the US, there were relatively minor exporters of fish and fishery
products with particularly poor relative rejection rates, suggest-ing acute compliance problems. For example, Ghana and Nige-ria in the US and The Gambia, Benin, Fiji and Congo in the EU.
It is noteworthy that, while Thailand and China are large under-performing exporters with respect to exports to the EU, they are relatively good performers in the US. Conversely, while Senegal recorded a relatively good compliance performance with (large) exports to the EU over the period 2002 to 2008, it performed relatively poorly with respect to its exports to the US, where it is was a comparatively minor exporter. Such comparisons of relative rejection rates for particular commodities, in this case fish and fishery products, indicate export destination-specific compliance issues rather than more systemic weaknesses in compliance capacity.

19EU and US Border Rejection Analysis
Table 14. Unit rejection rate for EU fish and fishery product imports from Third Countries, 2002-2008
CountryValue of Exports
2002-08
(US$ million)
Moving Average
2002-04 2003-05 2004-06 2005-07 2006-08
Norway 20,754 0.002 0.003 0.004 0.002 0.001
Iceland 8,514 0.000 0.000 0.000 0.000 0.000
China 7,701 0.080 0.027 0.018 0.022 0.021
USA 6,180 0.010 0.011 0.003 0.004 0.004
Morocco 6,057 0.021 0.015 0.008 0.009 0.010
Argentina 4,740 0.006 0.007 0.005 0.005 0.002
Thailand 4,372 0.118 0.064 0.031 0.028 0.025
Ecuador 3,960 0.038 0.027 0.013 0.003 0.003
Vietnam 3,590 0.309 0.169 0.148 0.105 0.039
Chile 3,548 0.041 0.039 0.017 0.009 0.006
India 3,500 0.114 0.085 0.066 0.058 0.053
Russian Federation 3,242 0.007 0.013 0.013 0.007 0.003
Faroe Islands 3,140 0.000 0.000 0.000 0.000 0.000
Canada 3,102 0.005 0.008 0.004 0.003 0.003
Greenland 2,412 0.001 0.001 0.006 0.006 0.006
Namibia 2,029 0.011 0.008 0.011 0.017 0.015
South Africa 2,029 0.005 0.005 0.003 0.003 0.003
Indonesia 1,966 0.189 0.164 0.163 0.115 0.072
Seychelles 1,663 0.007 0.004 0.000 0.005 0.005
Bangladesh 1,590 0.066 0.078 0.090 0.076 0.062
Senegal 1,573 0.020 0.026 0.025 0.037 0.036
Brazil 1,392 0.053 0.074 0.094 0.101 0.074
Turkey 1,296 0.033 0.037 0.028 0.021 0.010
Madagascar 1,256 0.003 0.003 0.002 0.000 0.000
Peru 1,154 0.016 0.015 0.015 0.011 0.006
New Zealand 1,113 0.012 0.020 0.017 0.011 0.009
Colombia 1,103 0.027 0.029 0.016 0.012 0.011
Tanzania 1,096 0.010 0.009 0.010 0.008 0.006
Cote d’Ivoire 1,084 0.008 0.006 0.012 0.020 0.023
Malaysia 1,003 0.150 0.110 0.061 0.043 0.049
Mauritius 960 0.013 0.011 0.009 0.009 0.006
Philippines 912 0.048 0.058 0.029 0.031 0.028
Mauritania 882 0.003 0.000 0.000 0.000 0.000
Tunisia 863 0.029 0.048 0.055 0.063 0.088
Ghana 852 0.006 0.009 0.030 0.034 0.031
Falkland Islands 813 0.000 0.000 0.000 0.000 0.002
Uganda 763 0.010 0.010 0.002 0.002 0.005
South Korea 709 0.038 0.039 0.054 0.032 0.036
Average - 0.031 0.028 0.023 0.020 0.016
Note: Rejection rate converted to US$ at respective average annual exchange rate.
Microbiological contamination was a major reason for rejec-tions of fish and fishery products in the EU and the US over the period 2002 to 2008 (Tables 16 and 17), accounting for over 20 per cent of rejections in the EU and being referenced in almost
29 per cent of rejections in the US. The related but more generic category of filthy/unsanitary was referenced in almost 50 per cent of rejections in the US; this category is not employed in the EU. In both the EU and the US, a relatively small proportion of

20 UNIDO Working Paper
Table 15. Unit rejection rate for US fish and fishery product imports, 2002-2008
CountryValue of Exports
2002-08
(US$ million)
Moving Average
2002-04 2003-05 2004-06 2005-07 2006-08
Canada 15,076 0.041 0.034 0.024 0.016 0.009
Thailand 11,188 0.078 0.080 0.070 0.056 0.039
China 10,766 0.113 0.103 0.114 0.149 0.138
Chile 5,554 0.046 0.039 0.032 0.022 0.014
Indonesia 4,974 0.417 0.395 0.309 0.272 0.255
Vietnam 4,643 0.457 0.470 0.466 0.365 0.314
Ecuador 3,642 0.077 0.068 0.081 0.083 0.053
Mexico 3,092 0.328 0.177 0.124 0.102 0.067
India 2,437 0.288 0.234 0.186 0.190 0.132
Russia 2,162 0.022 0.018 0.017 0.011 0.015
Philippines 1,561 0.685 0.611 0.448 0.382 0.304
Japan 1,243 0.592 0.445 0.493 0.364 0.320
Brazil 1,082 0.210 0.241 0.313 0.271 0.240
Honduras 992 0.066 0.127 0.090 0.087 0.025
Bangladesh 975 0.529 0.583 0.579 0.303 0.240
Iceland 945 0.038 0.081 0.072 0.057 0.000
New Zealand 915 0.026 0.013 0.015 0.024 0.019
Taiwan 911 0.613 0.524 0.465 0.469 0.450
Malaysia 899 0.398 0.341 0.166 0.210 0.180
Norway 853 0.074 0.081 0.093 0.063 0.020
Panama 734 0.193 0.174 0.185 0.069 0.072
Venezuela 670 0.255 0.314 0.263 0.261 0.201
Australia 627 0.040 0.035 0.034 0.030 0.027
Argentina 588 0.037 0.050 0.046 0.023 0.033
Nicaragua 564 0.111 0.088 0.026 0.036 0.031
South Korea 507 1.062 1.083 0.860 0.784 0.859
Costa Rica 477 0.157 0.145 0.143 0.121 0.118
Fiji 443 0.095 0.120 0.120 0.193 0.133
Peru 399 0.556 0.467 0.120 0.118 0.095
United Kingdom 395 1.083 0.694 0.424 0.142 0.233
Bahamas 375 0.005 0.012 0.007 0.007 0.012
Trinidad and Tobago 310 0.071 0.196 0.167 0.152 0.005
Singapore 297 0.443 0.439 0.201 0.233 0.237
Spain 281 0.798 0.765 0.878 0.382 0.285
Guyana 269 0.561 0.573 0.528 0.299 0.116
Colombia 268 0.172 0.168 0.094 0.061 0.051
Belize 214 0.007 0.007 0.007 0.000 0.000
South Africa 212 0.084 0.084 0.084 0.044 0.044
Average - 0.202 0.181 0.158 0.136 0.114
rejections were related to concerns over the efficacy of process controls, whether generically or specifically related to hazard analysis and critical control point (HACCP).
With EU rejections, veterinary drug residues and heavy metals figure prominently, accounting for almost 28 per cent and over 20 per cent of rejections, respectively, while veterinary drug res-idues were referenced in less than eight per cent of rejections in
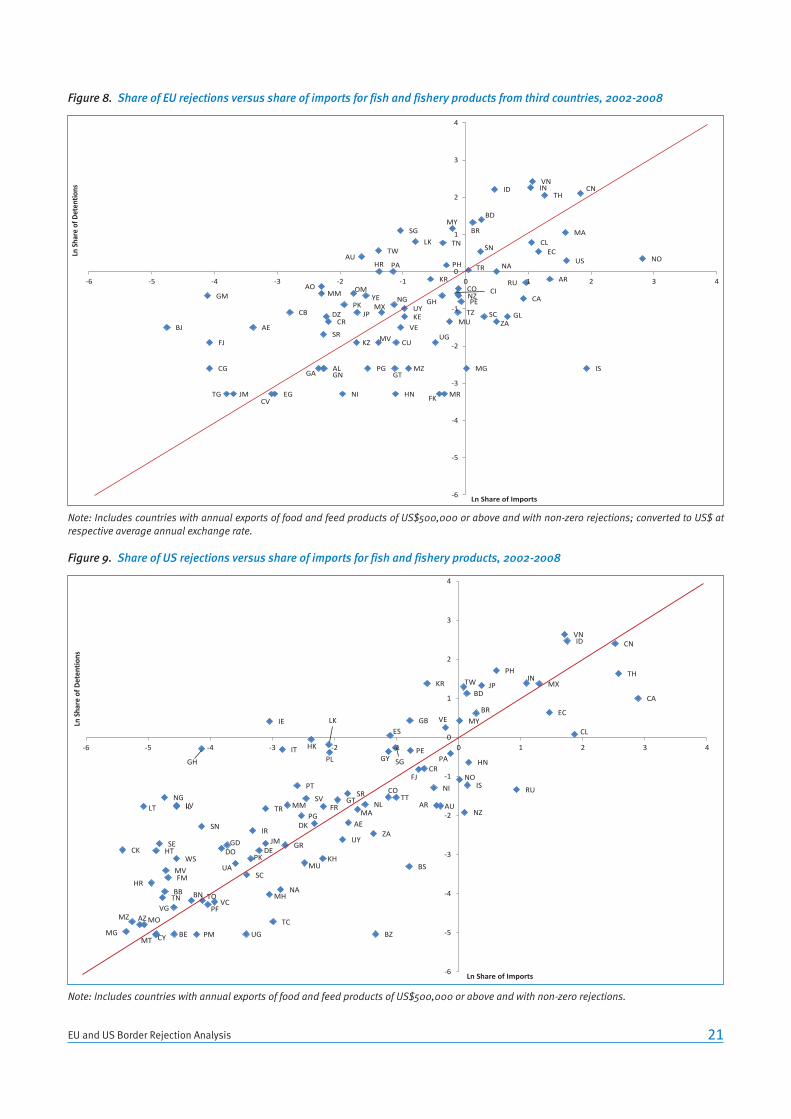
21EU and US Border Rejection Analysis
Note: Includes countries with annual exports of food and feed products of US$500,000 or above and with non-zero rejections; converted to US$ at respective average annual exchange rate.
Note: Includes countries with annual exports of food and feed products of US$500,000 or above and with non-zero rejections.
Figure 8. Share of EU rejections versus share of imports for fish and fishery products from third countries, 2002-2008
NO
IS
CN
US
MA
AR
TH
EC
VN
CL
IN
RU
CA
GL
NA
ZA
ID
SC
BD
SN
BR
TR
MG
PE NZ CO
TZ
CI
MY
MU
PH
MR
TN
GH
FK
UG
KR
LK
MZ
KE UY
VE
SG
CU
HN
GT
NG
PA
MX
HR
TW
MV
PG
YE
AU
JP
KZ
OM
PK
NI
CR DZ
AL GN
SR
MM AO
GA
CB
EG CV
AE
JM TG
FJ
CG
GM
BJ
-6
-5
-4
-3
-2
-1
0
1
2
3
4
-6 -5 -4 -3 -2 -1 0 1 2 3 4
Ln S
hare
of D
eten
tions
Ln Share of Imports
Figure 9. Share of US rejections versus share of imports for fish and fishery products, 2002-2008
CA
TH
CN
CL
ID VN
EC
MX IN
RU
PH
JP
BR
HN
BD
IS
NZ
TW
MY
NO
PA
VE
AU AR
NI
KR
CR FJ
PE
GB
BS
TT
SG
ES
GY
CO
BZ
ZA
NL MA
SR
AE
UY
GT
PL
LK
FR
KH
HK
DK
MU
SV
PG
PT
GR
IT
NA
MM
TC
IE
MH
TR
JM DE
PK
IR
UG
UA SC
GD DO
GH
SN
VC PF
TO BN
PM
IL LV
FM
WS
BE
MV
TN VG
BB
MT
NG
SE
CY
HR
HT
LT
AZ MO MZ
MG
CK
-6
-5
-4
-3
-2
-1
0
1
2
3
4
-6 -5 -4 -3 -2 -1 0 1 2 3 4
Ln S
hare
of D
eten
tions
Ln Share of Imports

22 UNIDO Working Paper
Table 16. Reasons for EU rejections of fish and fishery products from Third Countries, 2002-2008
Country
Vietnam 160 103 44 13 21 2 7 1 1 10 362
India 159 63 37 2 0 0 1 0 9 11 282
Indonesia 70 28 87 44 36 5 1 0 2 2 275
China 118 12 14 1 0 11 8 0 2 72 238
Thailand 107 33 41 13 7 0 1 7 1 20 230
Bangladesh 85 27 1 1 0 0 0 0 1 0 115
Brazil 1 12 23 3 1 5 0 0 1 56 102
Malaysia 11 59 1 13 0 0 1 3 0 2 90
Singapore 0 0 88 0 0 0 0 0 0 3 91
Morocco 0 34 14 13 0 1 3 3 1 18 87
Sri Lanka 1 3 14 30 1 10 0 0 0 5 64
Chile 14 30 14 1 1 1 2 0 0 2 65
Tunisia 0 27 5 1 0 1 2 0 3 27 66
Taiwan 33 0 13 0 0 2 0 0 0 0 48
Senegal 0 9 14 2 4 1 3 3 1 11 48
Ecuador 6 14 7 5 1 0 1 0 1 12 47
Australia 0 0 39 0 0 1 0 0 0 0 40
Norway 0 5 0 6 0 21 0 2 1 6 41
USA 0 4 12 0 0 4 4 5 1 10 40
Philippines 11 1 5 6 5 0 0 0 0 8 36
Turkey 0 34 1 2 0 0 0 1 2 0 40
Croatia 0 1 4 3 0 17 5 0 0 2 32
Namibia 0 6 19 0 1 0 2 0 0 0 28
Panama 0 0 16 2 2 0 0 0 0 7 27
Argentina 0 10 5 1 0 2 1 0 3 5 27
South Korea 7 5 3 1 0 0 0 0 0 7 23
Russian Federation 0 2 1 0 0 1 4 0 1 12 21
Angola 0 0 0 1 0 0 0 0 0 17 18
Colombia 0 6 1 1 0 0 0 0 0 10 18
Cote d’Ivoire 0 2 2 2 0 0 0 11 0 3 20
Other 35 69 68 25 16 10 21 22 9 61 336
Total 818 599 593 192 96 95 67 58 40 399 2,957
% rejections 27.7 20.3 20.1 6.5 3.2 3.2 2.3 2.0 1.4 13.5 100.0
Note: The reason the count exceeds the number of rejections is because any one rejection can have multiple reasons.
Vete
rinar
y dr
ug re
sidu
esM
icro
biol
ogic
al c
onta
min
ants
Heav
y m
etal
s
Biot
oxin
s/co
ntam
inan
tsPr
oduc
t com
posi
tion
Para
sitic
infe
stat
ion
Bad
or in
suffi
cien
t con
trol
sIn
dust
rial c
onta
min
ants
Org
anol
petic
asp
ects
Not d
eter
min
ed/o
ther
Tota
l
the US. Veterinary drug residues, however, were a problem for a relatively small number of countries exporting to the EU, nota-bly Vietnam, India, China, Thailand, Bangladesh and Indonesia;
this reflects specific problems with residues of antibiotics in the products of aquaculture, notably shrimp.

23EU and US Border Rejection Analysis
Table 17. Reasons for US rejections of fish and fishery products, 2002-2008
Country
Vietnam 740 688 338 89 170 100 29 99 14 5 2,272
Indonesia 903 572 103 4 120 54 2 95 14 0 1,867
China 471 216 233 79 564 6 7 5 123 17 1,721
Philippines 430 164 119 207 0 20 0 43 2 5 990
Thailand 396 203 104 78 18 5 11 10 2 6 833
India 382 366 32 19 16 2 0 2 2 1 822
Japan 236 76 145 122 0 9 58 4 22 1 673
South Korea 136 128 192 121 0 7 49 0 2 1 636
Mexico 218 183 66 13 12 7 114 2 1 5 621
Bangladesh 292 259 51 0 1 1 0 0 0 0 604
Taiwan 296 124 69 23 10 5 1 42 3 2 575
Canada 162 58 154 71 9 16 25 0 4 5 504
United Kingdom 35 32 96 205 0 0 13 7 8 0 396
Ecuador 115 38 25 36 5 22 18 39 0 1 299
Brazil 131 105 19 19 1 20 1 1 0 1 298
Spain 10 3 81 137 0 8 1 1 2 0 243
Ireland 224 5 2 4 0 0 1 0 0 0 236
Malaysia 101 57 39 13 12 0 0 12 0 0 234
Venezuela 60 94 20 2 18 5 4 0 0 0 203
Sri Lanka 24 16 87 53 0 10 2 5 0 1 198
Italy 19 0 54 95 0 10 5 0 0 0 183
Chile 69 29 31 26 1 13 13 0 0 0 182
Hong Kong 77 8 28 8 32 0 0 0 16 2 171
Guyana 59 21 76 1 0 0 0 1 0 0 158
Poland 5 0 20 112 0 0 13 0 0 0 150
Ghana 81 5 33 14 0 0 6 0 0 0 139
Peru 47 2 26 47 5 5 2 1 0 0 135
Singapore 60 14 6 1 0 32 3 8 0 0 124
Panama 69 35 14 0 0 1 1 2 0 0 122
Other 535 210 356 315 1 92 19 10 8 8 1,554
Total 6,383 3,711 2,619 1,914 995 450 398 389 223 61 17,143
% rejections 49.3 28.7 20.2 14.8 7.7 3.5 3.1 3.0 1.7 0.5 -
Note: The reason the count exceeds the number of rejections is because any one rejection can have multiple reasons.
Filth
y/un
sani
tary
Mic
robi
olog
ical
con
tam
inan
tsLa
belli
ng
Unre
gist
ered
pro
cess
/man
ufac
ture
rVe
terin
ary
drug
resi
dues
Pois
onou
s
HACC
P
Biot
xins
/ co
ntam
inan
tsUn
auth
oris
ed fo
od a
dditi
ves
Oth
er
Tota
l
Labelling and unregistered process/manufacturer were refer-enced in 20 per cent and 15 per cent of US rejections of fish and fishery products over the period 2002 to 2008, respectively. In
general, these determinations were accompanied by other as-pects of non-compliance, notably filthy/unsanitary and micro-biological contamination.

24 UNIDO Working Paper
5.2 Fruits and vegetables and fruit and vegetable products
Over the period 2002 to 2008, total EU rejections of fruits and vegetables and fruit and vegetable products were much lower than for fish and fishery products (Table 18). However, while re-jections of fish and fishery products declined over this period, rejections of fruits and vegetables increased appreciably, from 110 in 2002 to 351 in 2008. Conversely, fruits and vegetables dominated US of rejections, with an average of almost 2,800 rejections annually (Table 19). Over this period, however, the number of US rejections almost halved, from 3,182 in 2002 to 1,624 in 2008. The rate of decline in rejections for fruits and vegetables was much greater than that for all food commodities.
In the case of the EU, Turkey alone accounted for over 45 per cent of total rejections of fruit and vegetables over the period 2002 to 2008 (Table 18). Other countries with significant numbers of rejections included China and Thailand. Most other countries had low levels of rejections. Mexico and the Dominican Repub-lic accounted for a large share of fruit and vegetable rejections in the US, representing almost 25 per cent and 13 per cent of the total, respectively. A number of other countries had appreciable numbers of rejections, including China, India and Italy.
Aside from Turkey and China, most large exporters of fruits and vegetables to the EU had very low unit rejection rates over the period 2002 to 2008 (Table 20). Among these countries were a number of developing nations including Brazil, South Africa, Costa Rica, Morocco, Ecuador, Chile, Argentina and Colombia. While some middle-range exporters of fruits and vegetables, including Thailand, India, Tunisia, Ghana, Egypt and Iran, had relatively high unit rejection rates, a number of developing countries in this second tier had good compliance performance. These included Kenya, Panama and Cote d’Ivoire.
Amongst significant exporters of fruits and vegetables to the US, the Dominican Republic, Italy and India had very high unit rejec-tion rates, exceeding one rejection per US$1 million of exports (Table 21). While China had a unit rejection rate that exceeded the all-country average, this was much lower than the aforemen-tioned countries. Further, the all-country average was elevated appreciably by the small number of countries with extremely high unit rejection rates. Chile and Costa Rica stand out as de-veloping countries with very low unit rejection rates for fruit and vegetables exports to the US.
Table 18. Number of EU rejections of fruit and vegetables and fruit and vegetable products from Third Countries, 2002-2008
CountryYear
TotalAnnual Average 2002 2003 2004 2005 2006 2007 2008
Turkey 64 90 75 97 117 116 167 726 108.1
China 8 15 27 17 26 32 38 163 25.2
Thailand 3 2 12 29 24 25 36 131 25.6
India 1 17 3 8 1 5 8 43 9.4
Egypt 3 3 3 1 3 12 8 33 7.8
Chile 0 4 5 5 3 11 4 32 5.8
Iran 0 0 3 13 6 2 7 31 4.4
Uzbekistan 3 3 5 5 3 1 6 26 4.4
United States 1 0 1 4 18 2 0 26 4.0
Tunisia 0 0 3 3 3 6 8 23 3.0
Vietnam 3 0 6 6 2 2 1 20 2.8
Japan 0 1 1 6 3 8 1 20 2.3
Nigeria 3 3 0 5 4 4 1 20 3.0
Argentina 3 3 2 1 3 2 5 19 5.0
Brazil 1 2 1 3 0 10 0 17 4.6
Ghana 0 3 2 2 0 6 4 17 2.7
South Korea 1 0 5 5 1 1 3 16 2.7
Morocco 1 2 2 3 3 4 1 16 3.2
Dominican Republic 0 0 0 2 4 4 4 14 2.9
Lebanon 0 1 0 2 0 7 1 11 1.6
Pakistan 0 0 1 3 2 4 1 11 1.7
Kenya 0 0 0 2 5 2 1 10 1.3
Other 15 16 17 18 25 42 46 179 25.6
Total 110 165 174 240 256 308 351 1,604 229.1

25EU and US Border Rejection Analysis
Table 19. Number of US rejections of fruit and vegetables, 2002-2008
CountryYear
TotalAnnual Average 2002 2003 2004 2005 2006 2007 2008
Mexico 880 517 978 954 631 583 256 4,799 685.6
Dominican Republic 251 242 464 391 646 496 58 2,548 364.0
China 210 307 325 308 219 203 155 1,727 246.7
India 191 105 175 163 178 183 116 1,111 158.7
Italy 89 103 98 166 106 186 67 815 116.4
Canada 59 70 96 39 48 40 172 524 74.9
Thailand 75 67 113 59 45 64 57 480 68.6
Japan 135 61 53 46 38 51 39 423 60.4
Guatemala 70 56 54 58 43 50 58 389 55.6
Spain 133 60 72 23 22 24 32 366 52.3
Poland 103 73 42 37 41 37 15 348 49.7
Turkey 105 53 39 48 49 41 12 347 49.6
United Kingdom 77 51 36 57 36 10 55 322 46.0
South Korea 40 125 36 18 14 20 45 298 42.6
Taiwan 36 32 49 42 53 50 31 293 41.9
Philippines 26 85 42 34 26 31 36 280 40.0
Vietnam 51 29 40 21 24 34 22 221 31.6
Syria 25 59 16 30 37 46 6 219 31.3
Pakistan 33 37 45 34 20 37 12 218 31.1
Egypt 32 21 34 22 15 59 24 207 29.6
Brazil 35 21 39 31 20 15 13 174 24.9
France 39 29 22 28 21 22 3 164 23.4
Peru 10 13 22 28 14 36 31 154 22.0
Colombia 11 17 55 31 11 12 15 152 21.7
Lebanon 41 11 31 15 12 13 18 141 20.1
Iran 19 25 24 9 20 22 10 129 18.4
Bulgaria 12 35 23 18 13 18 4 123 17.6
Argentina 16 5 18 16 16 35 9 115 16.4
Jamaica 13 11 20 35 15 14 5 113 16.1
Hong Kong 27 24 4 30 3 10 9 107 15.3
Greece 47 23 11 13 1 8 3 106 15.1
Honduras 3 6 10 4 13 5 64 105 15.0
Israel 17 15 25 10 6 17 13 103 14.7
Chile 16 25 13 10 12 15 11 102 14.6
Costa Rica 32 17 19 11 12 5 1 97 13.9
Sri Lanka 19 25 5 3 12 25 5 94 13.4
Netherlands 13 17 26 5 6 15 6 88 12.6
Trinidad and Tobago 11 48 7 1 4 5 9 85 12.1
Ecuador 11 9 18 16 7 8 2 71 10.1
Other 169 271 198 210 151 176 125 1,300 185.7
Total 3,182 2,800 3,397 3,074 2,660 2,721 1,624 19,458 2,779.7

26 UNIDO Working Paper
Table 20. Unit rejection rate for EU fruit and vegetables and fruit and vegetable products imports from Third Countries, 2002-2008
CountryValue of Exports
2002-08
(US$ million)
Moving Average
2002-04 2003-05 2004-06 2005-07 2006-08
Turkey 10,661 0.066 0.065 0.063 0.066 0.072
Brazil 10,520 0.001 0.002 0.001 0.003 0.002
South Africa 9,683 0.001 0.001 0.001 0.001 0.000
China 8,630 0.020 0.021 0.022 0.018 0.019
Costa Rica 8,270 0.000 0.000 0.000 0.001 0.001
Morocco 7,213 0.002 0.003 0.003 0.003 0.002
Ecuador 6,924 0.001 0.000 0.000 0.000 0.001
Chile 6,708 0.004 0.006 0.005 0.006 0.005
Argentina 5,588 0.005 0.003 0.003 0.002 0.003
Colombia 5,459 0.000 0.000 0.001 0.002 0.003
USA 5,038 0.006 0.007 0.007 0.005 0.004
Israel 5,037 0.002 0.001 0.000 0.000 0.002
Thailand 4,007 0.010 0.031 0.047 0.053 0.044
New Zealand 3,592 0.000 0.000 0.000 0.000 0.000
Peru 2,896 0.002 0.002 0.002 0.001 0.002
Egypt 2,567 0.015 0.009 0.007 0.010 0.014
Canada 2,312 0.000 0.000 0.000 0.000 0.001
Kenya 2,279 0.000 0.002 0.007 0.009 0.007
Panama 2,065 0.003 0.003 0.000 0.000 0.001
Cote d’Ivoire 1,973 0.003 0.003 0.003 0.002 0.005
Cameroon 1,612 0.002 0.000 0.000 0.000 0.000
India 1,538 0.050 0.060 0.020 0.020 0.015
Mexico 1,314 0.005 0.000 0.000 0.000 0.000
Serbia 1,042 0.000 0.000 0.001 0.003 0.003
Dominican Republic 919 0.000 0.005 0.014 0.021 0.022
Switzerland 787 0.000 0.000 0.000 0.000 0.000
Tunisia 780 0.010 0.020 0.029 0.032 0.038
Ukraine 749 0.005 0.006 0.008 0.016 0.013
Ghana 745 0.018 0.025 0.014 0.022 0.023
Serbia and Montenegro 643 0.002 0.002 0.000 0.000 0.000
Uruguay 568 0.005 0.005 0.004 0.004 0.014
Russian Federation 560 0.012 0.008 0.007 0.012 0.008
Indonesia 548 0.004 0.008 0.012 0.008 0.004
Australia 534 0.000 0.000 0.013 0.013 0.013
Iran 522 0.013 0.086 0.111 0.105 0.056
Average - 0.010 0.012 0.012 0.013 0.013
Note: Rejection rate converted to US$ at respective average annual exchange rate.
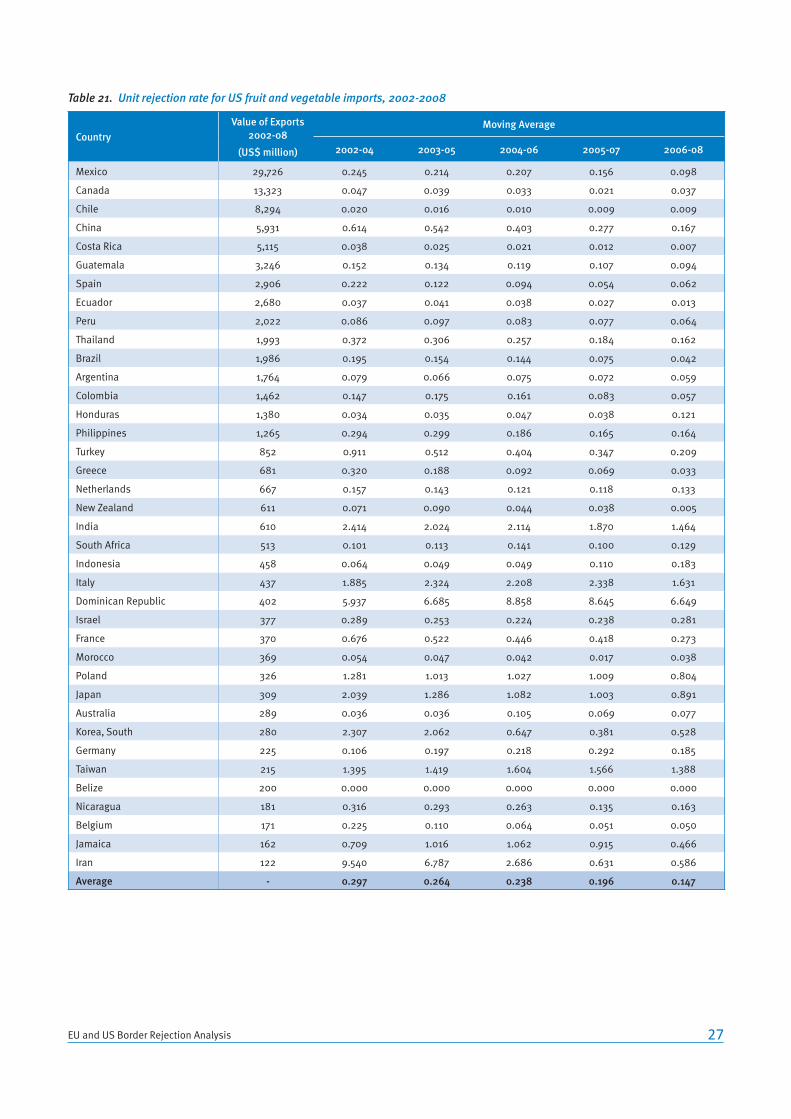
27EU and US Border Rejection Analysis
Table 21. Unit rejection rate for US fruit and vegetable imports, 2002-2008
CountryValue of Exports
2002-08
(US$ million)
Moving Average
2002-04 2003-05 2004-06 2005-07 2006-08
Mexico 29,726 0.245 0.214 0.207 0.156 0.098
Canada 13,323 0.047 0.039 0.033 0.021 0.037
Chile 8,294 0.020 0.016 0.010 0.009 0.009
China 5,931 0.614 0.542 0.403 0.277 0.167
Costa Rica 5,115 0.038 0.025 0.021 0.012 0.007
Guatemala 3,246 0.152 0.134 0.119 0.107 0.094
Spain 2,906 0.222 0.122 0.094 0.054 0.062
Ecuador 2,680 0.037 0.041 0.038 0.027 0.013
Peru 2,022 0.086 0.097 0.083 0.077 0.064
Thailand 1,993 0.372 0.306 0.257 0.184 0.162
Brazil 1,986 0.195 0.154 0.144 0.075 0.042
Argentina 1,764 0.079 0.066 0.075 0.072 0.059
Colombia 1,462 0.147 0.175 0.161 0.083 0.057
Honduras 1,380 0.034 0.035 0.047 0.038 0.121
Philippines 1,265 0.294 0.299 0.186 0.165 0.164
Turkey 852 0.911 0.512 0.404 0.347 0.209
Greece 681 0.320 0.188 0.092 0.069 0.033
Netherlands 667 0.157 0.143 0.121 0.118 0.133
New Zealand 611 0.071 0.090 0.044 0.038 0.005
India 610 2.414 2.024 2.114 1.870 1.464
South Africa 513 0.101 0.113 0.141 0.100 0.129
Indonesia 458 0.064 0.049 0.049 0.110 0.183
Italy 437 1.885 2.324 2.208 2.338 1.631
Dominican Republic 402 5.937 6.685 8.858 8.645 6.649
Israel 377 0.289 0.253 0.224 0.238 0.281
France 370 0.676 0.522 0.446 0.418 0.273
Morocco 369 0.054 0.047 0.042 0.017 0.038
Poland 326 1.281 1.013 1.027 1.009 0.804
Japan 309 2.039 1.286 1.082 1.003 0.891
Australia 289 0.036 0.036 0.105 0.069 0.077
Korea, South 280 2.307 2.062 0.647 0.381 0.528
Germany 225 0.106 0.197 0.218 0.292 0.185
Taiwan 215 1.395 1.419 1.604 1.566 1.388
Belize 200 0.000 0.000 0.000 0.000 0.000
Nicaragua 181 0.316 0.293 0.263 0.135 0.163
Belgium 171 0.225 0.110 0.064 0.051 0.050
Jamaica 162 0.709 1.016 1.062 0.915 0.466
Iran 122 9.540 6.787 2.686 0.631 0.586
Average - 0.297 0.264 0.238 0.196 0.147
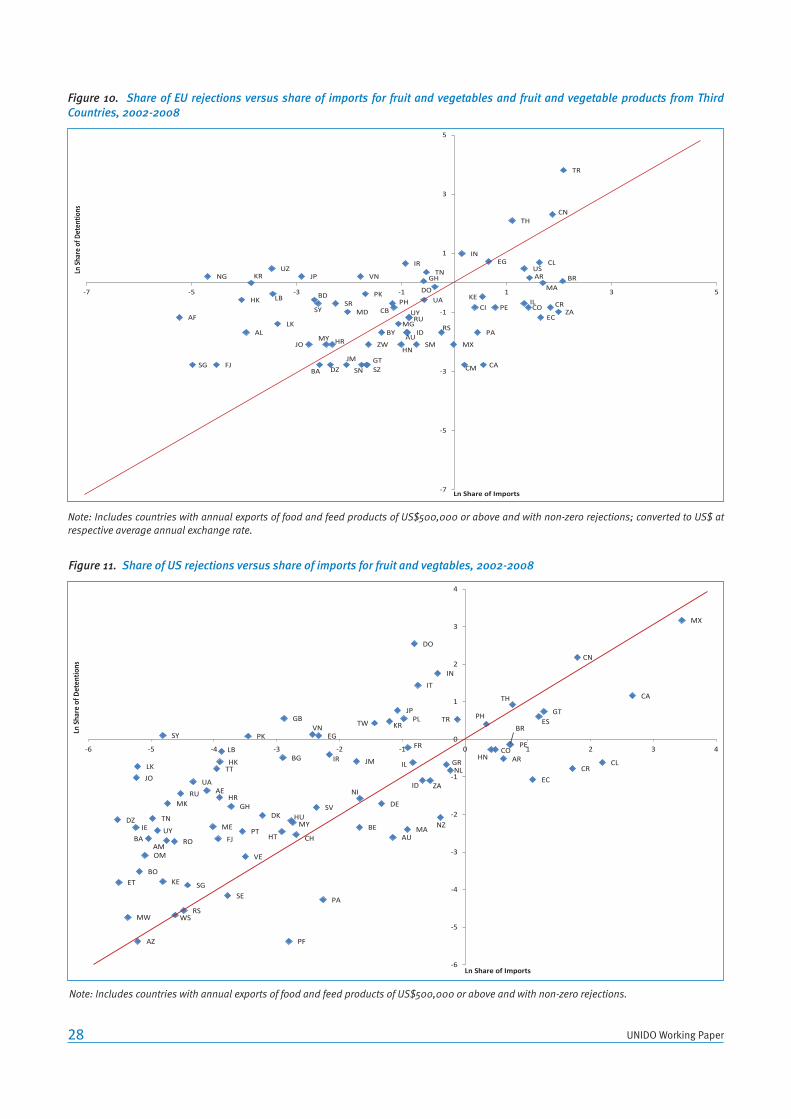
28 UNIDO Working Paper
TR
BR
ZA
CN
CR
MA
EC
CL
AR
CO
US
IL
TH
PE
EG
CA
KE
PA
CI
CM
IN
MX
RS
DO
TN
UA
GH
SM
UY RU
ID AU
IR
HN
MG
CB PH
BY
ZW
GT SZ
PK
SN
VN
MD
JM
SR
HR
DZ
MY
BA
SY
BD
JO
JP
LK
LB
UZ KR
AL
HK
FJ
NG
SG
AF
-7
-5
-3
-1
1
3
5
-7 -5 -3 -1 1 3 5
Ln Sh
are
of D
eten
tions
Ln Share of Imports
Figure 10. Share of EU rejections versus share of imports for fruit and vegetables and fruit and vegetable products from Third Countries, 2002-2008
Note: Includes countries with annual exports of food and feed products of US$500,000 or above and with non-zero rejections; converted to US$ at respective average annual exchange rate.
MX
CA
CL
CN
CR
GT ES
EC
PE
TH
BR
AR CO
HN
PH TR
GR NL
NZ
IN
ZA ID
IT
DO
IL
FR
MA
PL JP
AU
KR
DE
TW
NI
BE
JM IR
PA
EG
SV
VN
CH
MY
PF
HT
GB
HU
BG
DK
PK
PT
VE
GH
SE
LB
HR
FJ
HK
AE
TT
ME
UA
RS
SG
RU
RO
WS
UY
SY
AM
KE
TN
MK
AZ
BO
JO
MW
BA
LK
IE
OM
ET
DZ
-6
-5
-4
-3
-2
-1
0
1
2
3
4
-6 -5 -4 -3 -2 -1 0 1 2 3 4
Ln S
hare
of D
eten
tions
Ln Share of Imports
Figure 11. Share of US rejections versus share of imports for fruit and vegtables, 2002-2008
Note: Includes countries with annual exports of food and feed products of US$500,000 or above and with non-zero rejections.

29EU and US Border Rejection Analysis
Figures 10 and 11 report the relative rejection rates of fruit and vegetable exporting countries to the EU and the US over the pe-riod 2002 to 2008. For both the EU and the US, Chile, Brazil, Ar-gentina, Ecuador, Morocco, Mexico, Guatemala, Colombia and Peru (among others) stand out as having low relative rejection rates, and thus are good compliance performers. Turkey, India, Iran and Vietnam, for example, underperform in both the EU and the US, in that they account for a greater proportion of rejec-tions than their share of fruits and vegetable imports. China’s performance in both markets is marginal, being positioned just above the 45o line. Thailand has a high relative rejection rate for fruit and vegetable exports to the EU, but performs better with exports to the US, being positioned almost on the diagonal.
In both the EU and the US, pesticide residues were a major cause of rejections of fruits and vegetables over the period 2002 to 2008, accounting for 27 per cent of rejections in the EU and being referenced in 33 per cent of US rejections (Tables 22 and 23). In the EU, mycotoxins and unauthorised food ad-ditives were also frequent causes of rejections, accounting for 24 per cent and 17 per cent of the total, respectively. The most frequently referenced non-conformity in US rejections of fruits and vegetables was unregistered process/manufacturer, being cited in over 42 per cent of rejections. Labelling was cited in almost 30 per cent of rejections and filthy/unsanitary in almost 24 per cent.
Table 22. Reasons for EU rejections of fruit and vegetables and fruit and vegetable products from Third Countries, 2002-2008
Country
Turkey 146 375 173 12 8 40 0 6 0 5 14 779
China 7 3 45 35 37 8 22 6 2 4 16 185
Thailand 95 0 36 38 0 1 3 2 0 0 1 176
India 39 3 2 2 8 1 1 0 0 0 1 57
Egypt 31 1 0 2 1 3 0 1 0 0 2 41
Chile 16 1 8 3 0 2 3 0 0 0 0 33
Iran 8 14 8 0 0 2 2 0 0 0 1 35
Uzbekistan 0 19 0 2 5 0 0 0 0 0 0 26
USA 3 3 1 3 1 1 3 0 10 0 1 26
Tunisia 1 1 0 2 0 16 3 1 0 1 4 29
Vietnam 3 0 1 25 0 0 0 1 0 0 0 30
Japan 0 0 2 0 16 0 7 0 0 0 0 25
Nigeria 0 9 0 1 0 3 7 1 0 1 0 22
Argentina 12 0 6 2 0 0 0 2 0 0 2 24
Brazil 10 1 4 0 0 0 0 2 1 0 1 19
Ghana 0 1 0 5 0 4 1 5 0 1 5 22
South Korea 0 0 0 0 16 0 0 0 0 0 0 16
Morocco 12 1 0 0 1 0 1 0 0 0 1 16
Dominican Republic 15 0 1 0 0 0 0 0 0 0 0 16
Lebanon 12 0 0 1 2 0 0 0 0 0 0 15
Pakistan 1 0 1 1 6 1 2 0 0 0 0 12
Kenya 8 0 0 0 0 0 6 0 0 0 0 14
Other 79 9 27 28 16 7 13 11 2 2 21 215
Total 498 441 315 162 117 89 74 38 15 14 70 1,833
% rejections 27.2 24.1 17.2 8.8 6.4 4.9 4.0 2.1 0.8 0.8 3.8 100.0
Note: The reason the count exceeds the number of rejections is because any one rejection can have multiple reasons.
Pest
icid
e re
sidu
es
Myc
otox
ins
Unau
thor
ised
food
add
itive
sM
icro
biol
ogic
al c
onta
min
ants
Prod
uct c
ompo
sitio
nFo
reig
n bo
dies
Heav
y m
etal
s
Org
anol
eptic
asp
ects
GMO
/nov
el fo
od
Labe
lling
Not d
eter
min
ed/o
ther
Tota
l

30 UNIDO Working Paper
Table 23. Reasons for US rejections of fruit and vegetables, 2002-2008
Country
Mexico 272 2045 302 2017 174 320 0 5 13 5,148
China 683 346 441 720 521 14 5 16 27 2,773
Dominican Republic 15 2455 44 58 2 1 1 2 2 2,580
India 647 194 649 268 97 19 8 0 2 1,884
Italy 923 9 252 120 6 1 0 0 2 1,313
Canada 122 249 316 62 36 6 5 2 16 814
Japan 409 3 152 11 139 0 0 0 2 716
Taiwan 166 11 211 51 263 0 2 1 4 709
United Kingdom 322 1 279 4 40 1 0 0 0 647
Thailand 224 48 91 180 72 9 1 2 4 631
Turkey 314 15 129 50 19 0 0 7 8 542
Poland 330 54 81 10 19 0 3 0 1 498
Spain 206 182 78 16 5 0 3 0 2 492
Egypt 160 28 223 27 11 6 27 0 0 482
South Korea 295 11 134 19 4 0 2 1 3 469
Guatemala 73 294 75 8 5 0 5 0 0 460
Syria 166 2 205 51 12 2 0 0 4 442
Pakistan 154 3 108 64 35 1 3 0 3 371
Philippines 176 9 32 94 36 19 1 2 2 371
Vietnam 164 14 87 47 29 5 0 1 3 350
Brazil 195 27 68 7 3 0 0 0 0 300
Lebanon 75 1 138 28 30 0 20 0 6 298
Colombia 172 36 42 27 2 0 0 0 1 280
France 131 21 63 17 14 1 0 2 2 251
Iran 76 21 83 57 1 1 1 0 2 242
Peru 107 58 44 6 5 5 0 0 0 225
Sri Lanka 90 0 100 27 8 0 0 0 0 225
Honduras 35 10 29 92 0 48 0 0 0 214
Greece 103 4 81 10 4 0 0 0 6 208
Other 1,434 387 1,260 470 182 59 51 42 30 3,915
Total 8,239 6,538 5,797 4,618 1,774 518 138 83 145 27,850
% rejections 42.1 33.4 29.7 23.6 9.1 2.6 0.7 0.4 0.7 -
Note: The reason the count exceeds the number of rejections is because any one rejection can have multiple reasons.
Unre
gist
ered
pro
cess
/man
ufac
ture
rPe
stic
ide
resi
dues
Labe
lling
Filth
y/un
sani
tary
Unau
thor
ised
food
add
itive
sM
icro
biol
ogic
al c
onta
min
ants
Prod
uct c
ompo
sitio
n
Pois
onou
s
Oth
er
Tota
l

31EU and US Border Rejection Analysis
5.3 Nuts and seeds and nut and seed products
Nuts and seeds and nut and seed products for human con-sumption (rather than oil extraction) were subject to the great-est number of rejections of all food and feed product imports to the EU over the period 2002 to 2008, with an average of 669 annually. Of the 4,680 rejections over this period, Iran alone ac-counted for 43 per cent (Table 24). Other countries with large numbers of rejections included Turkey, China and the US. These four countries accounted for 75 per cent of total EU rejections of
nuts and seeds. The US, in stark contrast, had itself relatively few rejections of nuts and seeds, totalling only 1,043 over the period 2002 to 2008 (Table 25). India, Mexico and China alone accounted for 46 per cent of US nuts and seeds rejections.
Of the largest exporters of nuts and seeds to the EU, Iran and China had the highest unit rejection rates over the period 2002 to 2008 (Table 26). While Turkey had large numbers of rejec-tions over this period, the magnitude of its exports meant that its unit rejection rate was much lower than other large exporters.
Table 24. Number of EU rejections of nuts and seeds from Third Countries, 2002-2008
CountryYear
TotalAnnual Average 2002 2003 2004 2005 2006 2007 2008
Iran 63 491 485 457 233 127 162 2,018 288.3
Turkey 71 66 45 66 108 148 110 614 87.7
China 19 45 60 86 72 85 180 547 78.1
USA 8 18 33 46 67 89 75 336 48.0
Argentina 5 24 27 22 45 21 31 175 25.0
Brazil 49 21 13 36 25 7 17 168 24.0
Egypt 6 26 16 15 19 14 30 126 18.0
India 0 1 32 24 9 18 29 113 16.1
Nigeria 0 4 2 15 15 24 18 78 11.1
Ghana 1 4 12 15 23 5 8 68 9.7
South Africa 12 12 0 7 6 4 4 45 6.4
Lebanon 2 3 5 1 5 10 9 35 5.0
Sudan 0 0 13 4 10 2 0 29 4.1
Nicaragua 0 1 9 1 0 9 7 27 3.9
Paraguay 0 2 1 6 5 2 9 25 3.6
Philippines 1 0 0 4 6 5 9 25 3.6
Syria 0 0 6 6 1 5 6 24 3.4
Israel 0 1 3 4 8 1 2 19 2.7
Azerbaijan 0 0 0 11 5 0 1 17 2.4
Australia 0 0 0 1 0 5 9 15 2.1
Vietnam 0 0 0 0 8 4 3 15 2.1
Pakistan 0 2 0 6 0 4 1 13 1.9
Ukraine 0 0 3 3 5 1 1 13 1.9
Singapore 0 0 1 1 5 3 2 12 1.7
Thailand 1 1 2 0 3 4 1 12 1.7
Malawi 0 0 0 4 3 2 1 10 1.4
Other 6 9 9 17 21 20 19 101 14.4
Total 244 731 777 858 707 619 744 4,680 668.6

32 UNIDO Working Paper
Table 25. Number of US rejections of nuts and seeds, 2002-2008
CountryYear
TotalAnnual Average 2002 2003 2004 2005 2006 2007 2008
India 8 35 41 29 56 24 11 204 29.1
Mexico 8 13 10 28 55 31 13 158 22.6
China 38 16 20 20 17 4 6 121 17.3
Canada 10 11 8 8 7 11 10 65 9.3
Vietnam 10 12 8 1 10 14 3 58 8.3
Philippines 3 11 9 9 0 1 10 43 6.1
Lebanon 5 9 3 10 9 3 0 39 5.6
Pakistan 7 3 14 1 0 0 1 26 3.7
Taiwan 2 5 3 1 2 5 4 22 3.1
Japan 9 1 0 1 0 7 2 20 2.9
Italy 2 3 7 1 1 4 1 19 2.7
Ghana 6 0 4 0 2 1 0 13 1.9
Guatemala 3 0 4 0 1 3 2 13 1.9
Indonesia 0 1 0 6 1 3 2 13 1.9
Syria 0 0 0 0 2 11 0 13 1.9
Turkey 2 4 3 0 2 2 0 13 1.9
Colombia 0 1 3 0 2 6 0 12 1.7
Egypt 1 3 0 5 1 1 0 11 1.6
Iran 1 2 2 0 3 3 0 11 1.6
Haiti 0 0 2 2 4 2 0 10 1.4
Spain 1 0 2 1 4 0 2 10 1.4
Thailand 2 1 1 2 1 3 0 10 1.4
Other 18 27 24 21 24 19 6 139 19.9
Total 136 158 168 146 204 158 73 1,043 149.0
Amongst smaller exporters, Brazil, Egypt, Nicaragua, Ghana and Thailand had high unit rejection rates. Of major exporters to the US, India and Mexico had the highest unit rejection rates (Table 27). Vietnam and (especially) Brazil had relatively low unit rejec-tion rates.
Figures 12 and 13 present the relative rejection rates for nut and seed imports to the EU and the US over the period 2002 to 2008. In the EU, Iran, Brazil, Egypt, Ghana and Nigeria were clear under-performers, accounting for a much higher share of rejec-tions than their share of imports. In stark contrast, Brazil was one of the best performers amongst large exporters of nuts and seeds to the US. Countries with relatively good performance in nut and seed exports to the EU included the US, Turkey, Argen-
tina, India, Vietnam and Chile. Iran and Nigeria had high rela-tive rejection rates for nut and seed exports to the US, but were small exporters.
Of the total EU rejections of nuts and seeds over the period 2002 to 2008, 94 per cent were due to mycotoxins (Table 28), totalling 4,502. Iran alone accounted for almost 45 per cent of these rejections. In contrast, mycotoxins were only referenced in 142 US rejections of nuts and seeds over the same period (Ta-ble 29). The EU’s official controls on mycotoxins, and especially aflatoxins, and their impact on developing country exports of nuts and other food commodities have been widely discussed in the literature (see for example Diaz Rios and Jaffee, 2008; Otsuki et al., 2001; Otsuki and Wilson, 2001).

33EU and US Border Rejection Analysis
Table 26. Unit rejection rate for EU nuts and seeds imports from Third Countries, 2002-2008
CountryValue of Exports
2002-08
(US$ million)
Moving Average
2002-04 2003-05 2004-06 2005-07 2006-08
USA 8,809 0.020 0.026 0.034 0.045 0.051
Turkey 7,180 0.103 0.074 0.060 0.085 0.097
China 1,855 0.188 0.264 0.291 0.300 0.338
Argentina 1,479 0.150 0.173 0.173 0.129 0.111
India 1,457 0.056 0.088 0.099 0.072 0.077
Iran 1,340 1.795 2.426 1.901 1.375 0.899
Vietnam 847 0.000 0.000 0.023 0.031 0.035
Brazil 350 1.101 0.538 0.415 0.363 0.273
Chile 320 0.023 0.023 0.023 0.000 0.000
Philippines 295 0.012 0.031 0.081 0.114 0.125
Bolivia 264 0.037 0.049 0.020 0.027 0.027
Australia 257 0.000 0.008 0.008 0.043 0.098
Georgia 220 0.000 0.000 0.032 0.044 0.044
Indonesia 210 0.000 0.023 0.023 0.023 0.025
Moldova 204 0.000 0.000 0.010 0.018 0.027
South Africa 196 0.311 0.236 0.141 0.188 0.168
Ukraine 176 0.058 0.087 0.145 0.099 0.079
Azerbaijan 173 0.000 0.055 0.105 0.105 0.082
Sri Lanka 130 0.000 0.021 0.021 0.021 0.000
Israel 109 0.100 0.192 0.350 0.297 0.233
Egypt 94 1.975 1.921 1.154 1.029 1.193
Nicaragua 78 0.373 0.398 0.350 0.316 0.392
Pakistan 57 0.065 0.398 0.333 0.553 0.246
Morocco 53 0.000 0.030 0.107 0.107 0.077
Cote d’Ivoire 48 0.122 0.122 0.101 0.053 0.053
Norway 36 0.000 0.000 0.000 0.036 0.036
Thailand 31 0.432 0.307 0.416 0.435 0.481
Ghana 30 1.355 1.586 4.142 4.084 4.132
Average - 0.213 0.238 0.191 0.160 0.146
Note: Rejection rate converted to US$ at respective average annual exchange rate.

34 UNIDO Working Paper
Table 27. Unit rejection rate for US nuts and seeds imports, 2002-2008
CountryValue of Exports
2002-08
(US$ million)
Moving Average
2002-04 2003-05 2004-06 2005-07 2006-08
India 1,649 0.121 0.144 0.170 0.157 0.136
Vietnam 1,257 0.101 0.056 0.035 0.039 0.041
Mexico 1,016 0.102 0.128 0.189 0.228 0.186
Brazil 994 0.014 0.012 0.015 0.008 0.002
China 606 0.515 0.276 0.221 0.142 0.080
Philippines 302 0.207 0.253 0.157 0.080 0.065
Canada 298 0.271 0.252 0.192 0.200 0.187
Turkey 262 0.107 0.075 0.044 0.031 0.031
Thailand 207 0.088 0.049 0.039 0.058 0.039
Australia 134 0.000 0.000 0.000 0.000 0.000
Bolivia 123 0.000 0.000 0.000 0.032 0.032
Argentina 109 0.000 0.000 0.153 0.153 0.153
South Africa 108 0.000 0.000 0.000 0.000 0.000
Italy 97 0.498 0.415 0.309 0.119 0.124
Dominican Republic 91 0.000 0.000 0.000 0.050 0.050
Spain 75 0.203 0.143 0.220 0.120 0.119
Peru 65 0.000 0.070 0.070 0.098 0.028
Guatemala 60 0.430 0.126 0.156 0.131 0.191
Lebanon 60 1.107 1.022 0.827 0.770 0.442
Kenya 54 0.000 0.000 0.000 0.000 0.000
Israel 53 0.071 0.071 0.071 0.075 0.095
Indonesia 46 0.147 0.399 0.300 0.390 0.192
Tanzania 35 0.000 0.000 0.000 0.000 0.000
Cote d’Ivoire 34 0.000 0.000 0.000 0.000 0.000
Average - 0.173 0.152 0.145 0.136 0.113
The most frequent reasons for non-compliance cited in US re-jections of nuts and seeds were labelling, referenced in 57 per cent of rejections, unregistered process/manufacturer and mi-crobiological contaminants. The latter of these reasons was
referenced in 168 rejections, accounting for 16 per cent of the total. Microbiological contaminants was the second most fre-quent reason for rejections of nuts and seeds in the EU over the period 2002 to 2008, accounting for 117 rejections.

35EU and US Border Rejection Analysis
Figure 13. Share of US rejections versus share of imports for nuts and seeds, 2002-2008
Note: Includes countries with annual exports of US$500,000 or above and with non-zero rejections.
IN
VN
MX
BR
CN
PH
CA
TR
TH
BO AR
IT
DO
ES
PE
GT
LB
IL
ID
FR
LK KR
HK
NI
JP
IR
TW
NG
-4
-3
-2
-1
0
1
2
3
4
-4 -3 -2 -1 0 1 2 3 4
Ln S
hare
of D
eten
tions
Ln Share of Imports
US
TR CN
AR
IN
IR
VN
BR
CL
PH
BO
AU
GE
ID
MD
ZA
UA
AZ
LK
IL
EG
NI
PK
MA CI
CB
NO
TH
GH
MZ
SY
SG
PY
LB
MW
CA
SD
GM
MY RU
JP AF
UZ SN
NG
KG HR
-5
-4
-3
-2
-1
0
1
2
3
4
5
-5 -4 -3 -2 -1 0 1 2 3 4 5
Ln Sh
are
of D
eten
tions
Ln Share of Imports
Figure 12. Share of EU rejections versus share of imports for nuts and seeds products from Third Countries, 2002-2008
Note: Includes countries with annual exports of food and feed products of US$500,000 or above and with non-zero rejections; converted to US$ at respective average annual exchange rate.

36 UNIDO Working Paper
Table 28. Reasons for EU rejections of nuts and seeds from Third Countries, 2002-2008
Country
Iran 2,020 1 2 0 4 2,027
Turkey 590 12 4 0 13 619
China 495 19 20 5 27 566
USA 333 6 9 5 4 357
Argentina 172 1 0 1 3 177
Brazil 165 0 0 0 3 168
Egypt 122 1 0 0 4 127
India 68 48 2 7 0 125
Nigeria 74 2 2 0 0 78
Ghana 68 1 0 0 0 69
South Africa 46 0 0 0 0 46
Lebanon 31 2 0 0 2 35
Sudan 29 0 0 0 0 29
Nicaragua 27 0 0 0 1 28
Paraguay 25 0 0 0 0 25
Philippines 23 1 0 0 1 25
Syria 19 5 0 0 0 24
Israel 19 0 0 0 0 19
Azerbaijan 17 0 0 0 0 17
Australia 14 0 0 0 1 15
Vietnam 16 0 0 0 0 16
Pakistan 11 3 0 0 0 14
Ukraine 0 1 8 2 7 18
Singapore 10 0 2 0 0 12
Thailand 12 0 0 0 0 12
Malawi 10 0 0 0 0 10
Other 86 14 1 4 14 119
Total 4,502 117 50 24 84 4,777
% rejections 94.2 2.4 1.0 0.5 1.8 100.0
Myc
otox
ins
Mic
robi
olog
ical
con
tam
inan
ts
Fore
ign
bodi
es
Org
anol
eptic
asp
ects
Not d
eter
min
ed/o
ther
Tota
l

37EU and US Border Rejection Analysis
Table 29. Reasons for US rejections of nuts and seeds, 2002-2008
Country
India 50 0 40 26 32 12 71 25 0 256
Mexico 82 0 42 13 43 37 3 0 2 222
China 30 38 7 49 6 13 12 3 1 159
Canada 74 0 1 7 18 5 1 2 0 108
Vietnam 33 3 7 29 8 3 0 4 1 88
Philippines 6 48 1 9 0 2 0 1 1 68
Lebanon 4 1 39 0 1 2 0 0 0 47
Japan 13 26 0 0 0 0 0 0 0 39
Taiwan 14 11 0 10 0 1 1 2 0 39
Italy 19 9 0 5 1 2 0 0 0 36
Pakistan 17 0 0 1 3 2 0 13 0 36
Egypt 21 2 4 0 0 2 0 0 0 29
Turkey 16 1 0 1 6 1 0 0 0 25
Iran 15 0 1 1 5 2 0 0 0 24
France 10 11 0 0 0 0 0 0 0 21
Guatemala 12 3 2 0 2 1 0 0 0 20
Haiti 17 0 2 0 0 1 0 0 0 20
Indonesia 6 4 1 2 3 0 0 2 0 18
Colombia 8 0 0 0 9 0 0 0 0 17
Ghana 9 0 1 0 2 4 1 0 0 17
Syria 5 0 12 0 0 0 0 0 0 17
Brazil 7 8 0 0 0 1 0 0 0 16
Hong Kong 12 0 0 2 0 0 0 0 1 15
Spain 1 12 0 0 0 1 0 0 1 15
Sri Lanka 9 3 0 0 0 3 0 0 0 15
Nigeria 9 0 1 0 0 4 0 0 0 14
United Kingdom 5 5 0 2 0 0 0 0 0 12
Other 94 27 7 5 8 17 0 4 0 162
Total 598 212 168 162 147 116 89 56 7 1,555
% rejections 57.3 20.3 16.1 15.5 14.1 11.1 8.5 5.4 0.7 -
Labe
lling
Unre
gist
ered
pro
cess
/man
ufac
ture
rM
icro
biol
ogic
al c
onta
min
ants
Unau
thor
ised
food
add
itive
sM
ycot
oxin
s
Filth
y/un
sani
tary
Pest
icid
e re
sidu
es
Pois
onou
s
Oth
er
Tota
l

38 UNIDO Working Paper
5.4 Herbs and spices
In both the EU and the US, India had the greatest number of rejections of herbs and spices (Tables 30 and 31), accounting for 24 per cent and 39 per cent of herb and spice rejections, respectively. Other countries with high numbers of rejections of herbs and spices included Thailand and Turkey in the EU and Mexico, Pakistan, Indonesia, China and Vietnam in the US. Note that herbs and spices as a commodity group includes a great di-versity of products. Thus, the patterns of rejections across coun-tries very much reflects the types of herb and spice exported and their associated compliance challenges.11
Of the countries with appreciable exports of herbs and spices to the EU from 2002 to 2008, Thailand stands out as having by far the highest unit rejection rate (Table 32) at more than one rejection per US$1 million of exports in some periods. Other exporters with high rejection rates included India, Turkey, Mo-rocco, Egypt and Sri Lanka. Countries with very low unit rejection
11 For example, there are poten ally a range of food safety issues as-sociated with chilli powder, including microbiological contamina on and adultera on with ar fi cial colour. Conversely, there are few concerns with vanilla.
rates included Madagascar, Israel, Brazil, Iran, Kenya, Chile and Guatemala; some of these countries recorded no rejections over the period 2002 to 2008.
The unit rejection rate for herbs and spices in the US over the period 2002 to 2008 was much higher than for any other of the commodities analysed in this report (Table 33). Indeed, a number of countries, including India, Mexico, Sri Lanka, Canada Thailand and Guatemala, had unit rejection rates above one. Mexico, for example, had almost three rejections per US$1 mil-lion of exports over the period 2006 to 2008. Countries with low rejection rates included Madagascar, Brazil, Peru, Germany, Is-rael, Chile, France and Uganda.
In terms of relative rejection rates, China, Vietnam, Peru, Brazil and Chile are among the developing countries that had a good compliance performance with herb and spice exports to both the EU and the US over the period 2002 to 2008 (Figures 14 and 15), while in both the EU and the US, India, Pakistan and Thai-land were relatively poor performers, accounting for a greater proportion of rejections of herbs and spices than their share of imports. In the EU, other notable bad compliance performers in-cluded Turkey, Thailand, Egypt and Ghana.
Table 30. Number of EU rejections of herb and spices from Third Countries, 2002-2008
CountryYear
TotalAnnual Average 2002 2003 2004 2005 2006 2007 2008
India 10 35 39 47 24 27 19 201 38.9
Thailand 4 1 2 58 15 21 24 125 21.4
Turkey 1 21 42 16 10 8 6 104 12.4
Pakistan 2 6 10 16 5 3 2 44 5.9
Egypt 0 6 14 5 3 4 2 34 4.1
China 2 1 8 7 6 6 3 33 5.1
Russian Federation 0 0 0 17 13 0 1 31 3.4
Vietnam 0 1 2 7 7 6 4 27 3.8
Ghana 0 0 4 4 9 0 4 21 2.6
Morocco 2 1 0 6 7 2 3 21 3.0
Brazil 0 0 4 4 3 0 3 14 1.8
Indonesia 2 1 2 4 2 1 2 14 2.7
Ukraine 0 0 0 6 4 1 2 13 1.4
Peru 0 1 0 1 0 10 0 12 3.1
Sri Lanka 0 0 3 3 1 2 2 11 1.4
Syria 1 0 4 1 0 3 1 10 1.1
Lebanon 0 2 2 2 2 1 0 9 1.1
Other 2 10 24 30 20 18 13 16.7 117.0
Total 26 86 160 234 131 113 91 841 120.1
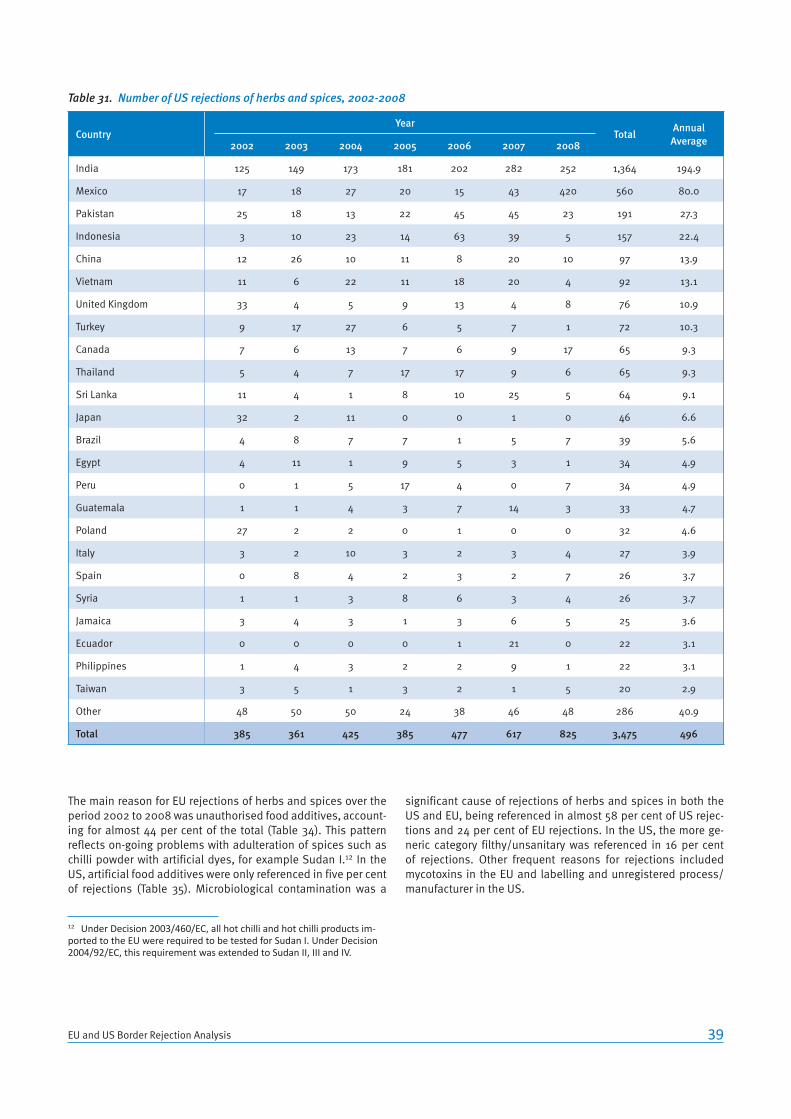
39EU and US Border Rejection Analysis
Table 31. Number of US rejections of herbs and spices, 2002-2008
CountryYear
TotalAnnual Average 2002 2003 2004 2005 2006 2007 2008
India 125 149 173 181 202 282 252 1,364 194.9
Mexico 17 18 27 20 15 43 420 560 80.0
Pakistan 25 18 13 22 45 45 23 191 27.3
Indonesia 3 10 23 14 63 39 5 157 22.4
China 12 26 10 11 8 20 10 97 13.9
Vietnam 11 6 22 11 18 20 4 92 13.1
United Kingdom 33 4 5 9 13 4 8 76 10.9
Turkey 9 17 27 6 5 7 1 72 10.3
Canada 7 6 13 7 6 9 17 65 9.3
Thailand 5 4 7 17 17 9 6 65 9.3
Sri Lanka 11 4 1 8 10 25 5 64 9.1
Japan 32 2 11 0 0 1 0 46 6.6
Brazil 4 8 7 7 1 5 7 39 5.6
Egypt 4 11 1 9 5 3 1 34 4.9
Peru 0 1 5 17 4 0 7 34 4.9
Guatemala 1 1 4 3 7 14 3 33 4.7
Poland 27 2 2 0 1 0 0 32 4.6
Italy 3 2 10 3 2 3 4 27 3.9
Spain 0 8 4 2 3 2 7 26 3.7
Syria 1 1 3 8 6 3 4 26 3.7
Jamaica 3 4 3 1 3 6 5 25 3.6
Ecuador 0 0 0 0 1 21 0 22 3.1
Philippines 1 4 3 2 2 9 1 22 3.1
Taiwan 3 5 1 3 2 1 5 20 2.9
Other 48 50 50 24 38 46 48 286 40.9
Total 385 361 425 385 477 617 825 3,475 496
The main reason for EU rejections of herbs and spices over the period 2002 to 2008 was unauthorised food additives, account-ing for almost 44 per cent of the total (Table 34). This pattern reflects on-going problems with adulteration of spices such as chilli powder with artificial dyes, for example Sudan I.12 In the US, artificial food additives were only referenced in five per cent of rejections (Table 35). Microbiological contamination was a
12 Under Decision 2003/460/EC, all hot chilli and hot chilli products im-ported to the EU were required to be tested for Sudan I. Under Decision 2004/92/EC, this requirement was extended to Sudan II, III and IV.
significant cause of rejections of herbs and spices in both the US and EU, being referenced in almost 58 per cent of US rejec-tions and 24 per cent of EU rejections. In the US, the more ge-neric category filthy/unsanitary was referenced in 16 per cent of rejections. Other frequent reasons for rejections included mycotoxins in the EU and labelling and unregistered process/manufacturer in the US.

40 UNIDO Working Paper
Table 32. Unit rejection rate for EU herb and spice imports from Third Countries, 2002-2008
CountryValue of Exports
2002-08
(US$ million)
Moving Average
2002-04 2003-05 2004-06 2005-07 2006-08
India 621 0.444 0.603 0.505 0.382 0.208
China 555 0.066 0.081 0.101 0.077 0.052
Indonesia 463 0.024 0.042 0.050 0.044 0.026
Brazil 442 0.027 0.049 0.066 0.039 0.029
Vietnam 403 0.026 0.076 0.099 0.108 0.072
United States 340 0.008 0.015 0.027 0.034 0.039
Madagascar 304 0.000 0.000 0.000 0.000 0.000
Iran 272 0.012 0.012 0.012 0.000 0.000
Israel 268 0.012 0.020 0.016 0.023 0.021
Turkey 235 0.750 0.907 0.729 0.330 0.201
Peru 233 0.021 0.028 0.007 0.088 0.081
Morocco 150 0.064 0.124 0.201 0.228 0.156
Egypt 134 0.402 0.500 0.408 0.204 0.128
Thailand 129 0.159 1.153 1.401 1.717 0.934
South Africa 97 0.085 0.109 0.043 0.024 0.000
Kenya 86 0.000 0.000 0.000 0.000 0.014
Chile 81 0.040 0.040 0.000 0.000 0.018
Sri Lanka 67 0.154 0.287 0.322 0.217 0.130
Guatemala 61 0.000 0.000 0.000 0.000 0.000
Mexico 58 0.000 0.045 0.045 0.089 0.043
Syria 57 0.240 0.234 0.234 0.135 0.149
Comoros 56 0.000 0.000 0.082 0.082 0.082
Albania 53 0.000 0.051 0.051 0.051 0.000
Tunisia 50 0.062 0.129 0.129 0.066 0.000
Malaysia 48 0.089 0.231 0.142 0.185 0.043
Grenada 41 0.000 0.000 0.134 0.134 0.134
Zimbabwe 39 0.000 0.000 0.000 0.000 0.000
Croatia 39 0.000 0.000 0.000 0.000 0.000
Papua New Guinea 37 0.000 0.000 0.000 0.000 0.000
Australia 36 0.000 0.000 0.000 0.000 0.000
Canada 34 0.000 0.000 0.000 0.000 0.060
Serbia 30 0.000 0.000 0.000 0.030 0.030
Macedonia 28 0.000 0.000 0.300 0.300 0.300
Singapore 26 0.183 0.083 0.083 0.000 0.000
Nigeria 25 0.119 0.194 0.406 0.510 0.435
Pakistan 23 2.605 4.025 3.618 2.528 0.816
Argentina 22 0.000 0.000 0.000 0.000 0.000
Average - 0.121 0.211 0.226 0.194 0.115
Note: Rejection rate converted to US$ at respective average annual exchange rate.

41EU and US Border Rejection Analysis
Table 33. Unit rejection rate for US herb and spice imports, 2002-2008
CountryValue of Exports
2002-08
(US$ million)
Moving Average
2002-04 2003-05 2004-06 2005-07 2006-08
India 779 1.892 2.109 2.134 1.971 1.666
China 651 0.215 0.192 0.106 0.131 0.117
Indonesia 608 0.144 0.223 0.550 0.587 0.508
Madagascar 560 0.000 0.000 0.000 0.000 0.000
Mexico 334 0.526 0.524 0.464 0.488 2.888
Brazil 245 0.205 0.228 0.145 0.114 0.118
Peru 221 0.129 0.285 0.280 0.188 0.069
Vietnam 220 0.544 0.462 0.527 0.499 0.413
Turkey 171 0.949 0.891 0.660 0.246 0.154
Spain 165 0.191 0.223 0.144 0.103 0.137
Germany 118 0.107 0.052 0.015 0.000 0.000
Israel 92 0.065 0.065 0.029 0.016 0.036
Chile 75 0.027 0.027 0.000 0.000 0.000
Egypt 69 0.654 0.879 0.568 0.619 0.267
Sri Lanka 61 0.729 0.656 0.780 1.475 1.214
Canada 53 1.109 1.078 1.133 1.083 1.374
France 48 0.519 0.269 0.036 0.000 0.053
Uganda 47 0.000 0.000 0.000 0.000 0.000
Syria 41 0.313 0.564 0.838 0.798 0.997
Thailand 39 1.054 1.843 2.735 2.824 1.915
Colombia 38 0.521 0.203 0.346 0.195 0.329
South Africa 34 0.118 0.000 0.000 0.000 0.000
Taiwan 31 0.855 0.760 0.460 0.423 0.494
Guatemala 30 0.508 0.793 1.580 2.313 2.099
Comoros 29 0.000 0.000 0.000 0.000 0.000
Italy 28 1.306 1.616 1.607 1.030 1.008
Albania 27 0.119 0.000 0.000 0.000 0.000
Average - 0.554 0.561 0.645 0.698 0.773
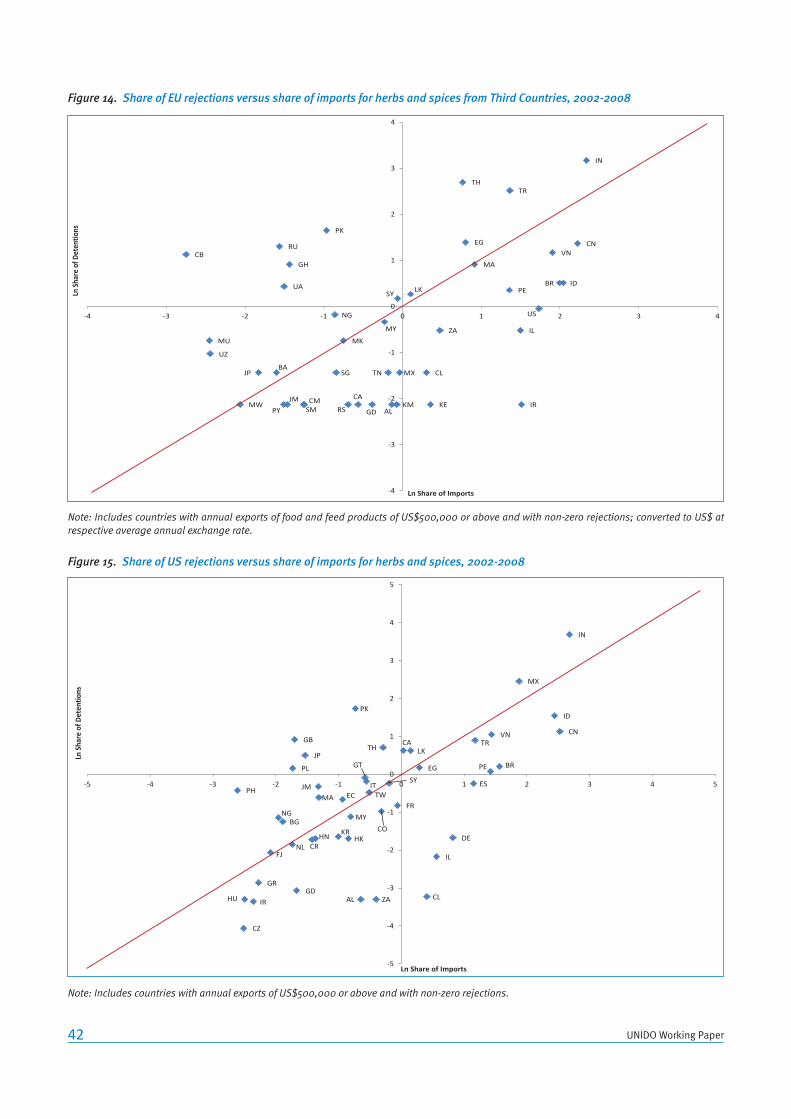
42 UNIDO Working Paper
Figure 14. Share of EU rejections versus share of imports for herbs and spices from Third Countries, 2002-2008
IN
CN
ID BR
VN
US
IR
IL
TR
PE
MA
EG
TH
ZA
KE
CL
LK
MX
SY
KM AL
TN
MY
GD
CA
RS
MK
SG
NG
PK
CM SM
GH
JM
UA
PY
RU
BA JP
MW
UZ
MU
CB
-4
-3
-2
-1
0
1
2
3
4
-4 -3 -2 -1 0 1 2 3 4
Ln Sh
are
of D
eten
tions
Ln Share of Imports
Note: Includes countries with annual exports of food and feed products of US$500,000 or above and with non-zero rejections; converted to US$ at respective average annual exchange rate.
Figure 15. Share of US rejections versus share of imports for herbs and spices, 2002-2008
IN
CN
ID
MX
BR PE
VN TR
ES
DE
IL
CL
EG
LK CA
FR
SY
TH
CO
ZA
TW
GT
IT
AL
PK
HK
MY
EC
KR
MA JM
CR HN
JP
GB
PL
GD
NL
BG NG
FJ
GR
CZ
IR HU
PH
-5
-4
-3
-2
-1
0
1
2
3
4
5
-5 -4 -3 -2 -1 0 1 2 3 4 5
Ln S
hare
of D
eten
tions
Ln Share of Imports
Note: Includes countries with annual exports of US$500,000 or above and with non-zero rejections.
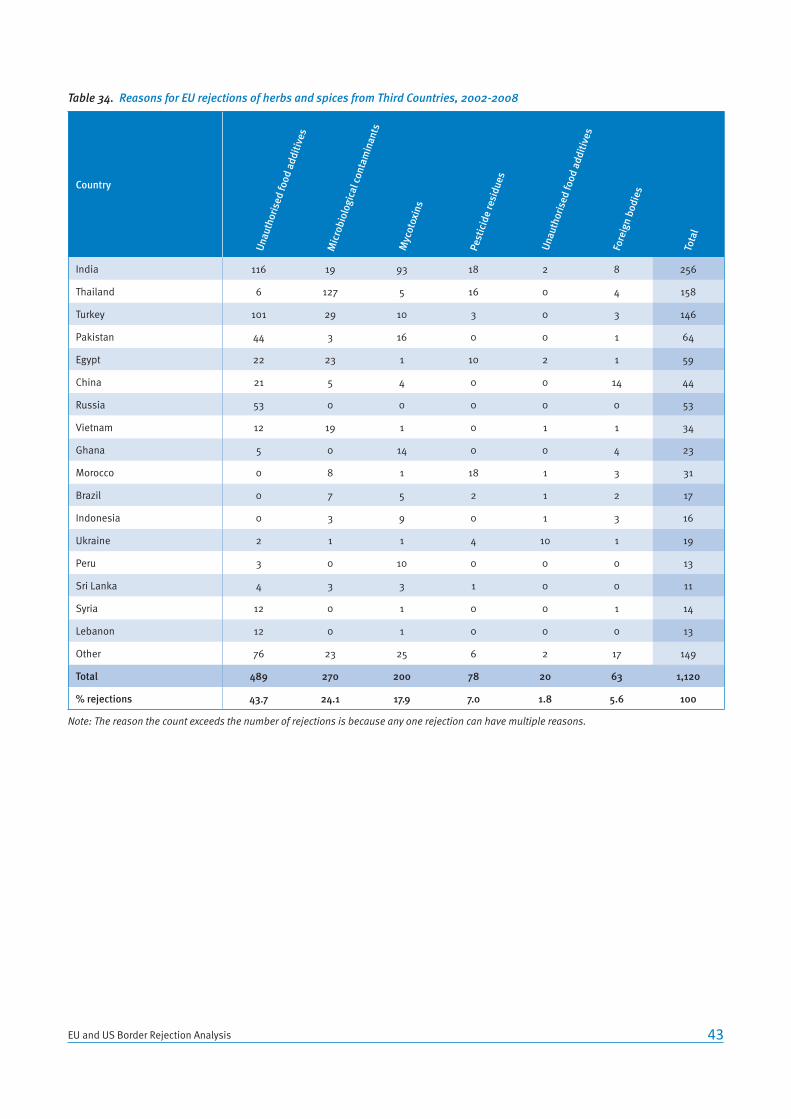
43EU and US Border Rejection Analysis
Table 34. Reasons for EU rejections of herbs and spices from Third Countries, 2002-2008
Country
India 116 19 93 18 2 8 256
Thailand 6 127 5 16 0 4 158
Turkey 101 29 10 3 0 3 146
Pakistan 44 3 16 0 0 1 64
Egypt 22 23 1 10 2 1 59
China 21 5 4 0 0 14 44
Russia 53 0 0 0 0 0 53
Vietnam 12 19 1 0 1 1 34
Ghana 5 0 14 0 0 4 23
Morocco 0 8 1 18 1 3 31
Brazil 0 7 5 2 1 2 17
Indonesia 0 3 9 0 1 3 16
Ukraine 2 1 1 4 10 1 19
Peru 3 0 10 0 0 0 13
Sri Lanka 4 3 3 1 0 0 11
Syria 12 0 1 0 0 1 14
Lebanon 12 0 1 0 0 0 13
Other 76 23 25 6 2 17 149
Total 489 270 200 78 20 63 1,120
% rejections 43.7 24.1 17.9 7.0 1.8 5.6 100
Note: The reason the count exceeds the number of rejections is because any one rejection can have multiple reasons.
Unau
thor
ised
food
add
itive
s
Mic
robi
olog
ical
con
tam
inan
ts
Myc
otox
ins
Pest
icid
e re
sidu
es
Unau
thor
ised
food
add
itive
s
Fore
ign
bodi
es
Tota
l

44 UNIDO Working Paper
Table 35. Reasons for US rejections of herbs and spice imports, 2002-2008
Country
India 953 320 320 60 100 86 43 1,882
Mexico 433 82 70 2 19 10 7 623
Indonesia 26 38 6 183 7 0 0 260
Pakistan 150 34 9 33 6 0 0 232
United Kingdom 2 134 1 11 22 0 0 170
China 29 35 30 6 0 16 3 119
Vietnam 67 31 4 4 4 2 0 112
Canada 26 52 10 5 7 0 1 101
Sri Lanka 26 29 18 17 0 0 0 90
Japan 0 45 0 37 5 0 1 88
Turkey 65 14 3 3 0 0 0 85
Thailand 38 7 12 6 5 4 0 72
Poland 0 54 1 7 0 0 0 62
Guatemala 1 39 2 5 0 12 0 59
Brazil 27 13 3 10 0 0 1 54
Syria 14 23 3 7 0 0 0 47
Peru 5 11 4 0 2 21 0 43
Italy 1 13 0 28 1 0 0 43
Egypt 26 7 4 0 0 2 0 39
Spain 10 5 3 13 1 1 0 33
Philippines 1 2 8 20 1 1 0 33
Jamaica 5 3 3 15 0 0 5 31
Jordan 5 17 5 2 1 0 0 30
Other 99 211 34 47 11 14 13 429
Total 2,009 1,219 553 521 192 169 74 4,737
% Rejections 57.8 35.1 15.9 15.0 5.5 4.9 2.1 -
Mic
robi
olog
ical
con
tam
inan
ts
Labe
lling
Filth
y/un
sani
tary
Unre
gist
ered
pro
cess
/man
ufac
ture
rUn
auth
oris
ed fo
od a
dditi
ves
Pest
icid
e re
sidu
es
Oth
er
Tota
l

45EU and US Border Rejection Analysis
6. Comparative analysis of rejections in EU and US marketsThe analysis of the RASFF and OASIS data has produced a large volume of results which, as a whole, provides an indication of the compliance performance of substantive exporters of agri-food products to the EU and the US. In describing the data, an attempt has been made to highlight key patterns and trends, and especially countries that appear to have relatively poor or relatively good compliance performance. Looking at the results as a whole, the following general observations can be made:
There are significant differences in the patterns of rejections between the EU and the US, reflecting the composition of trade and distinct food safety and other requirements and associated systems of enforcement. For example, EU rejec-tions were dominated by products that contravene restric-tions on levels of mycotoxins. In the US, non-compliance with labelling and company/process registration require-ments was a frequent cause of rejections.
A large proportion of rejections, both in total and across the four focal commodities, are attributable to a relatively small number of countries. In the EU, Iran, China, Turkey, India and Thailand were developing countries with consistently large numbers of rejections. Mexico, India, China, Dominican Re-public, Vietnam, Indonesia and Thailand were amongst the countries with large numbers of US rejections.
In order to examine the compliance performance of develop-ing countries, attention must focus on the unit and relative rejection rates. For example, Mexico had a large number of US rejections predominantly because of the magnitude of its agri-food exports. Its unit rejection rate, while above the all-country average, was much lower than for a number of other large developing country exporters. India, Vietnam and the Philippines, for example, had high rejection rates in the EU and the US. Other countries performed relatively well in one market, but less well in the other. For example, China had the highest unit rejection rate of major agri-food export-ers to the EU but exhibited a much better performance with exports to the US.
For some countries, high levels of rejections are observed across a number of food commodities. For example, India had a high relative rejection rate – it accounted for a greater proportion of rejections than its share of imports – in both the EU and the US for all foods, fish and fishery products, fruits and vegetables and herbs and spices. For these coun-tries, compliance with export market food safety and related requirements appears to be a systemic problem. The poor compliance performance of other countries was restricted to particular commodities, suggesting localised capacity problems. For example, Iran had the largest number of EU rejections of any country, but this was almost entirely down to high levels of rejections for nuts and seeds.
A number of countries, many of which are major exporters of agri-food products, demonstrated good compliance per-formance in both the EU and the US and across most (if not all) of the agri-food commodities they exported. Examples
include Chile, Argentina, Ecuador and South Africa. Presum-ably, these countries have relatively well-developed compli-ance capacity in general.
Numerous (indeed the majority of) countries had sporadic rejections. Care needs to be taken in interpreting these. Very large rejections in particular provide an indication of acute compliance problems. Examining these rejections in the context of trade flows in subsequent years shows the degree to which the country had been able to ‘recover’. The more general scattering of large numbers of low levels of re-jections, however, should be regarded as ‘noise’ and not a reliable indicator of compliance capacity.
It is very easy to get lost in the myriad of data and the vari-ous measures that have been presented above. At the same time, the performance of particular countries, over time and across product exports and/or export markets, is of key in-terest. While the plots of relative compliance rates provide useful information in this regard, close groupings of coun-tries can make them difficult to read, and each plot only provides information on a particular product and export market. Thus, below, a summary measure of compliance performance across products and export markets is devel-oped; this is termed the Relative Rejection Rate Indicator (RRRI). At the current time, the results should be viewed very much as ‘work in progress’ and interpreted with some cau-tion.
The RRRI provides a summary of the compliance performance of each country relative to the average rejection rate for particu-lar products in specific markets. In this way, the RRRI aims to maximise the comparability of the rejection data between the EU and the US and across products. Thus, using the RRRI it is possible to see whether a country performs relatively well/badly overall and to identify areas of particularly good and/or poor performance. In turn, it is possible to identify countries where general compliance capacity is weak or particular products and/or export markets where compliance is an issue. This is impor-tant information for the allocation and design of technical assis-tance aimed at trade capacity-building. The RRRI focuses on the period 2002 to 2008 in order to identify longer-term compliance issues and to minimise the ‘noise’ created by the large scatter of small numbers of rejections across exporters and products.
The RRRI for each country-product-export market combination and for total food exports by country and export market is de-rived as follows:
1. The ratio of the proportion of rejections to the appropriation of imports is calculated, in the same manner as the relative rejection rate described above.
2. For countries with positive rejections, the ratio derived in 1 above is converted into natural logarithms in order to gener-ate a normal distribution. Countries with zero rejections are labelled ‘none’.
3. The natural logarithms are divided into three equal groups to create a tercile distribution. Countries in the highest ter-cile are labelled ‘high’, middle tercile are labelled ‘medium’ and bottom tercile are labelled ’low’.

46 UNIDO Working Paper
Table 36 reports the RRRI for each country with substantive ex-ports of total food and/or any of the four focal commodities. Where cells are empty, there were zero exports over the period 2002 to 2008. Improving performance is indicated by the pro-gression from none, through low and medium to high. Electing some countries as illustration:
Brazil had a low relative rejection rate for all food exports to the EU and the US over the period 2002 to 2008. However, it had high and medium rejection rates for fish and fishery products for exports to the EU and the US, respectively. Bra-zil’s rejection rate for nuts and seeds is classed as medium. In both the EU and the US, Brazil had a low rejection rate for fruits and vegetables and herbs and spices.
Chile had a relative rejection rate classed as low or none for all food commodity exports to the EU and the US, with the one exception of fish and fishery product exports to the EU, which is classed as medium. As can be seen in Figure 8, Chile is positioned just below the 45o line for fish and fishery product exports to the EU over the period 2002 to 2008.
The relative rejection rate for all food exports from China is classified as high with respect to the EU and medium with respect to the US. For the four food commodities included in the analysis, China’s relative rejection rate was low in the US and medium for the EU. Presumably, China performed less well with respect to exports of specific agri-food products not covered by this analysis.
Iran had a high relative rejection rate for fruit and vegeta-ble and nut and seed exports to the EU, but a low rejection rate for herb and spice exports. Its relative rejection rate for fruit and vegetable and nut and seed exports to the US, con-versely, was medium.
While reiterating that caution needs to be taken in interpreting the values of the RRRI, and in particular remembering that these values reflect the nature and quality of the underlying data, they do provide a convenient summary of patterns of compliance performance of countries across export products and markets. In so doing, the RRRI provides a very broad initial indicator of both the degree to which countries struggle with compliance and the specific areas where problems are most acute.
Table 36. Relative rejection rate for imports to the EU and the US by country, 2002-2008
Country
European Union United States
TotalFish and Fishery
Products
Fruit and Vegetables
Nuts and Seeds
Herbs and Spices
TotalFish and Fishery
Products
Fruit and Vegetables
Nuts and Seeds
Herbs and Spices
Afghanistan High None High Low None High High None None
Albania High Medium High None Low Low None Low
Algeria Medium Medium Medium None None High High
Angola High High None None None
Antigua and Barbuda
None None None None None None None None
Argentina Low Low Low Low None Low Low Low Low Medium
Armenia High None None None None High None Medium Medium None
Aruba Medium None High High None
Australia Low High Medium Low None Low Low Low None None
Austria n/a n/a n/a n/a n/a Low None None None None
Azerbaijan High None None Low None Low Medium Low None None
Bahamas None None None None Low Low None None
Bahrain None None None None None Medium None
Bangladesh High High High High High Medium Medium High High High
Barbados None None None None Medium Medium High
Belarus Medium None Medium None None High High High None
Belgium n/a n/a n/a n/a n/a Low Low Low None None
Belize None None None Low Low None None
Benin Medium High None None None High High High
Bermuda None None None None Low None
Bhutan None None None None None None None None
Bolivia Medium None None Low None Medium Medium Low None

47EU and US Border Rejection Analysis
Bosnia and Herzegovina
Medium None Medium None Medium High None Medium None None
Botswana High None None None None None
Brazil Low High Low Medium Low Low Medium Low Low Low
Brunei Darussalam
None None None None Medium Medium
Bulgaria n/a n/a n/a n/a n/a High None Medium Medium Medium
Burkina Faso Medium None None High None High None High None None
Burundi None None None None None None
Cambodia High None None None High Low Low None Medium None
Cameroon Low None Low None Low Medium None High None High
Canada Low Low Low Low Low Low Low Low Low Medium
Cape Verde Medium Medium None High High
Cayman Islands None None None None None None None None
Central African Republic
None None None None
Chad None None None None
Chile Low Medium Low Low Low Low Low Low None Low
Hong Kong High None High High None High High High Medium Low
China High Medium Medium Medium Medium Medium Low Low Low Low
Colombia Low Medium Low None None Low Low Low High Low
Comoros Medium None None Low None None
Congo Brazzaville Medium High High None None None None None
DRC Low None None None None None None
Cook Islands None None None High High None
Costa Rica Low Medium Low None None Low Low Low None Low
Croatia Medium High Medium Medium None Medium High Medium None None
Cuba Low Low None None None
Cyprus n/a n/a n/a n/a n/a High Low High None None
Czech Republic n/a n/a n/a n/a n/a Medium None High Low
Denmark n/a n/a n/a n/a n/a Low Medium Medium None None
Djibouti None None None None Medium High None
Dominica None None None None None High High Medium None
Dominican Republic
Medium None Medium None None High Medium High Low High
Ecuador Low Low Low Medium None Low Low Low None Medium
Egypt High Medium Medium High Medium High High Medium High Medium
El Salvador Low None None None None Medium Medium Low High High
Equatorial Guinea
None None None High
Eritrea High None None None High None None None
Estonia n/a n/a n/a n/a n/a None None None None
Ethiopia Low None None High High Low Medium None High
Country
European Union United States
TotalFish and Fishery
Products
Fruit and Vegetables
Nuts and Seeds
Herbs and Spices
TotalFish and Fishery
Products
Fruit and Vegetables
Nuts and Seeds
Herbs and Spices

48 UNIDO Working Paper
Fiji Medium High High None None Medium Low Medium None Medium
Finland n/a n/a n/a n/a n/a Low None None None
France n/a n/a n/a n/a n/a Low Medium Medium Medium Low
Gabon Medium Medium None None None None None None
Gambia High High None Medium None High High High High
Georgia High None None Low None High None Medium None High
Germany n/a n/a n/a n/a n/a Low Medium Low None Low
Ghana Medium Medium Medium High High High High Medium High High
Greece n/a n/a n/a n/a n/a Medium Medium Low Medium Low
Greenland Low Low None None Medium None None
Grenada Medium High None Low None Medium High Low
Guadeloupe n/a n/a n/a n/a n/a Medium High
Guatemala Low Low Low None None Medium Medium Low Low Medium
Guinea Medium Low None Medium None High High None None High
Guinea-Bissau None None None None None None
Guyana Low None None None Medium Medium Medium None High
Haiti Medium None None None None High High Low High
Honduras Low Low Medium None None Medium Low Low Medium Medium
Hungary n/a n/a n/a n/a n/a Medium None Low None Low
Iceland Low Low None None None Low Low High None
India High High Medium Low Medium High Medium Medium Low Medium
Indonesia Medium High Low Low Low Medium Medium Low Medium Low
Iran High None High High Low High Medium Medium Medium Low
Iraq None None None None None None None
Ireland n/a n/a n/a n/a n/a Low High Medium None None
Israel Low None Low Medium Low Medium High Low Low Low
Italy n/a n/a n/a n/a n/a Low High Medium Low Medium
Cote d’Ivoire Low Medium Low Low None Low High High None None
Jamaica Low Medium Low None Low Medium Medium Medium None Medium
Japan Medium Medium High Low None High Medium Medium High High
Jordan High None Medium None High High High High High High
Kazakhstan Medium Medium High None None None None
Kenya Low Medium Low None Low Low None Medium None Medium
Kiribati None None None None None None None
North Korea High High High
South Korea High None None None None High High Medium Medium Low
Kosovo High None None None
Kuwait High None None High High High High
Kyrgyzstan Medium None Medium None None None None None None
Lao None None None None None None None None None None
Country
European Union United States
TotalFish and Fishery
Products
Fruit and Vegetables
Nuts and Seeds
Herbs and Spices
TotalFish and Fishery
Products
Fruit and Vegetables
Nuts and Seeds
Herbs and Spices

49EU and US Border Rejection Analysis
Country
European Union United States
TotalFish and Fishery
Products
Fruit and Vegetables
Nuts and Seeds
Herbs and Spices
TotalFish and Fishery
Products
Fruit and Vegetables
Nuts and Seeds
Herbs and Spices
Latvia n/a n/a n/a n/a n/a High High High None
Lebanon High None High High High High High Medium High
Lesotho None None None None
Liberia None None None High High High
Libya None None None None None None
Liechtenstein None None None None None
Lithuania n/a n/a n/a n/a n/a Medium High High None
Luxembourg n/a n/a n/a n/a n/a None
Macao High None None None None Medium Medium High None High
Macedonia Medium None None None Medium High Medium High Medium
Madagascar Low Low Medium None None Low Medium None None None
Malawi Medium None None Medium Medium Low None Low None None
Malaysia Medium High Medium Medium Medium Low Medium Low Medium Low
Maldives Medium Medium None None Medium High
Mali Medium None None High None High None
Malta n/a n/a n/a n/a n/a Medium Low None
Martinique n/a n/a n/a n/a n/a High None
Mauritania Low Low None None None High None High
Mauritius Low Low None None High Low Low None None None
Mexico Low Medium Low None Low Medium Medium Low Low Medium
Moldova Medium None High Low None High High None
Monaco High High None High High
Mongolia High None None None None None
Montenegro None None None None None None
Morocco Medium Medium Low Low Medium Low Low Low Medium
Mozambique Low Low None Low None Low Medium High None
Myanmar High High None None None High Medium High
Namibia Medium Low None None None Low Low None
Nepal Medium None None None High None None
Netherlands n/a n/a n/a n/a n/a Low Low Low Medium Medium
New Zealand Low Low None None None Low Low Low None High
Nicaragua Medium Low None Medium None Medium Low Low Low Medium
Niger None None None None None High High
Nigeria High Medium High High Medium Medium High High Medium Medium
Niue None None None None
Norway Low Low None Low Medium Low Low High None None
Oman High High None None Medium None Medium None
Pakistan High Medium High Medium High High Medium High High High
Palestinian Ter-ritory
Medium None None None
Panama Medium High Low None None Low Low Low None Medium

50 UNIDO Working Paper
Papua New Guinea
Low Low None None None Low Medium None None None
Paraguay Medium None None Medium Medium Low None None None
Peru Low Low Low None Low Low Medium Low Low Low
Philippines Medium None Medium Low None Medium Medium Low Low High
Poland n/a n/a n/a n/a n/a Medium High Medium None High
Portugal n/a n/a n/a n/a n/a Medium High Medium None None
Puerto Rico High n/a n/a n/a n/a n/a
Qatar None None None None None
Romania n/a n/a n/a n/a n/a Medium None Medium None None
Russia Medium Low Medium Medium High Low Low Medium High Medium
Rwanda Low None High None Low
Samoa None None None Medium High Low None
San Marino High None None High
São Tomé and Príncipe
None None None High None
Saudi Arabia High None None High None Medium None High High None
Senegal Medium Medium Medium Medium None High High High High High
Serbia Low High Low High Medium Medium None Low None
Serbia and Mon-tenegro
Low High Low None Low High None Medium None High
Seychelles Low None None None Medium Low
Sierra Leone High None None High High High High Medium None
Singapore High High High Medium Medium Medium Medium Low None None
Slovakia n/a n/a n/a n/a n/a Medium High None
Slovenia n/a n/a n/a n/a n/a Medium High Medium None None
Somalia None None None None High None None None
South Africa Low Low Low Medium Low Medium Low Low None Low
Spain n/a n/a n/a n/a n/a Low Medium Low Low Low
Sri Lanka High High High Low Medium High High High Medium Medium
St Kitts and Nevis None None None None None High High
St Lucia None None None None None High None Medium None
St Vincent and the Grenadines
None None None None None High Low Medium
Sudan Medium None None High None Low None
Suriname Medium Medium High None None Medium Medium None None
Swaziland Low None Medium None None None
Sweden n/a n/a n/a n/a n/a Low High Low None None
Switzerland Low None None None None Low High Low Medium None
Syria High None High Medium Medium High None High High Medium
Taiwan High High None None None High Medium Medium High Medium
Tajikistan None None None None None None
Country
European Union United States
TotalFish and Fishery
Products
Fruit and Vegetables
Nuts and Seeds
Herbs and Spices
TotalFish and Fishery
Products
Fruit and Vegetables
Nuts and Seeds
Herbs and Spices

51EU and US Border Rejection Analysis
Tanzania Medium Low None None Medium Low None Medium None None
Thailand High Medium High Medium High Medium Low Low Low Medium
Togo Medium None None High None Medium High High None
Tonga High None None None High Low Low None None
Trinidad and Tobago
None None None None None Medium Low High None Medium
Tunisia Medium High Medium None Low Medium Medium Medium High None
Turkey High Medium High Low High Medium High Low Low
Turkmenistan None None None None None
Uganda Low Low None High None Low Low High None
Ukraine Medium None Medium Low High High Medium High Medium Low
United Arab Emir-ates
Low High None Medium High Medium Low Medium None High
United Kingdom n/a n/a n/a n/a n/a Medium Medium High Medium
USA Medium Low Low Low Low n/a n/a n/a n/a n/a
Uruguay Low Medium Medium None None Low Low Medium None None
Uzbekistan High High Medium None Medium Medium None None
Vanuatu None None None High None None None None
Venezuela Low Low None None Medium Medium Medium Low None None
Vietnam High High High Low Medium Medium Medium Medium Low Low
Yemen High Medium None None None Medium High
Zambia Low None None High None None None None None None
Zimbabwe Low None Medium High None Low None None
Country
European Union United States
TotalFish and Fishery
Products
Fruit and Vegetables
Nuts and Seeds
Herbs and Spices
TotalFish and Fishery
Products
Fruit and Vegetables
Nuts and Seeds
Herbs and Spices

52 UNIDO Working Paper
7. Further analysis
The analysis presented above represents just the starting point in what UNIDO aims to be on-going analysis and reporting of compliance performance as indicated by rejection data. In mov-ing forward, it is anticipated that there will be two threads to the analysis. First, further work on border rejection data, in particu-lar extending the analysis to:
Go beyond the EU and the US and include other export mar-kets, notably Japan, Canada and Australia. This will enable a more complete picture of the compliance performance of developing countries and its variation across markets.
Extend the analysis beyond the four focal commodities ex-plored here to other agri-food commodities that are of sig-nificance to substantive sub-sets of developing countries.
It is likely that, in extending and developing the analysis of rejection data, the focus will be on countries with substantive rejections. Rejection data are seen as providing a rather blunt indicator of substantive deficiencies in compliance capacity.
A second thread of this further work aims both to validate the patterns and trends revealed by the rejection data and to ex-plain these patterns and trends. A particular focus of this work will be on relating rejections to the status of compliance capaci-ty of exporting countries. It is envisaged that a series of in-depth case studies will be undertaken with countries according to the portfolio of values of the RRRI. Thus, the cases might include both countries with very specific compliance problems (con-fined to certain export products or a certain export market) and countries with more systemic weaknesses in compliance.
53EU and US Border Rejection Analysis
8. References
Ababouch, L., Gandini, G. and Ryder, J. (2005). Causes of Rejec-tions and Rejections in International Fish Trade. FAO Fisheries Technical Paper 473. Food and Agriculture Organisation, Rome.
Allshouse, J., Buzby, J., Harvey, D. and Zorn, D. (2008). Food Safety and Seafood Imports. In: Buzby, J.C. (ed). International Trade and Food Safety: Economic Theory and Case Studies. Ag-ricultural Economic Report 828. Economic Research Service, United States Department of Agriculture, Washington DC.
Buzby, J.C. and Regmi, A. (2009). FDA Refusals of Food Imports by Exporting Country Group. Choices, 24 (2), 11-15.
Buzby, J.C., Unnevehr, L.J. and Roberts, R. (2008). Food Safety and Imports: An Analysis of FDA Food-Related Import Refusal Reports. Economic Information Bulletin 39, Economic Research Service, United States Department of Agriculture, Washington DC.
Caswell, J.A. and Bach, C.F. (2007). Food Safety Standards in Rich and Poor Countries. In: Sando, P., Pinstrup-Andersen, P. and Sanda, P.E. (eds). Ethics, Hunger and Globalisation: In Search of Appropriate Policies. P281-304. Springer, Dordrecht.
Diaz Rios, L.B. and Jaffee, S. (2008). Barrier, Catalyst or Distrac-tion? Standards, Competitiveness and Africa’s Groundnut Ex-ports to Europe. Agriculture and Rural Development Discussion Papers 39. World Bank, Washington DC.
FAO (2005). Phytosanitary Capacity Evaluation (PCE) Tool, Rome: Food and Agriculture Organisation.
FAO (2006). Strengthening National Food Control Systems: Guidelines to Assess Capacity Building Needs, Rome: Food and Agriculture Organisation.
GAO (2001). Food Safety and Security: Fundamental Changes Needed to Ensure Safe Food. GAO-02-47T. United States General Accounting Office, Washington DC.
GAO (2004). Food Safety: FDA’s Imported Seafood Safety Pro-gram Shows Some Progress, but Further Improvements are Nec-essary. GAO-04-246. United States General Accounting Office, Washington DC.
GAO (2008). Federal Oversight of Food Safety: FDA’s Food Pro-tection Plan Proposes Positive First Steps, but Capacity is Criti-cal. GAO-08-435T. United States General Accounting Office, Washington DC.
Henson, S.J. and Masakure, O. (2009). Guidelines on the Use of Economic Analysis to Inform SPS-related Decision-Making. Standards and Trade Development Facility, World Trade Organi-sation, Geneva.
Jaffee, S. and Henson, S.J. (2004). Standards and Agro-Exports from Developing Countries: Rebalancing the Debate. Policy Re-search Working Paper 3348, World Bank, Washington DC.
Jaud, M., Cadot, O. and Eisenmann, A.S. (2009). Do Food Scares Explain Supplier Concentration? An Analysis of EU Agri-Food Im-ports. Working Paper 2009-28, Paris School of Economics, Paris.
OIE (2008) OIE Tool for the Evaluation of Performance of Veteri-nary Services (OIE PVS Tool), Paris: World Organisation for Ani-mal Health.
Otsuki, T. and Wilson, J.S. (2001). What price Precaution? Eu-ropean Harmonisation of Aflatoxin Regulations and African Groundnut Exports. European Review of Agricultural Economics, 28 (3), 263-284.
Otsuki, T., Wilson, J.S. and Sewadeh, M. (2001). Saving Two in a Billion: Quantifying the Trade Effect of European Standards on African Exports. Food Policy, 26 (5), 495-514.
World Bank (2005). Food Safety and Agricultural Health Stand-ards: Challenges and Opportunities for Developing Country Ex-ports, Poverty Reduction and Economic Management Trade Unit Report 31207, World Bank, Washington DC.

54 UNIDO Working Paper
Name AbbreviationAfghanistan AFAlbania ALArgentina ARArmenia AMAustralia AUAustria ATAzerbaijan AZBahamas BSBangladesh BDBarbardos BBBelgium BEBelize BZBermuda BMBolivia, Plurinational State of BOBosnia and Herzegovina BABrazil BRBrunei Darussalam BNBulgaria BGBritish Virgin Islands VGCambodia KHCameroon CMCanada CAChile CLChina CNColombia COCosta Rica CRCôte d‘Ivoire CICroatia HRCyprus CYCzech Republic CZDenmark DKDominican Republic DOEcuador ECEgypt EGEl Salvador SVEthiopia ETFiji FJFinland FIFrance FRFrench Polynesia PFGeorgia GEGermany DEGhana GHGreece GRGreenland GLGuatemala GT
Name AbbreviationGuyana GYHaiti HTHonduras HNHong Kong HKHungary HUIceland ISIndia INIndonesia IDIran, Republic of IRIreland IEIsrael ILItaly ITJamaica JMJapan JPJordan JOKenya KEKorea, Republic of KRLatvia LVLebanon LBLithuania LTMacau MO
Macedonia, the former Yugoslav Republic of MK
Madagascar MGMalaysia MYMalawi MWMaldives MVMalta MTMarshall Islands MHMauritius MUMexico MXMicronesia, Federated States of FMMoldova, Republic of MDMontenegro MEMorocco MAMozambique MZMyanmar MMNamibia NANetherlands NLNew Zealand NZNicaragua NINigeria NGNorway NOOman OMPakistan PKPanama PA
Name AbbreviationPapua New Guinea PGParaguay PYPeru PEPhilippines PHPoland PLPortugal PTRomania RORussian Federation RURwanda RWSamoa WSSaudi Arabia SASenegal SNSerbia RSSeychelles SCSingapore SGSlovakia SKSlovenia SISouth Africa ZASpain ESSri Lanka LKSaint Pierre and Miquelon PMSaint Vincent and the Grenadines VCSudan SDSuriname SRSweden SESwitzerland CHSyrian Arab Republic SYTaiwan TWTanzania, United Republic of TZTurks and Caicos Islands TCThailand THTogo TGTonga TOTrinidad and Tobago TTTunisia TNTurkey TRUnited Arab Emirates AEUganda UGUkraine UAUnited Kingdom GBUruguay UYUzbekistan UZVenezuela, Bolivarian Republic of VEVietnam VNYemen YEZimbabwe ZW
Appendix 1: Country abbreviations

55EU and US Border Rejection Analysis


UNITED NATIONS INDUSTRIAL DEVELOPMENT ORGANIZATIONVienna International Centre, P.O. Box 300, 1400 Vienna, AustriaTelephone: (+43-1) 26026-0, Fax: (+43-1) 26926-69E-mail: [email protected], Internet: http://www.unido.org
Printed in Slovakia August 2011 - 500


